Error Management
Error Management Console (EMC)
Section titled “Error Management Console (EMC)”The Error Monitor tab in the DQS application provides a dedicated interface for monitoring and resolving errors that occur during scan processing. It gives full visibility into batch failures, strategy errors, and platform issues — all in one place.
Layout
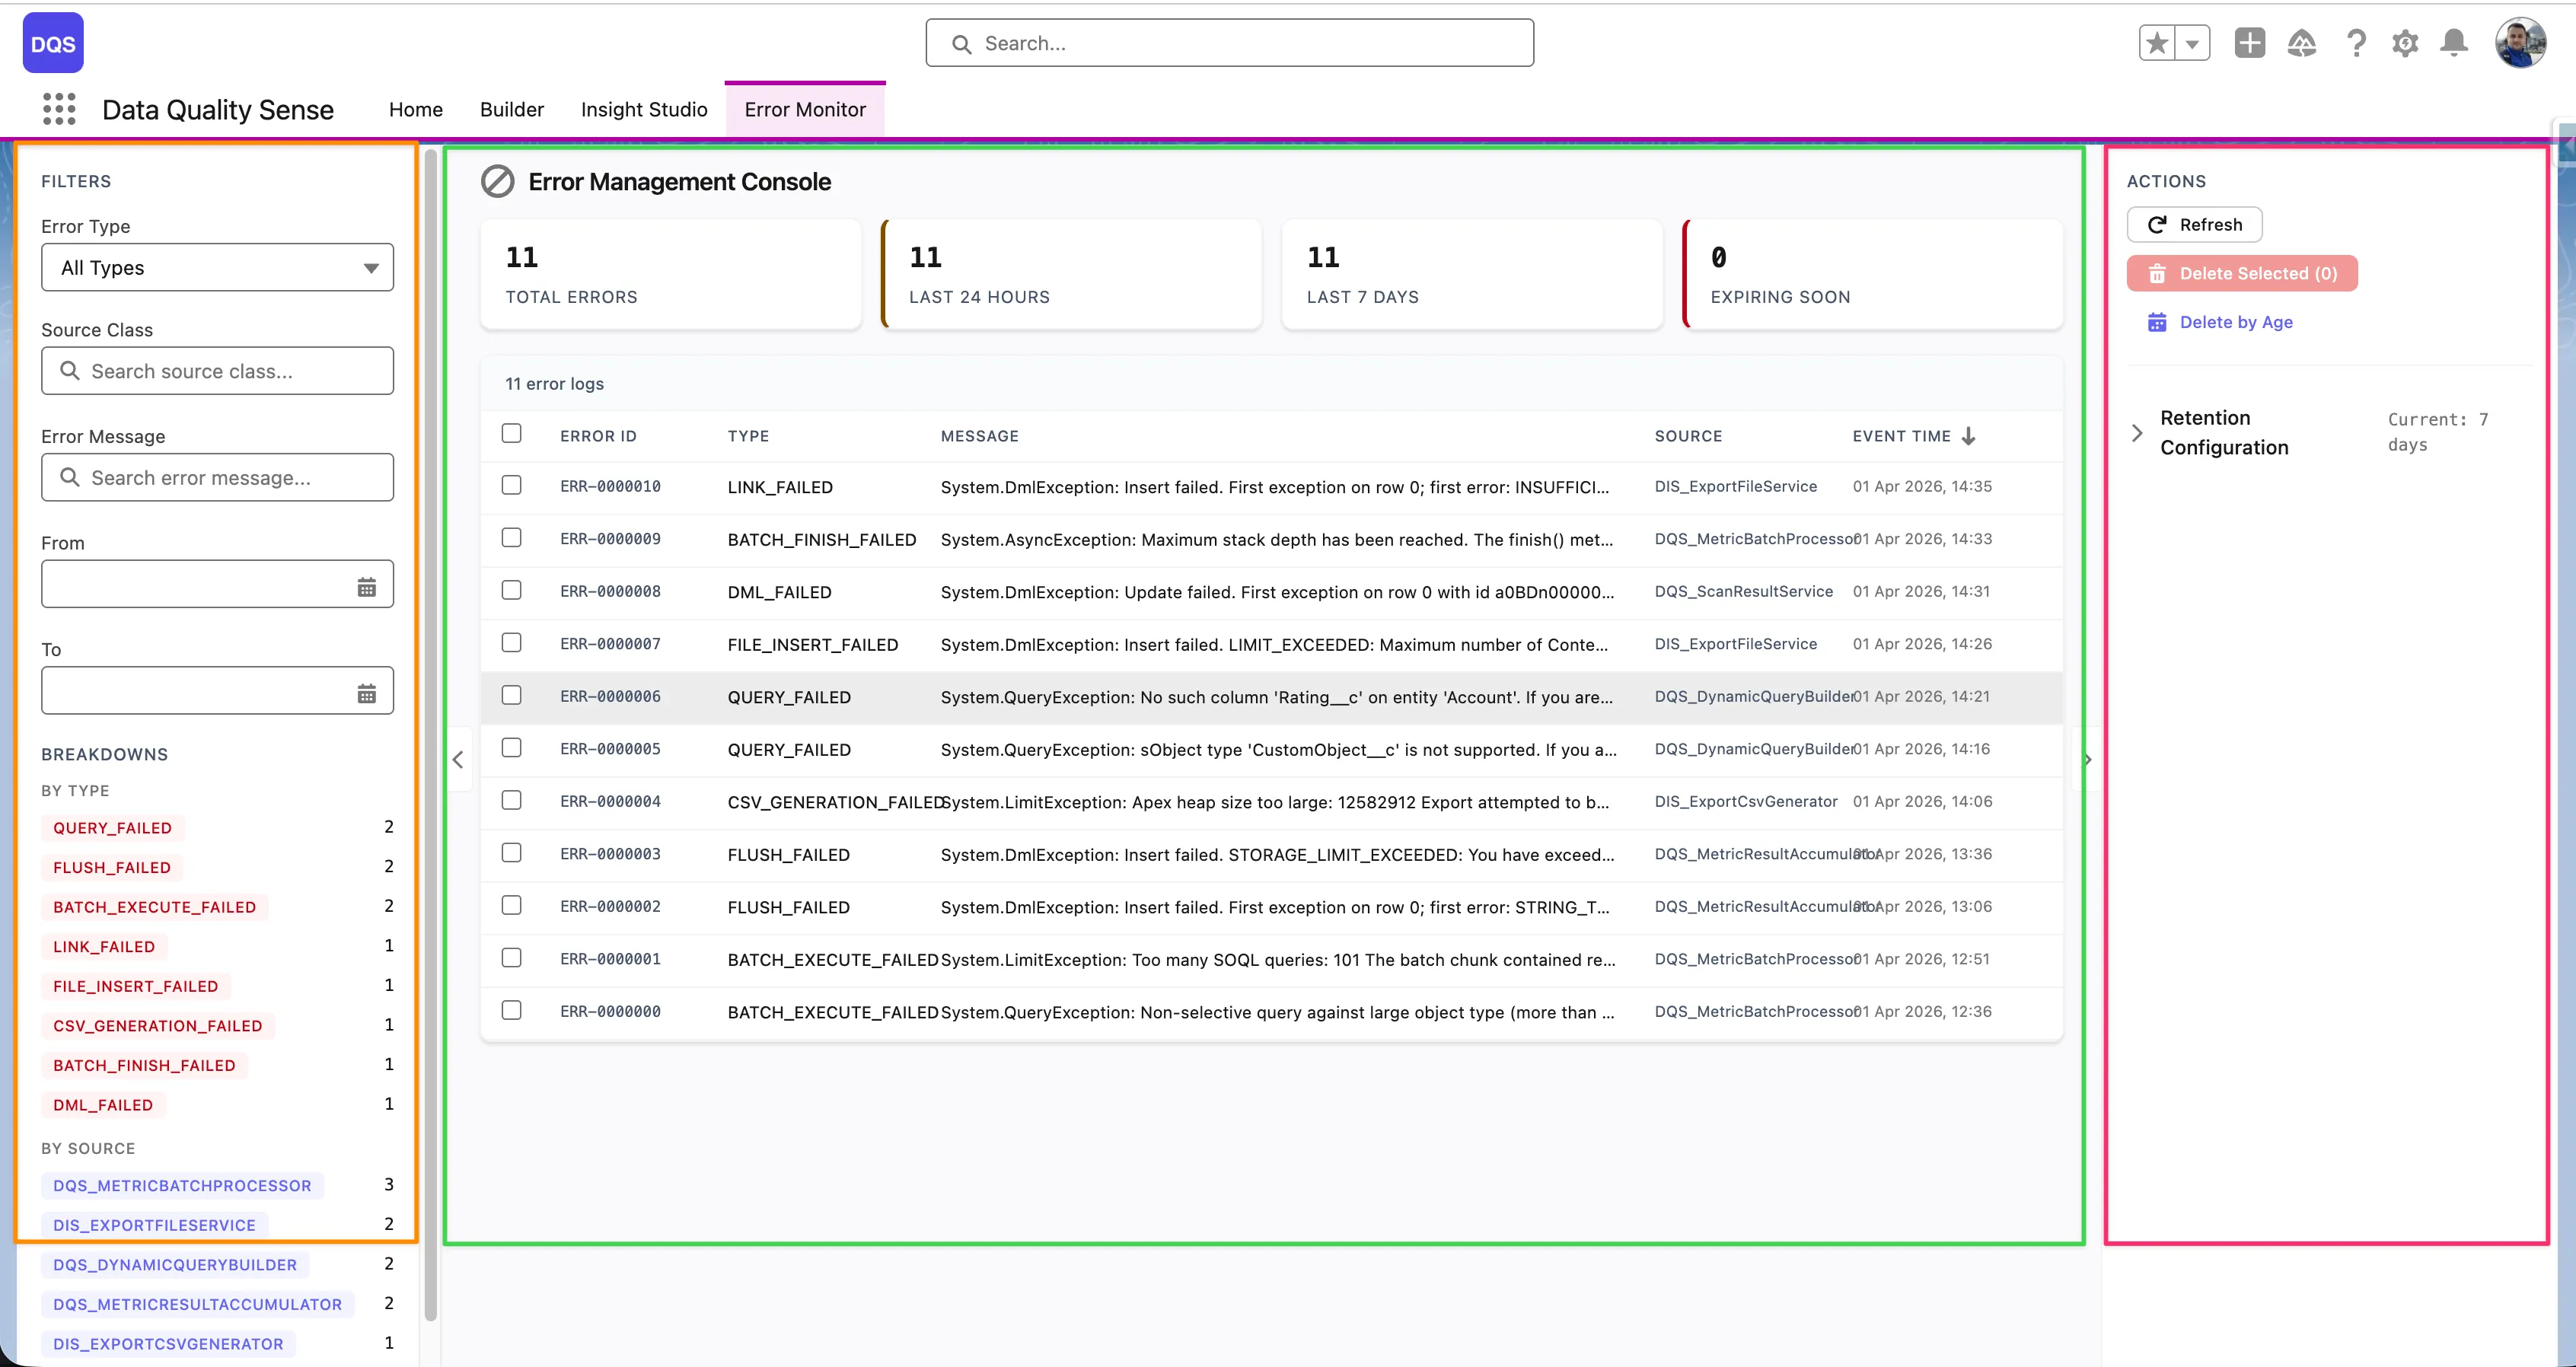
Section titled “Layout”The Error Management Console uses a 3-zone layout:
- Filters sidebar (left) — Filter errors by Error Type, Source Class, Error Message, time range (From/To), and IP address. A Breakdowns section groups errors by type, source, or other criteria, showing counts next to each category for quick triage.
- Error log table (center) — Sortable table listing all errors with summary columns. Displays total error counts across three time windows: Last 24 Hours, Last 7 Days, and Expiring Soon. Click any row to view full details.
- Actions panel (right) — Refresh the log, create a downloadable CSV export, delete selected entries, and configure the retention period.
Error Log Table
Section titled “Error Log Table”Each error row in the table shows the following columns:
| Column | Description |
|---|---|
| Error ID | Unique identifier for the error log entry |
| Type | Error category (e.g., DML_FAILED, QUERY_FAILED, FIELD_INSERT_FAILED, BATCH_EXECUTE_FAILED) |
| Message | Short error description (truncated — click the row to see the full message) |
| Source | The Apex class that generated the error (e.g., DQS_ExportFileService, DQS_DynamicQueryBuilder01) |
| Event Time | Timestamp of when the error occurred |
The top of the table shows aggregate counters — Total Errors, Last 24 Hours, Last 7 Days, and Expiring Soon — giving you an at-a-glance health overview.
Row Detail Modal
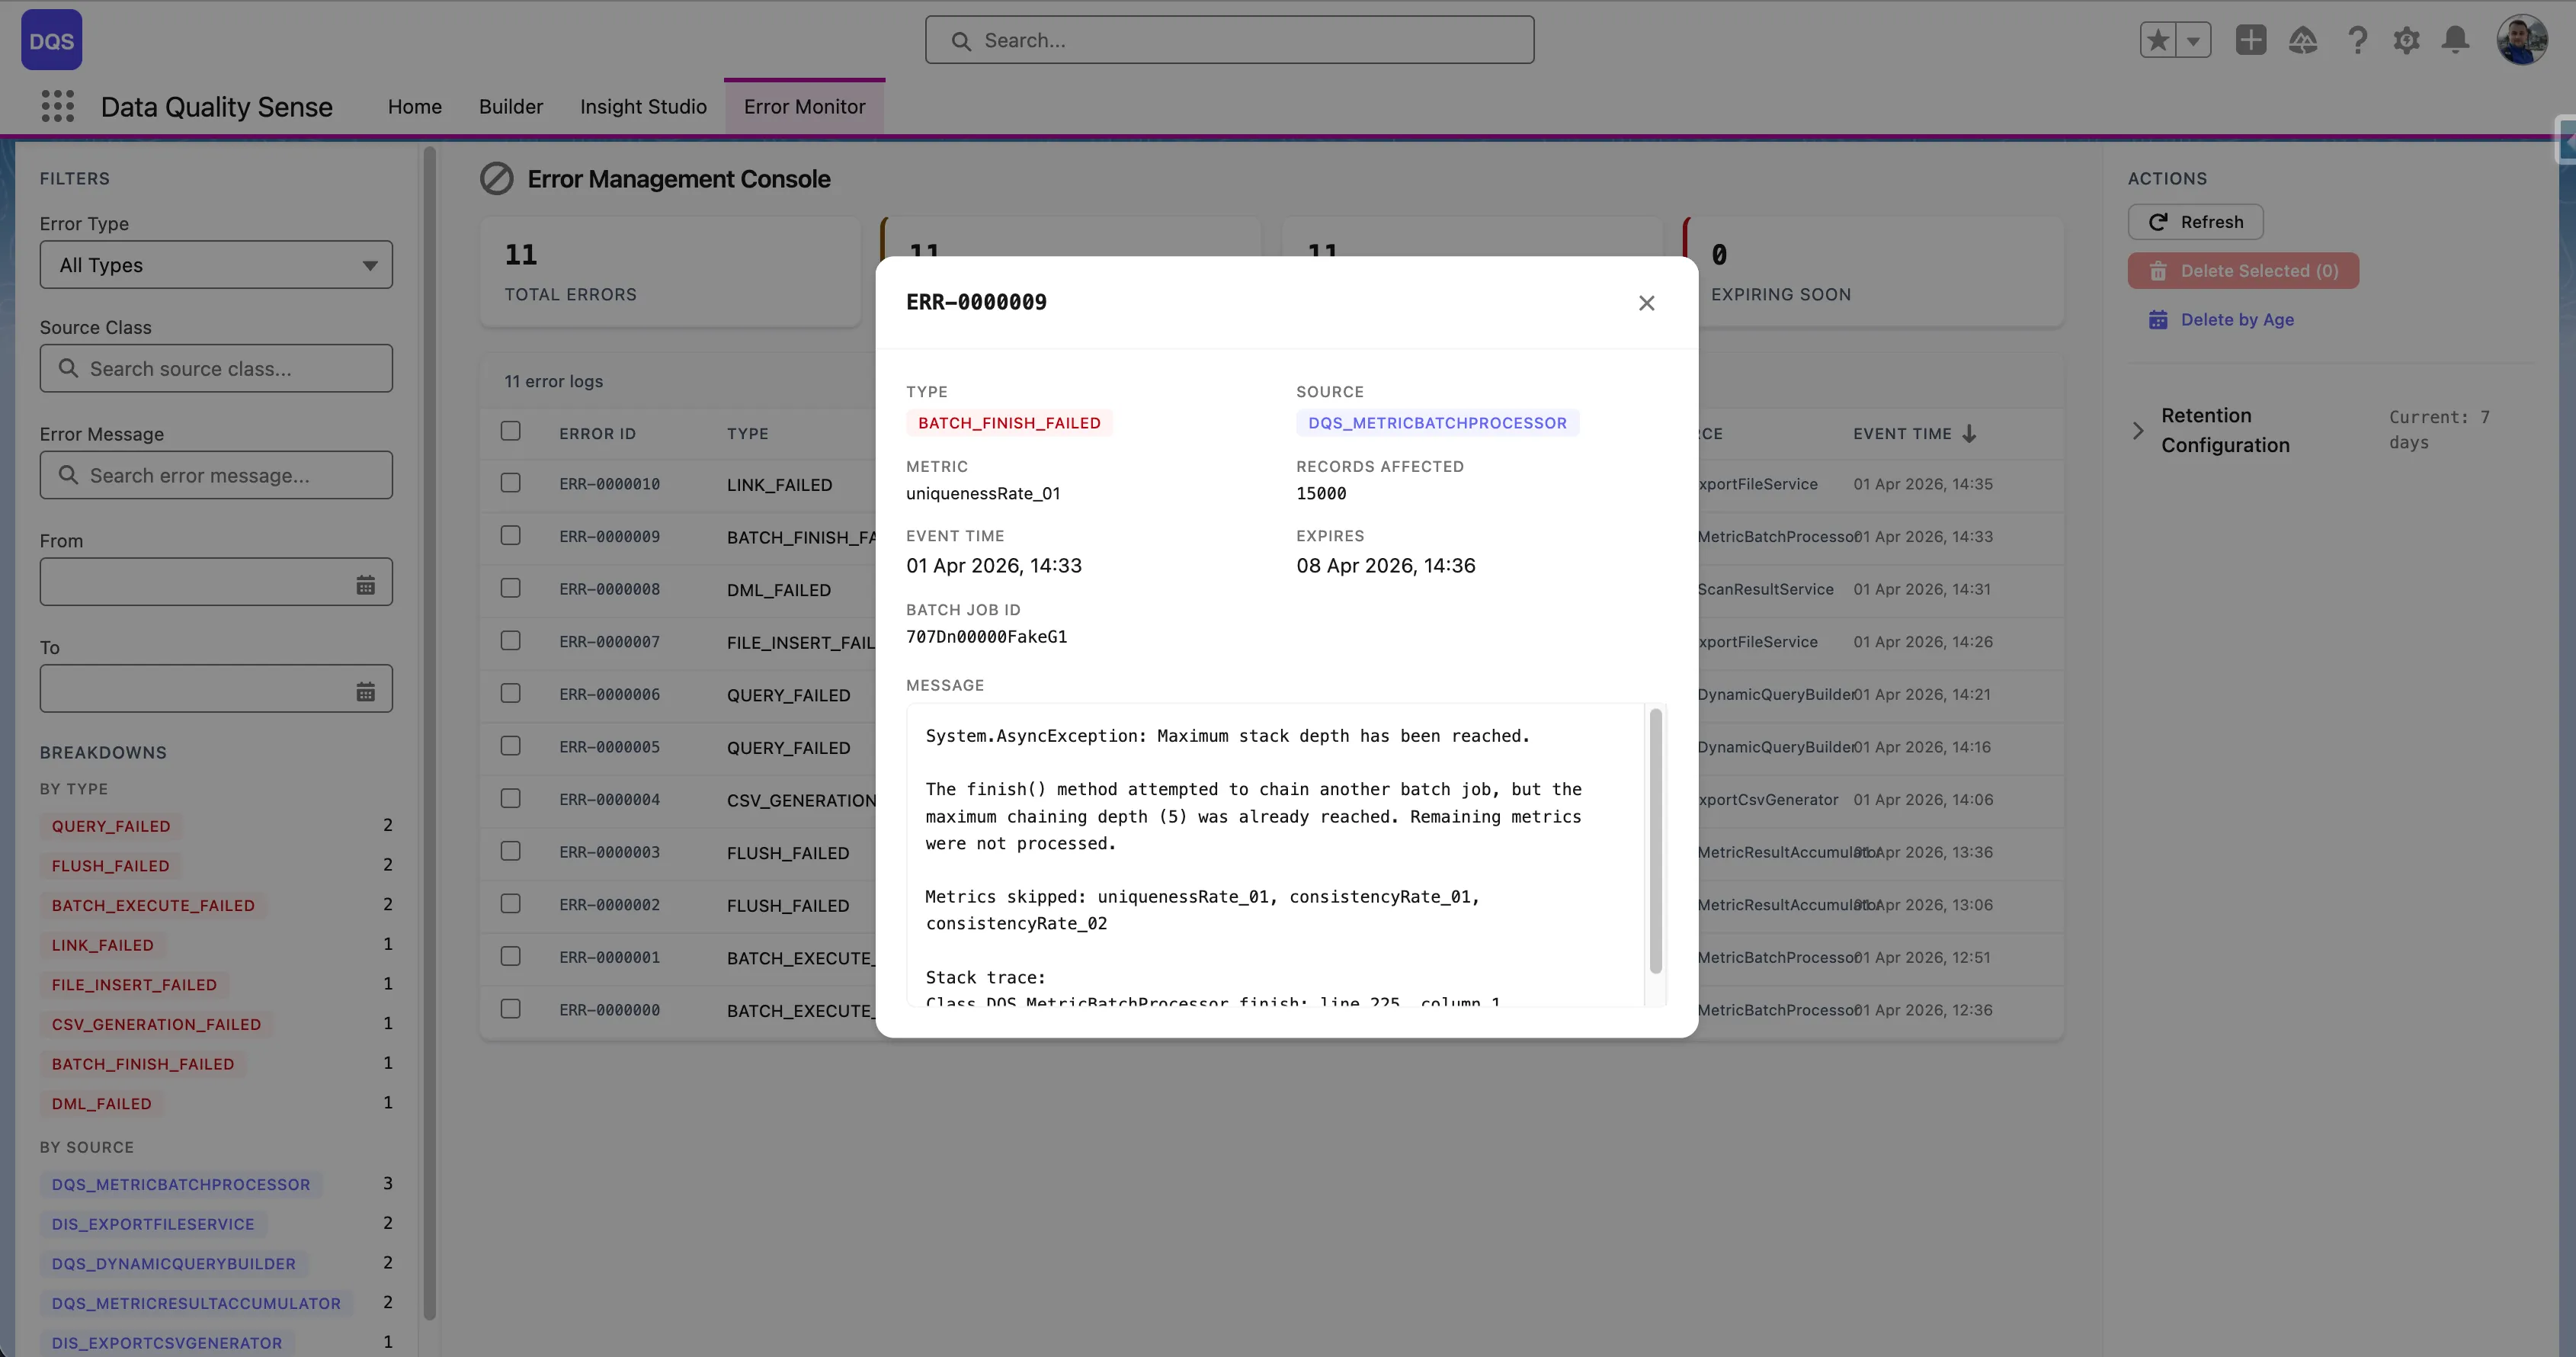
Section titled “Row Detail Modal”Click any error row to open a detail modal with the full context:
- Error ID and Type (highlighted in red for quick identification)
- Source — the originating Apex class
- uniqueIdentifier_01 — the related record or batch identifier
- Insert Type — whether the operation was an insert, update, or other DML type
- Event Time and First Event Time — timestamps for the error occurrence
- Message — full error message including the Salesforce exception type (e.g.,
System.AsyncException,System.DmlException) - Stack Trace — complete Apex stack trace for debugging
Error Sources
Section titled “Error Sources”| Source | Examples |
|---|---|
| Batch Processing | Governor limit exceeded, query timeout |
| Dimension Strategy | Invalid field access, null pointer in strategy logic |
| Platform Events | Event publish failure |
| Scheduling | CRON expression issues, permission errors |
Platform Event Integration
Section titled “Platform Event Integration”DQS uses DQS_Processing_Error__e platform events to surface errors in real time. When an error occurs during batch processing:
- The error is caught and logged
- A platform event is published
- The EMC receives the event and displays it
This replaces silent catch blocks with visible error reporting.
Error Retention
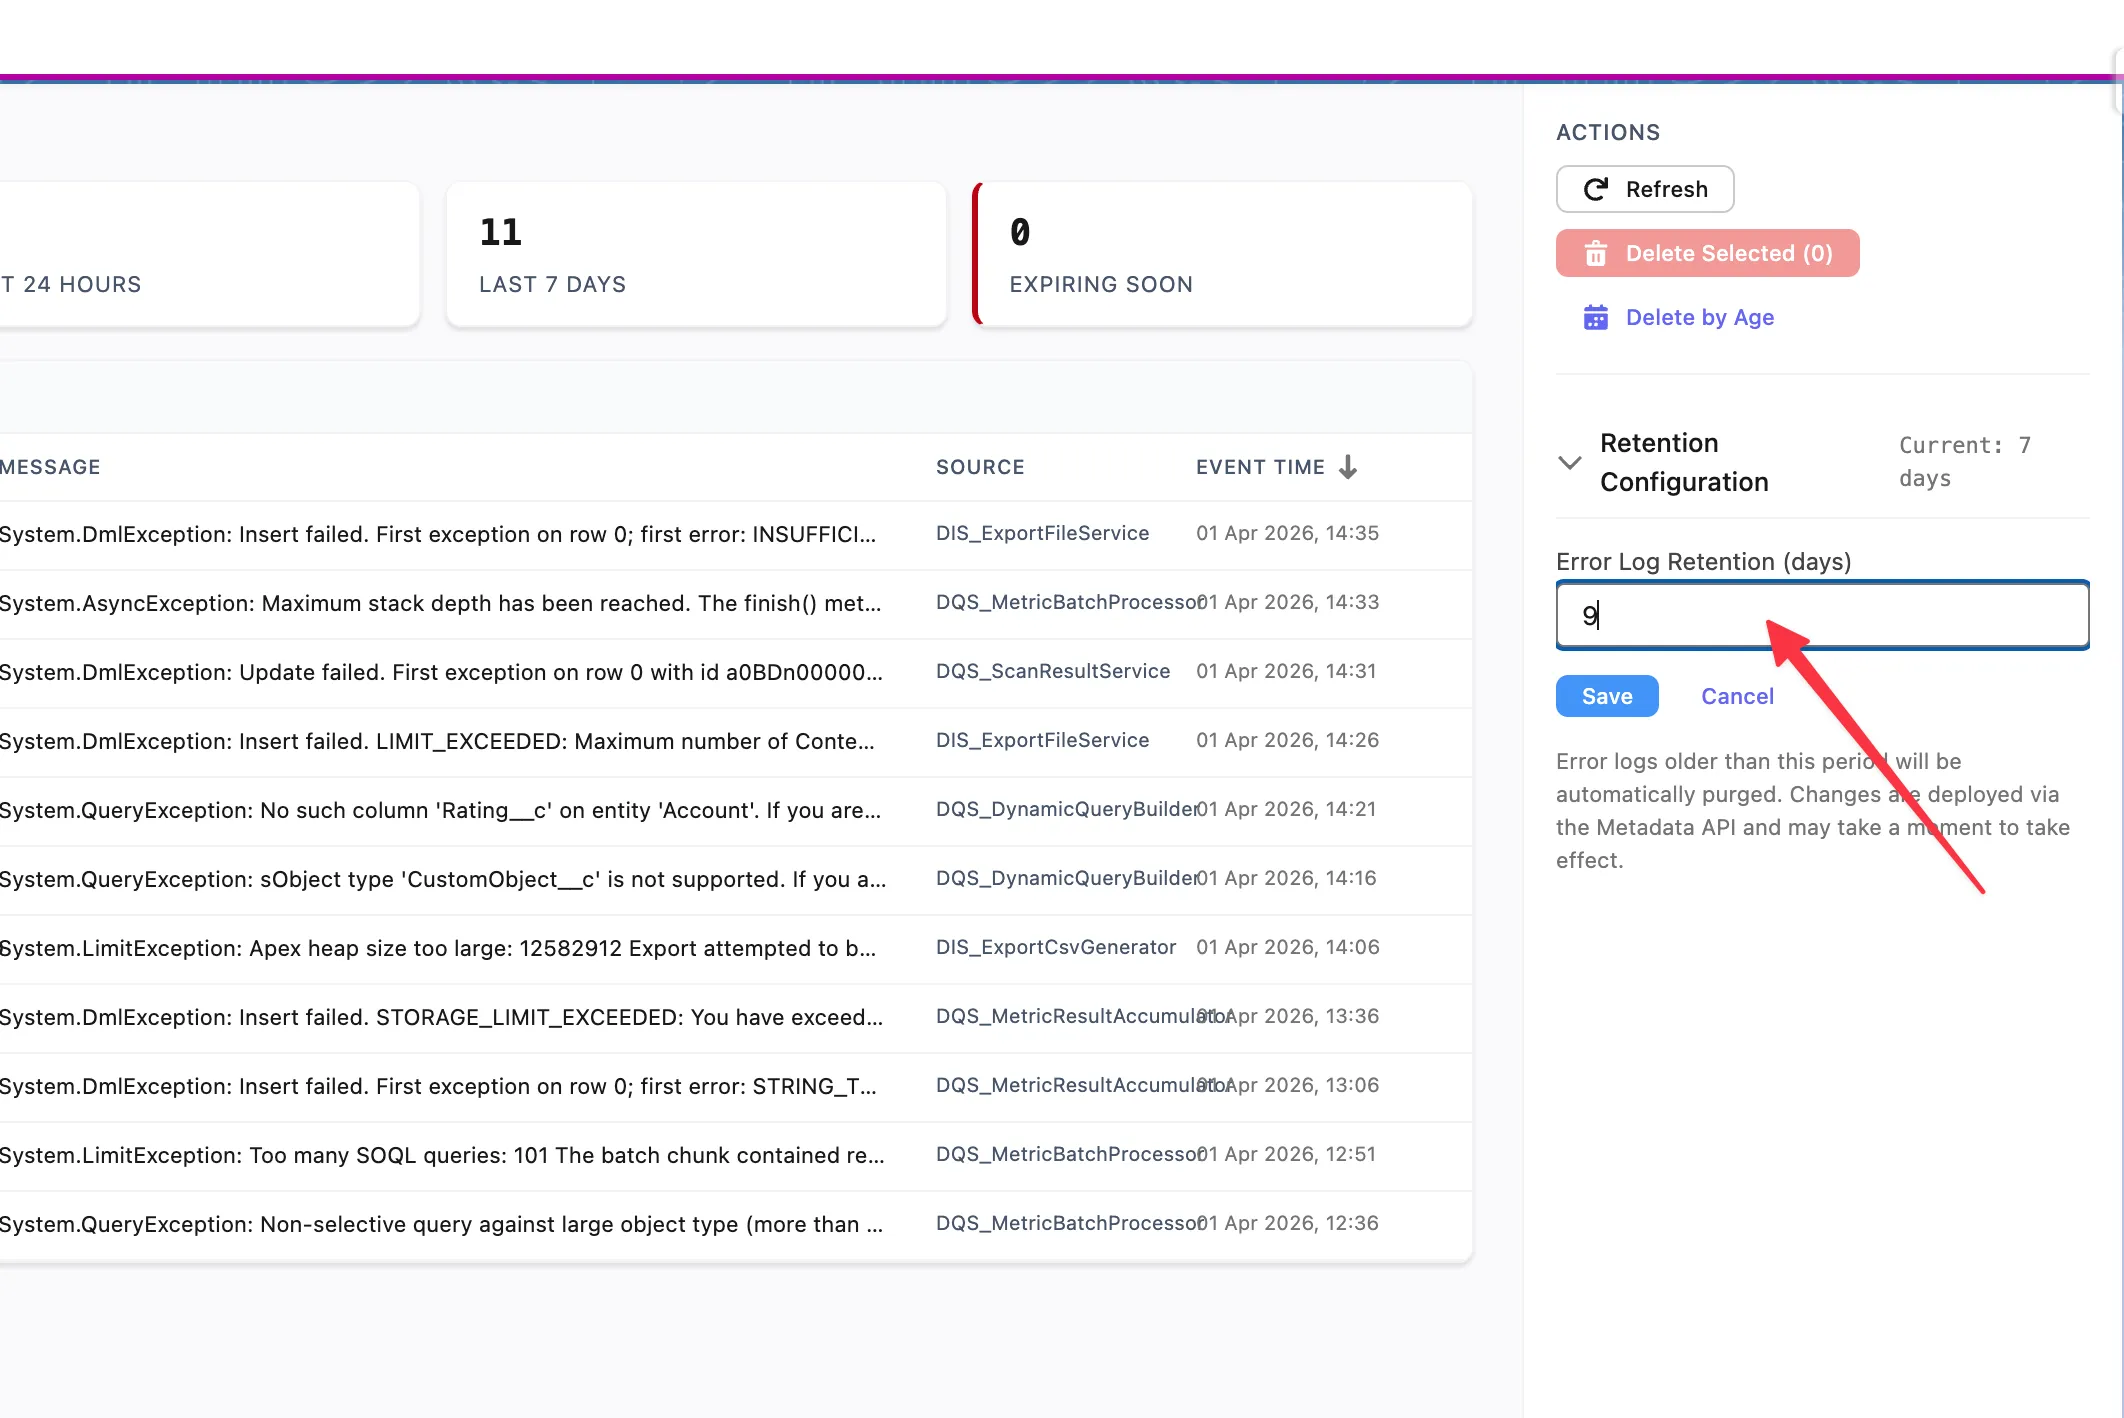
Section titled “Error Retention”Error logs are automatically purged based on the configured retention period. The default retention is 7 days.
To change the retention period, use the Retention Configuration section in the Actions panel on the right side of the console. Enter the desired number of days in the Error Log Retention (days) field and click Save. Error logs older than the specified period will be automatically purged. Changes are deployed via the Metadata API and may take a moment to take effect.
Best Practices
Section titled “Best Practices”- Check the EMC regularly after setting up new scan definitions
- Review errors after changing capability configurations
- Use error patterns to identify systematic issues (e.g., field access permissions)
- Use the Expiring Soon counter to review errors before they are automatically purged
- Export error logs to CSV before they expire if you need to keep them for longer analysis
- Contact support if platform errors persist across multiple scans