Definition
A scan configuration that specifies which object, fields, and quality capabilities to evaluate. Each definition produces a set of results when scanned.
Salesforce-native Data Quality Management
Data Quality Sense (DQS) is a Salesforce-native managed package for monitoring, measuring, and improving the quality of your CRM data. It runs entirely within your Salesforce org — no external integrations, no data leaving your environment.
The standard Salesforce platform doesn’t provide built-in tools for measuring data quality at scale. DQS fills this gap with automated scanning, configurable quality dimensions, and rich analytics.
A multi-step wizard for creating scan configurations. Select objects, pick fields, choose quality dimensions, and set thresholds — all through a guided UI.
Dashboards and analytics for scan results. Scores, trends, field health matrices, scan comparison, CSV exports, and AI-powered recommendations.
Automated batch scanning with flexible scheduling, data retention policies, error management, and platform event notifications.
DQS evaluates data across 6 quality dimensions:
| Dimension | What It Measures |
|---|---|
| Completeness | Are fields populated? |
| Validity | Do values match expected formats? |
| Uniqueness | Are there duplicate values? |
| Timeliness | Is data up to date? |
| Consistency | Are related fields logically consistent? |
| PII Detection | Is personal data properly handled? |
Each dimension can be configured globally or overridden per field, with configurable thresholds and scoring.
dataqualitysens namespaceGet the installation link
Contact us at dataqualitysense.com to receive the managed package installation URL for your org.
Choose installation scope
Select who should have access:
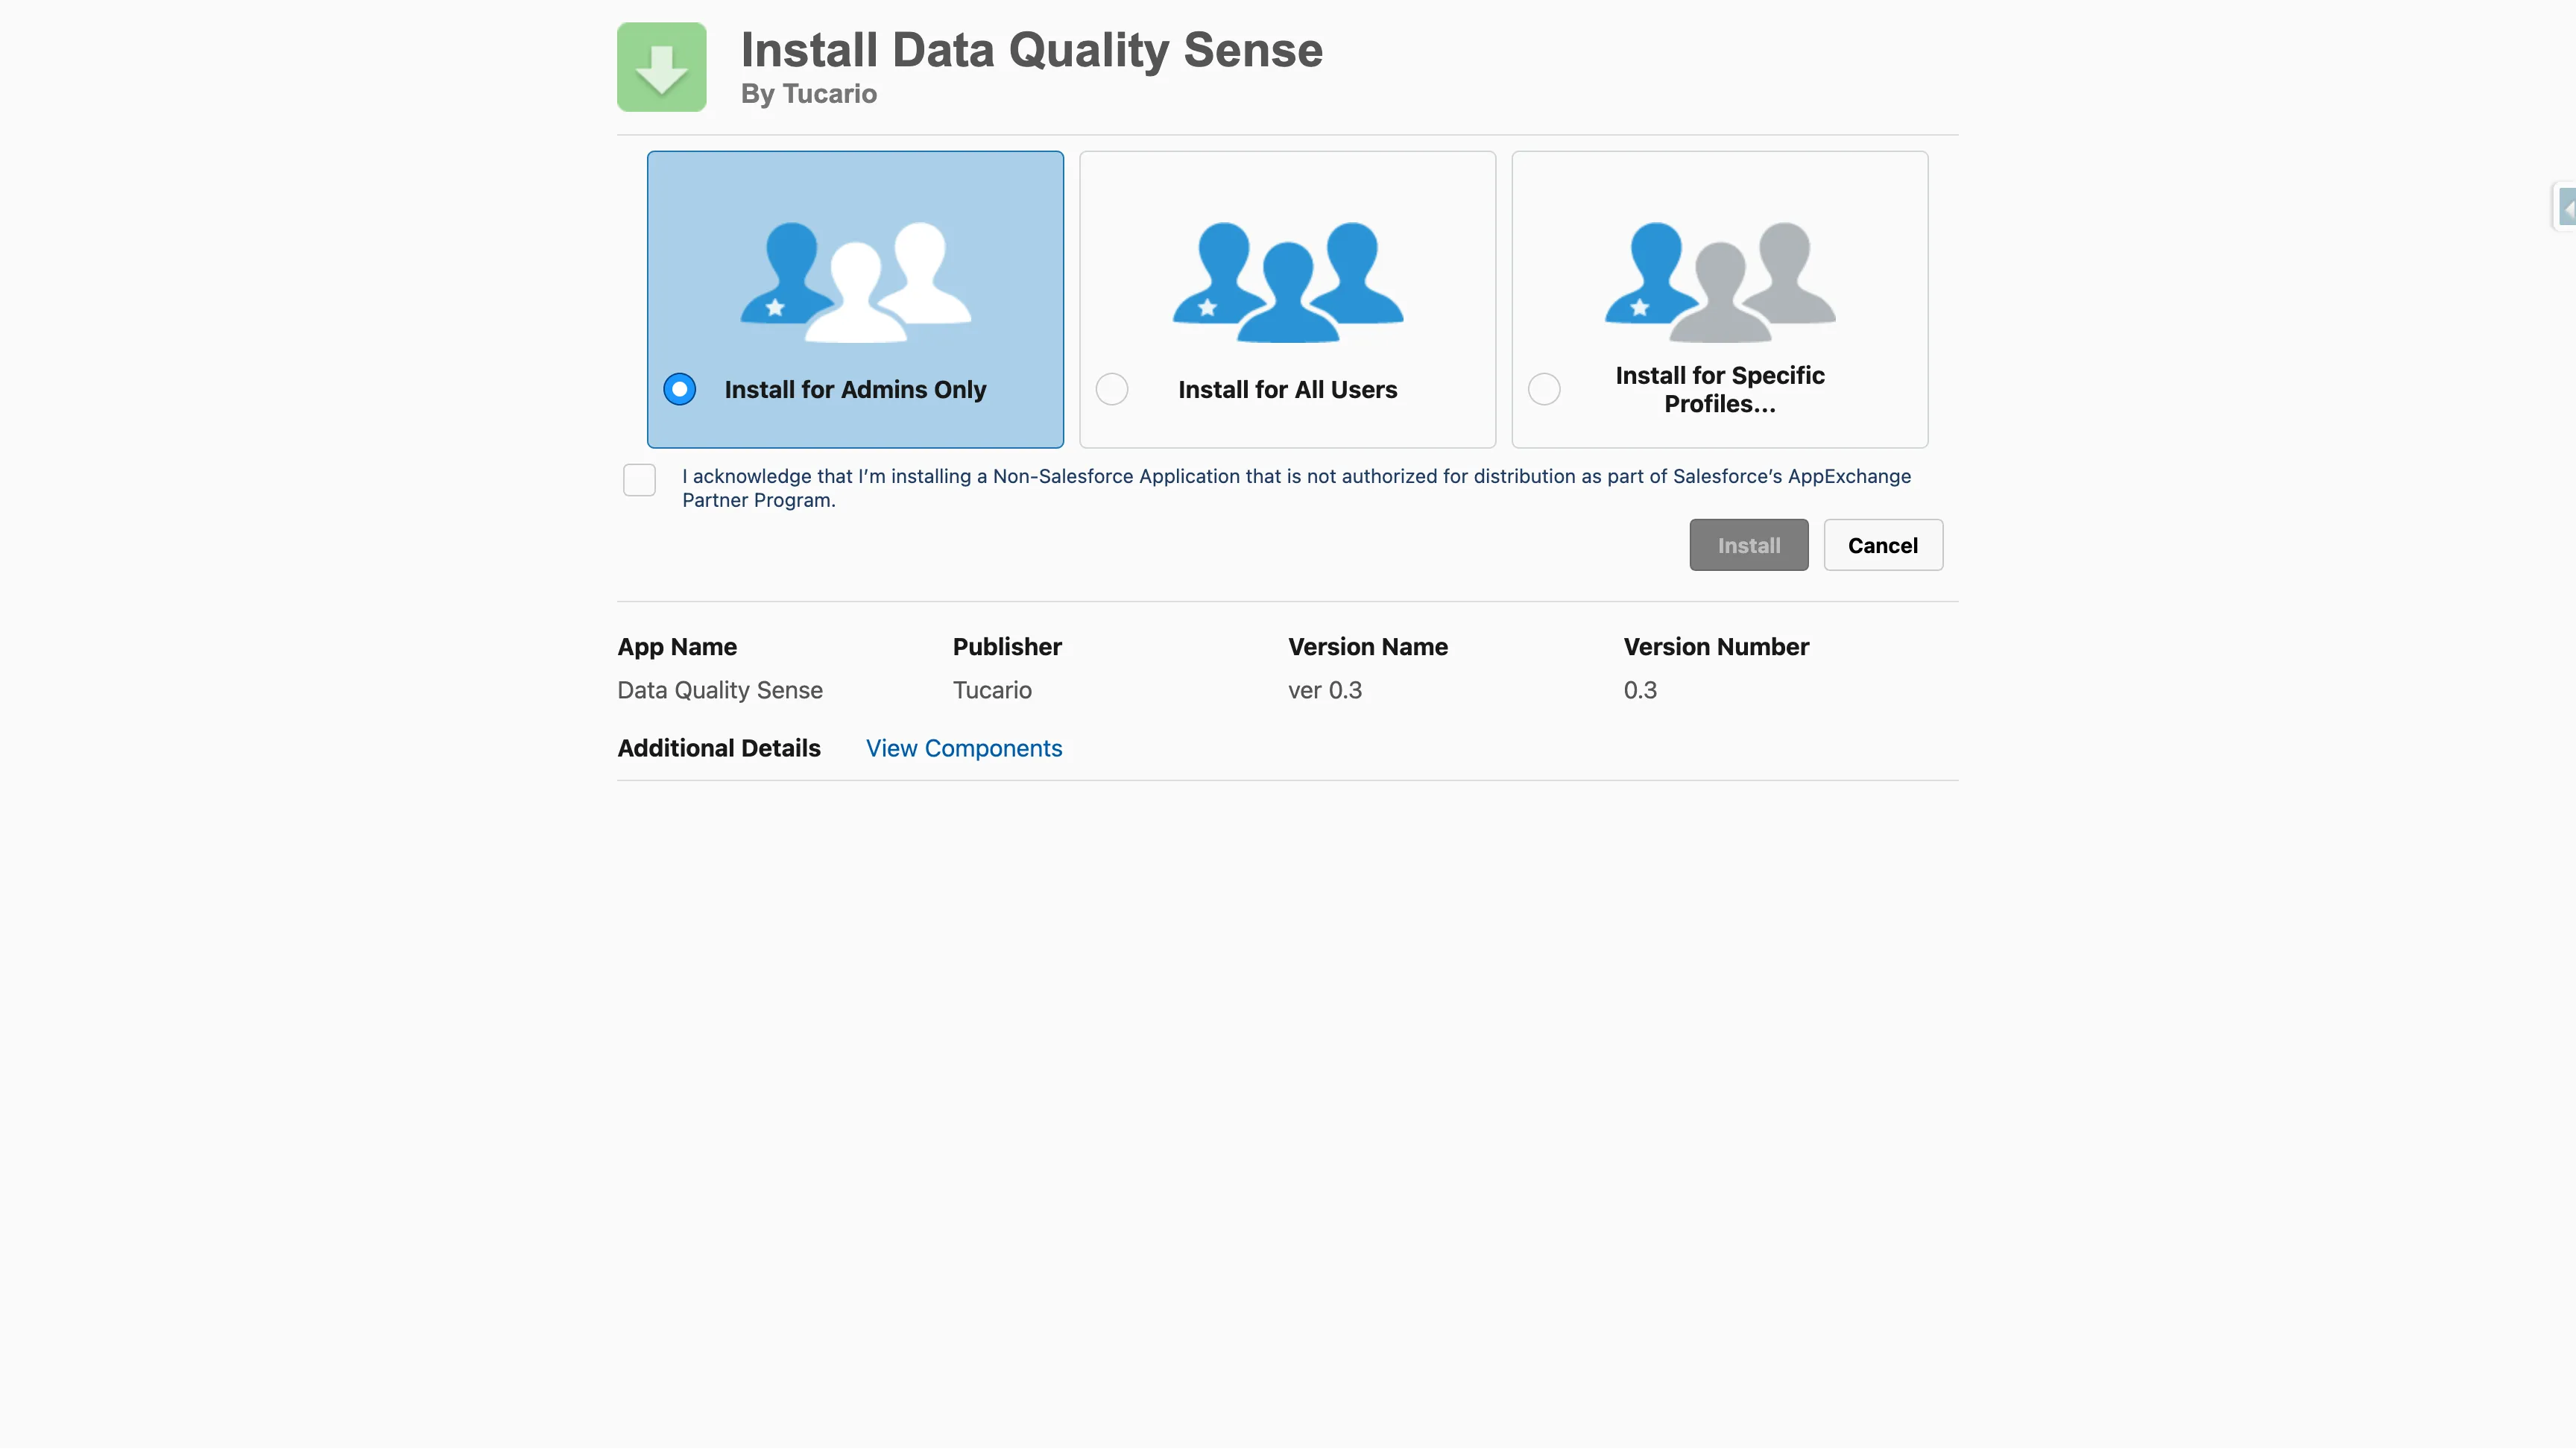
Approve third-party access
The package does not require any external callouts. All processing happens within your Salesforce org.
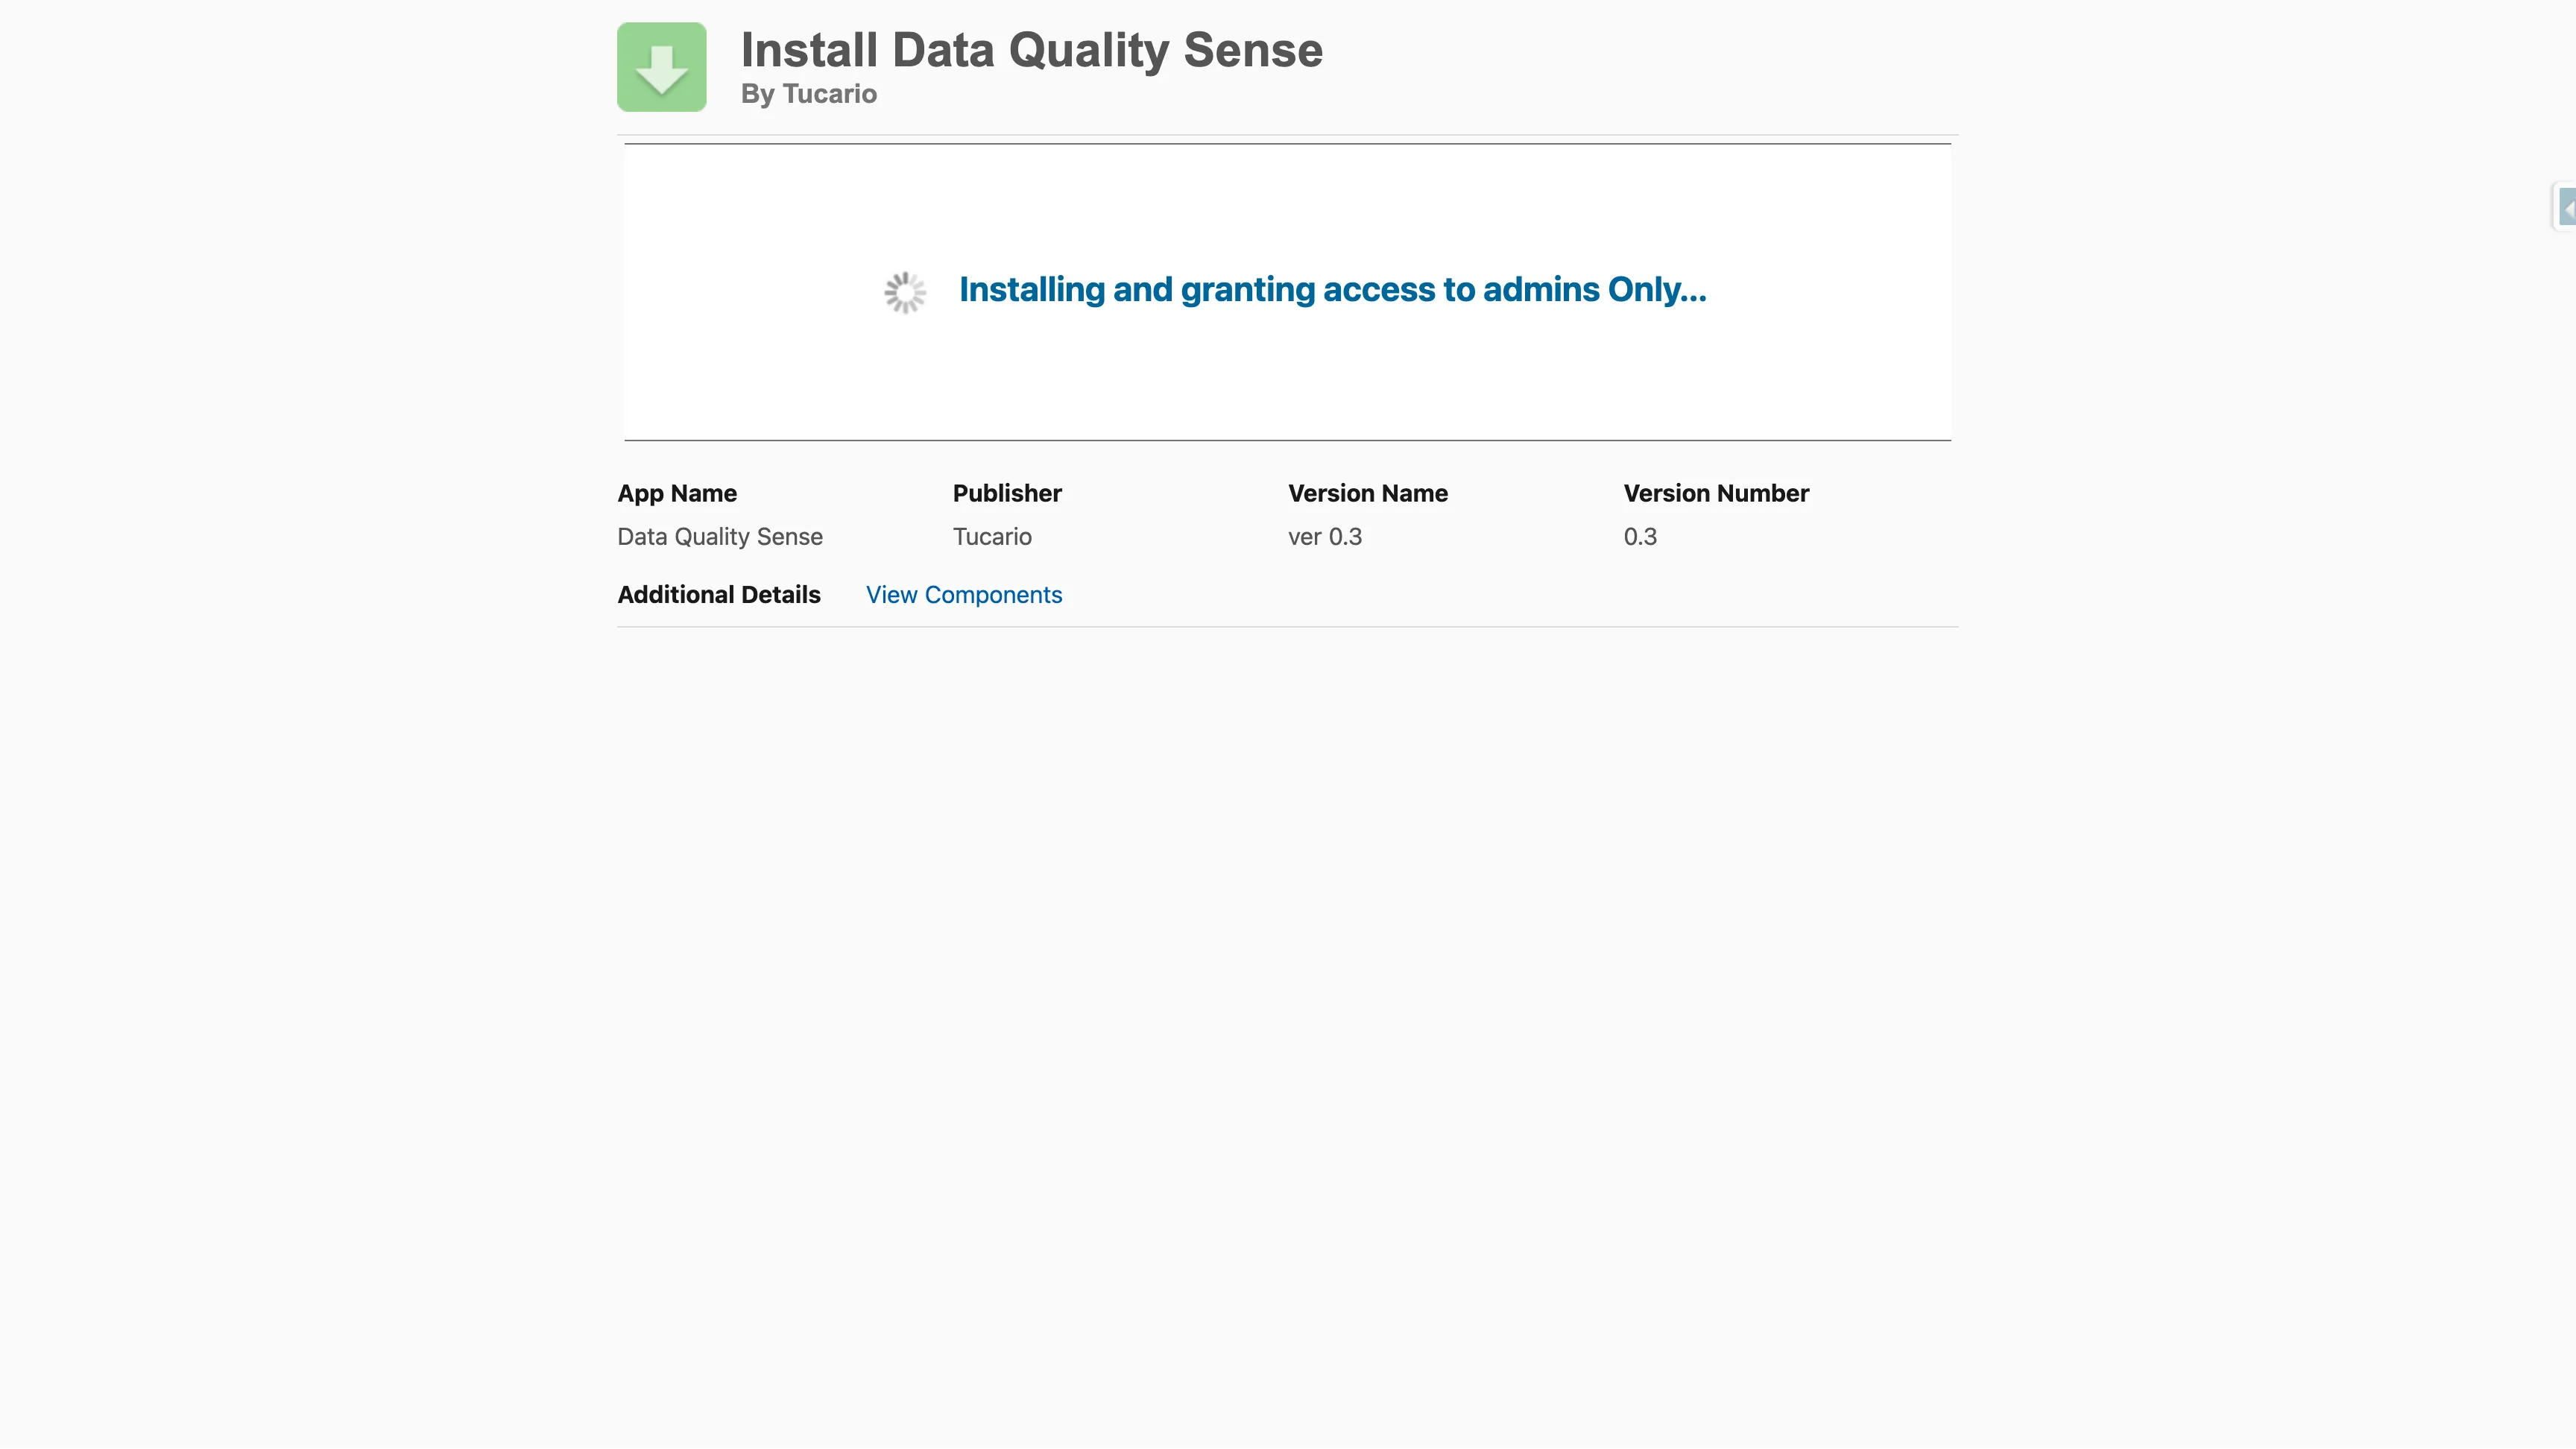
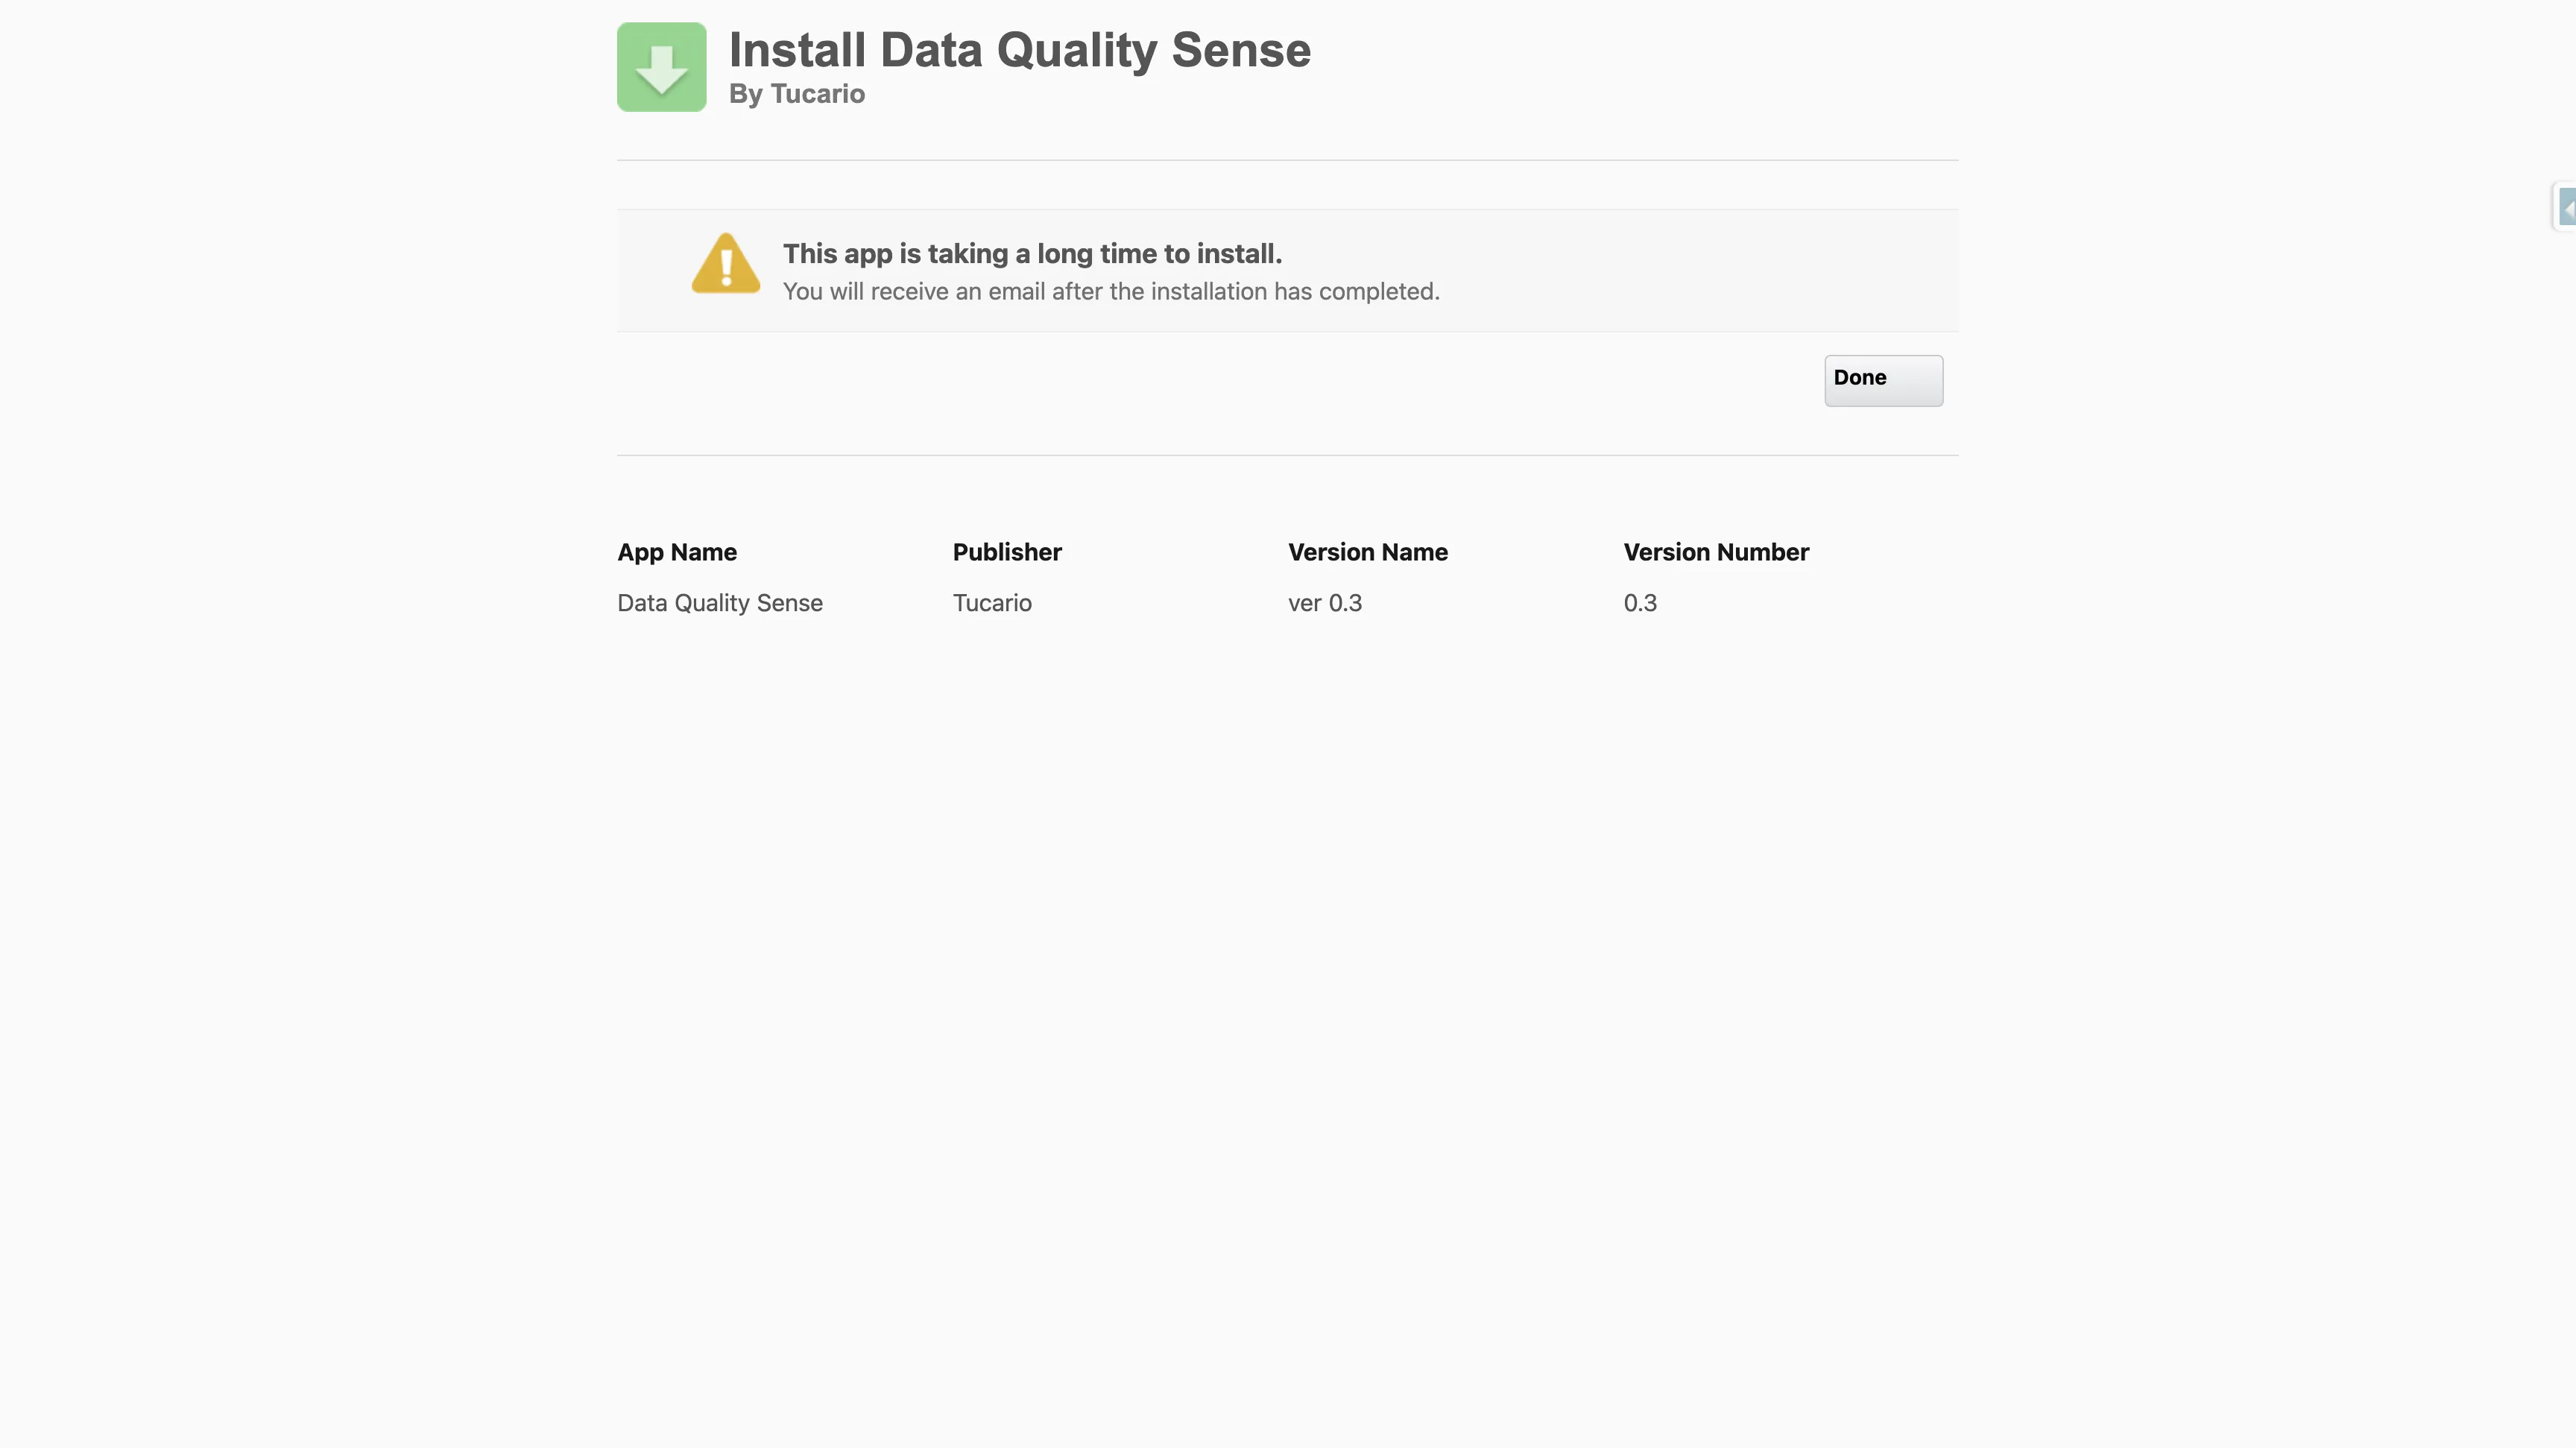
Wait for installation to complete
The installer will show progress. For larger orgs, installation may take a few minutes — you will receive an email once it completes.
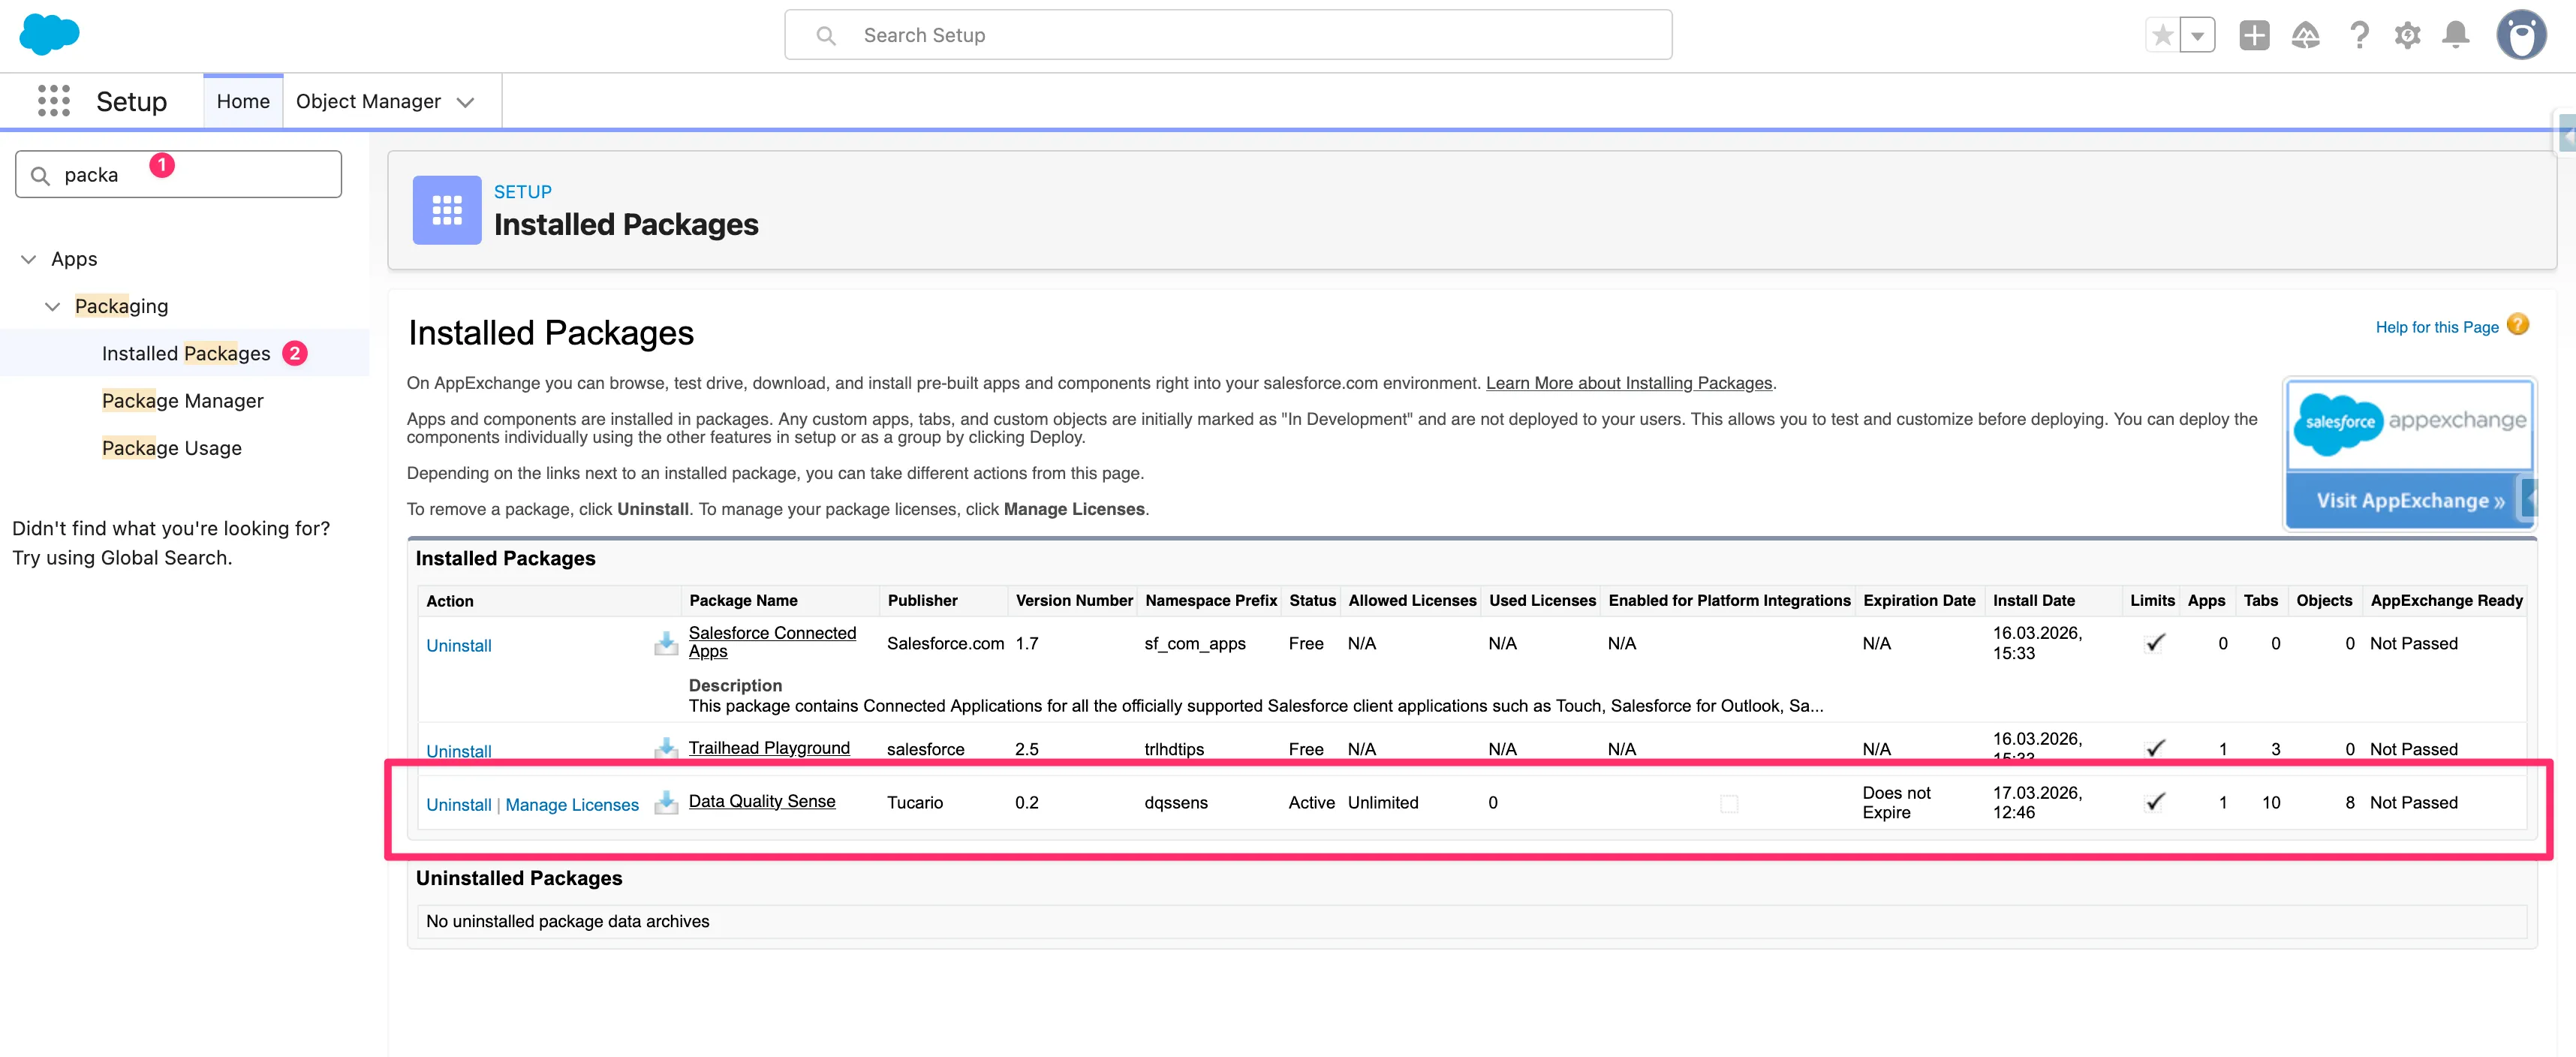
Verify installation
Navigate to Setup → Installed Packages and confirm Data Quality Sense appears with namespace dataqualitysens.
After installation, Data Quality Sense is not yet active. When you open the app for the first time, you will see a lock screen indicating that activation is required.
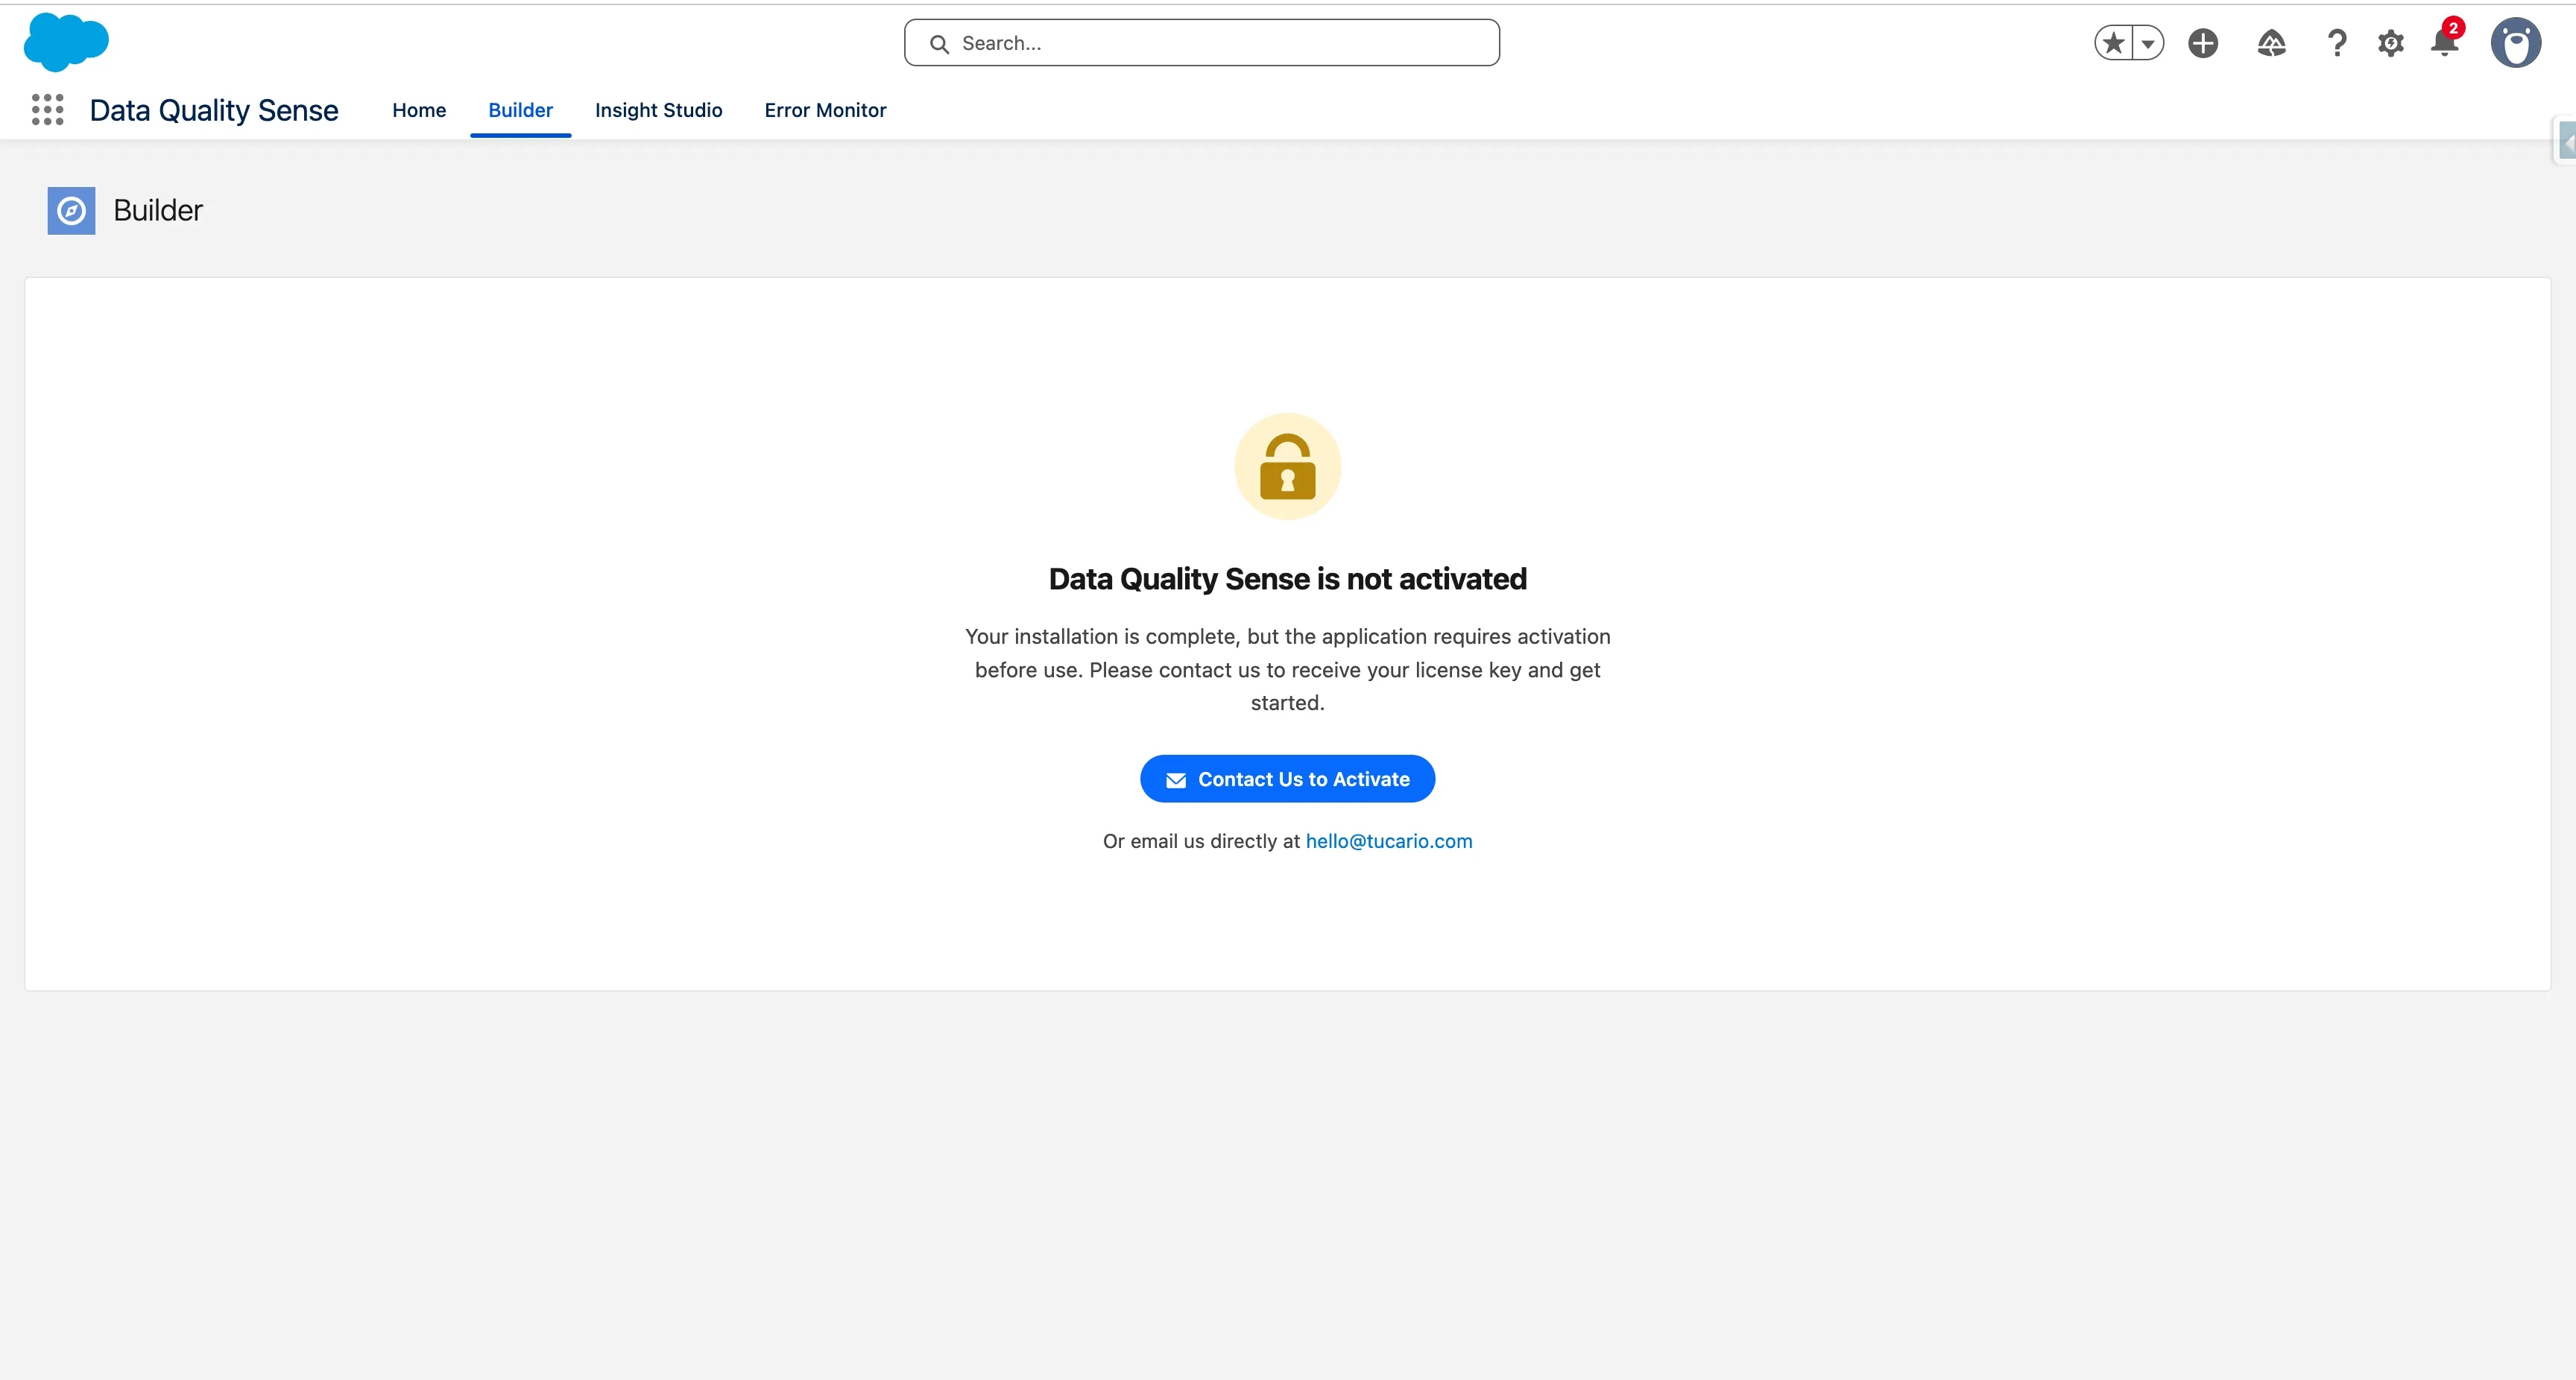
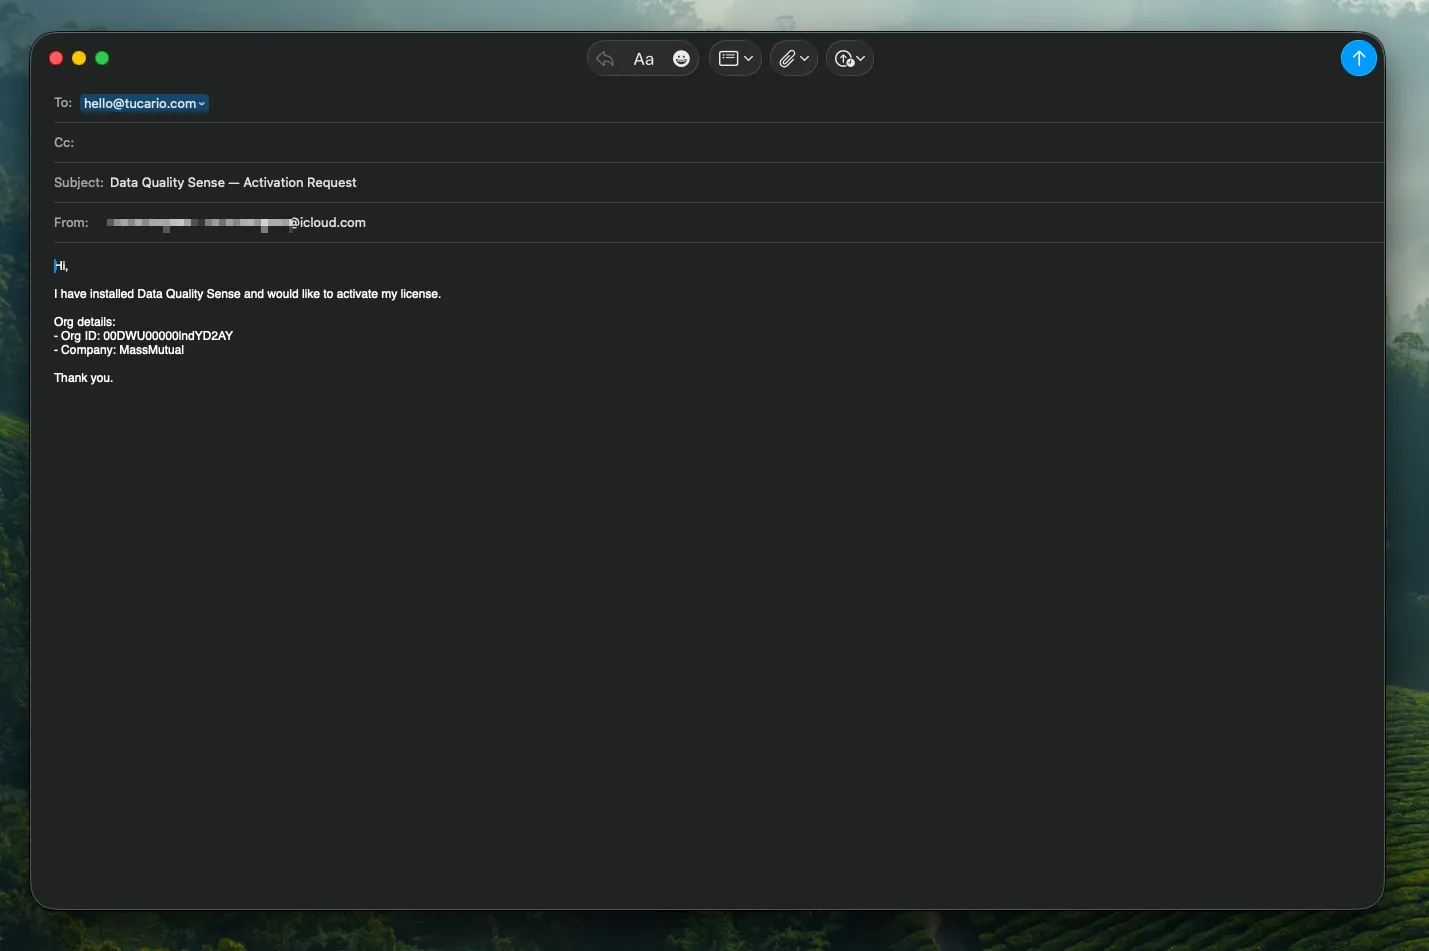
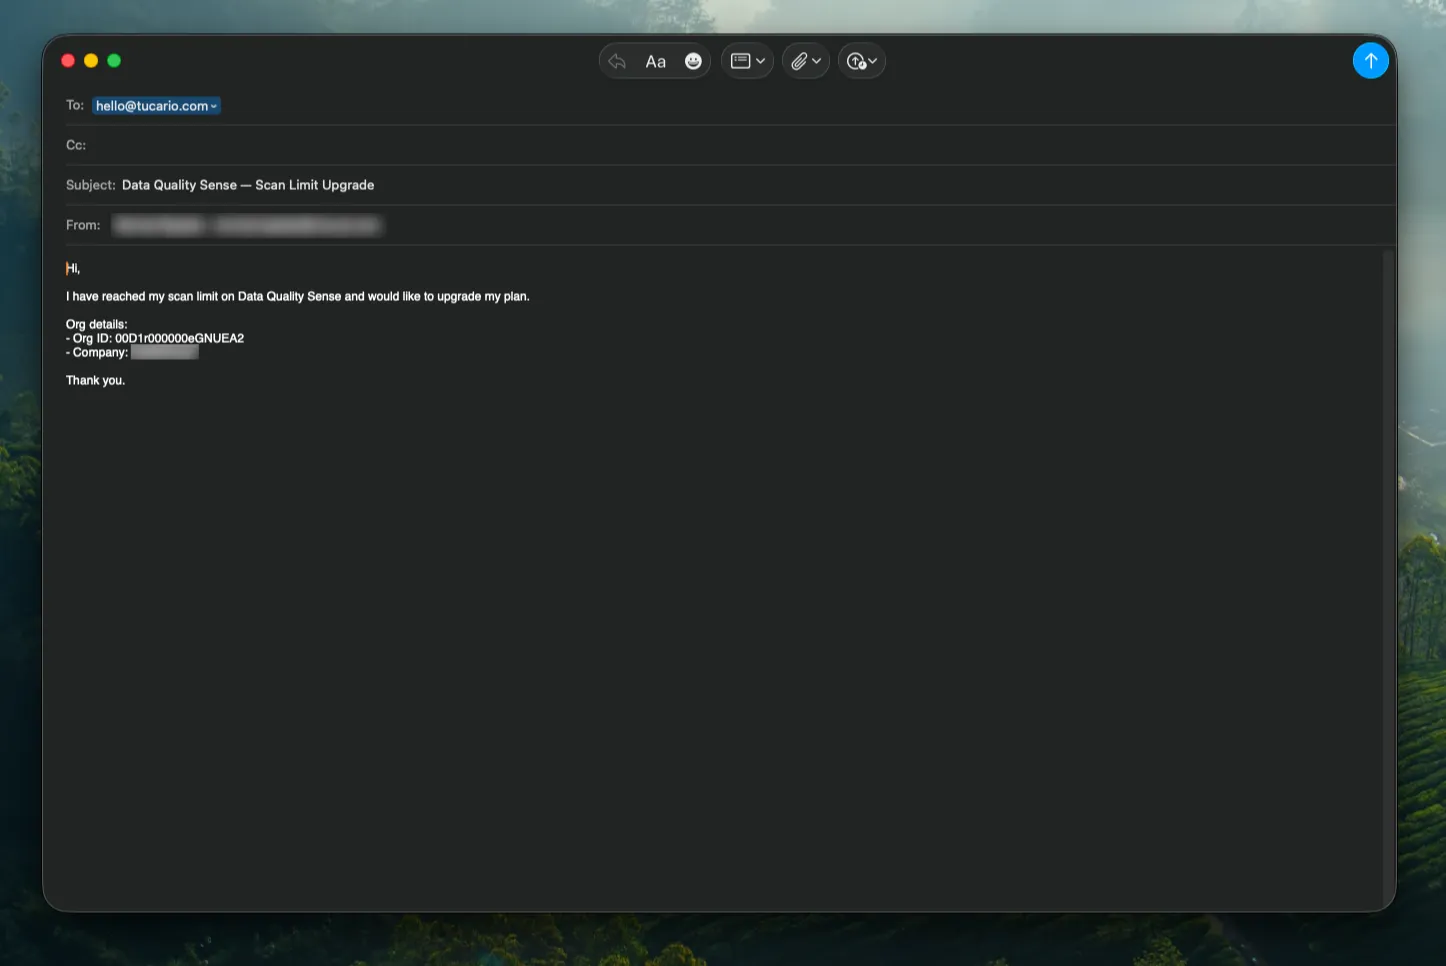
Click Contact Us to Activate to open a pre-filled email with your Org ID and details. You can also email us directly at hello@tucario.com.
We will enable the app remotely — no additional installation steps are needed on your side. Once activated, the lock screen disappears and the app is ready to use with 20 scans included.
The package installs all required components — custom objects, Lightning components, and permission sets. No additional configuration of these components is needed.
To upgrade to a newer version, use the same installation link — Salesforce will detect the existing package and offer an upgrade path. The installer shows your currently installed version and the new version available. Choose the same installation scope as before (or change it if needed) and click Upgrade.
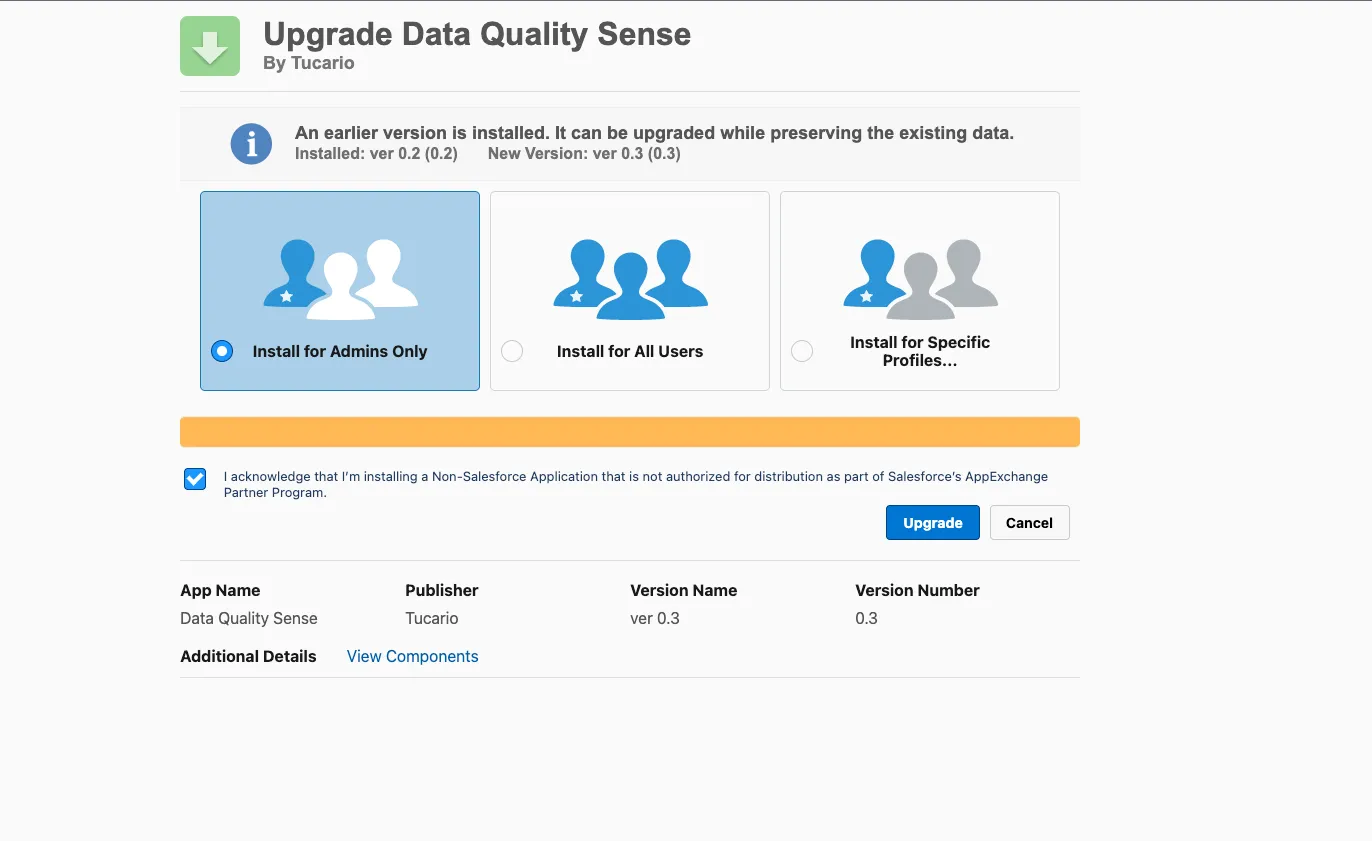
Your scan definitions, results, and configuration are preserved during upgrades — no data is lost.
Data Quality Sense ships with permission sets that control access to different parts of the application.
Full access to all features:
Read-only access to results:
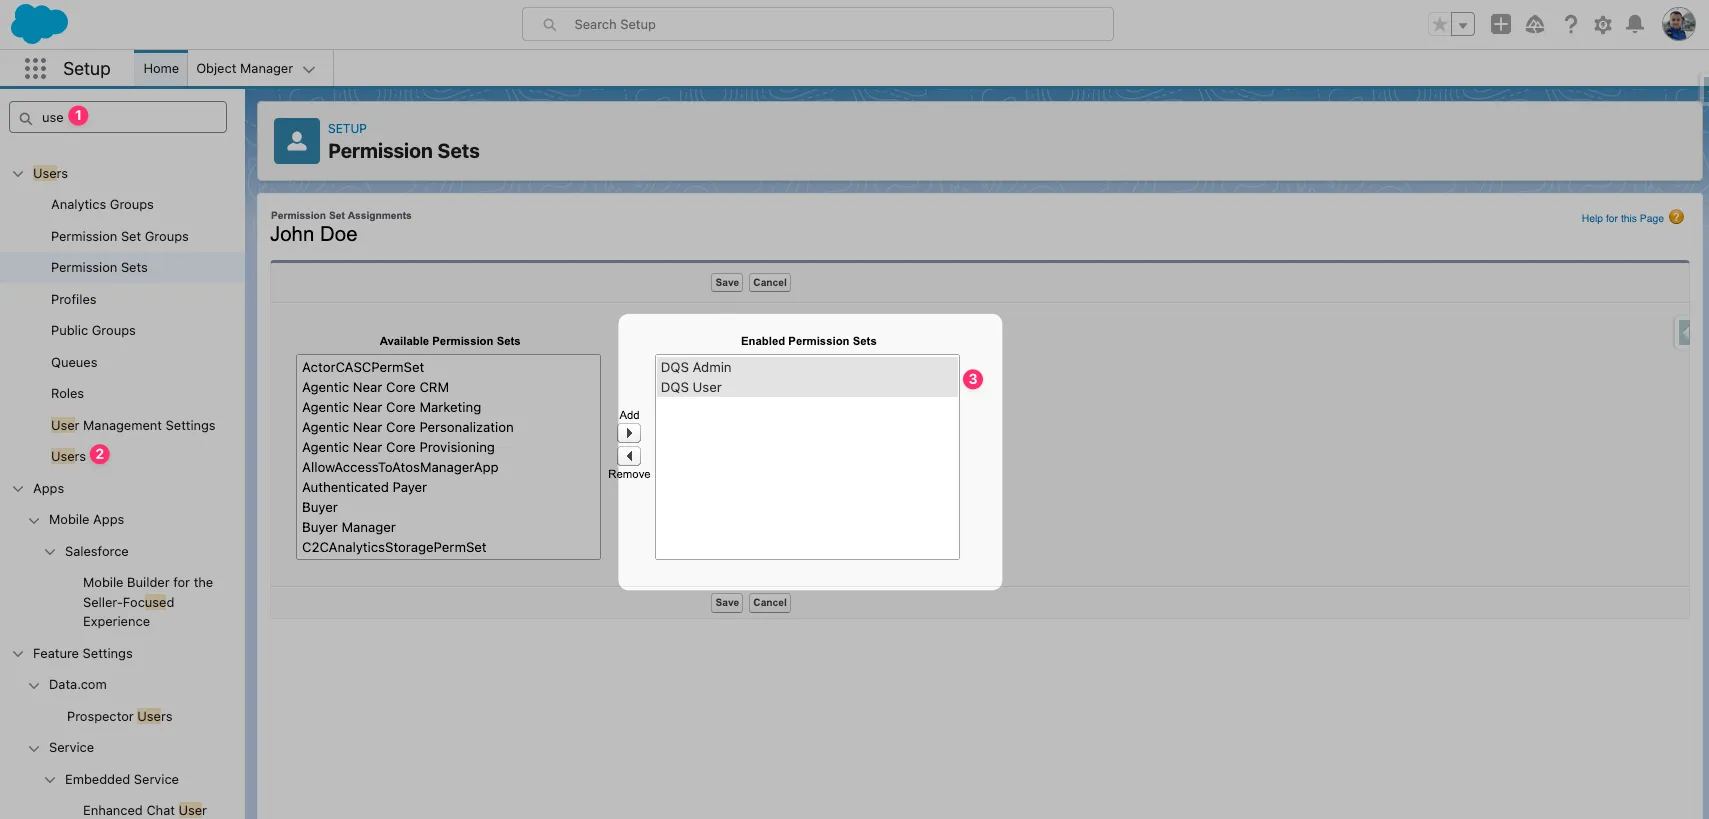
The permission sets automatically grant access to DQS custom objects:
| Object | Admin | User |
|---|---|---|
DQS_Definition__c | Read/Create/Edit/Delete | Read |
DQS_Definition_Detail__c | Read/Create/Edit/Delete | Read |
DQS_Dimension_Result__c | Read | Read |
DQS_Field_Result__c | Read | Read |
DQS_Metric_Result__c | Read | Read |
DQS_Batch_Schedule__c | Read/Create/Edit/Delete | Read |
All fields on DQS objects are visible to both permission sets. Metric results, scores, and configuration fields are read-only for DQS User.
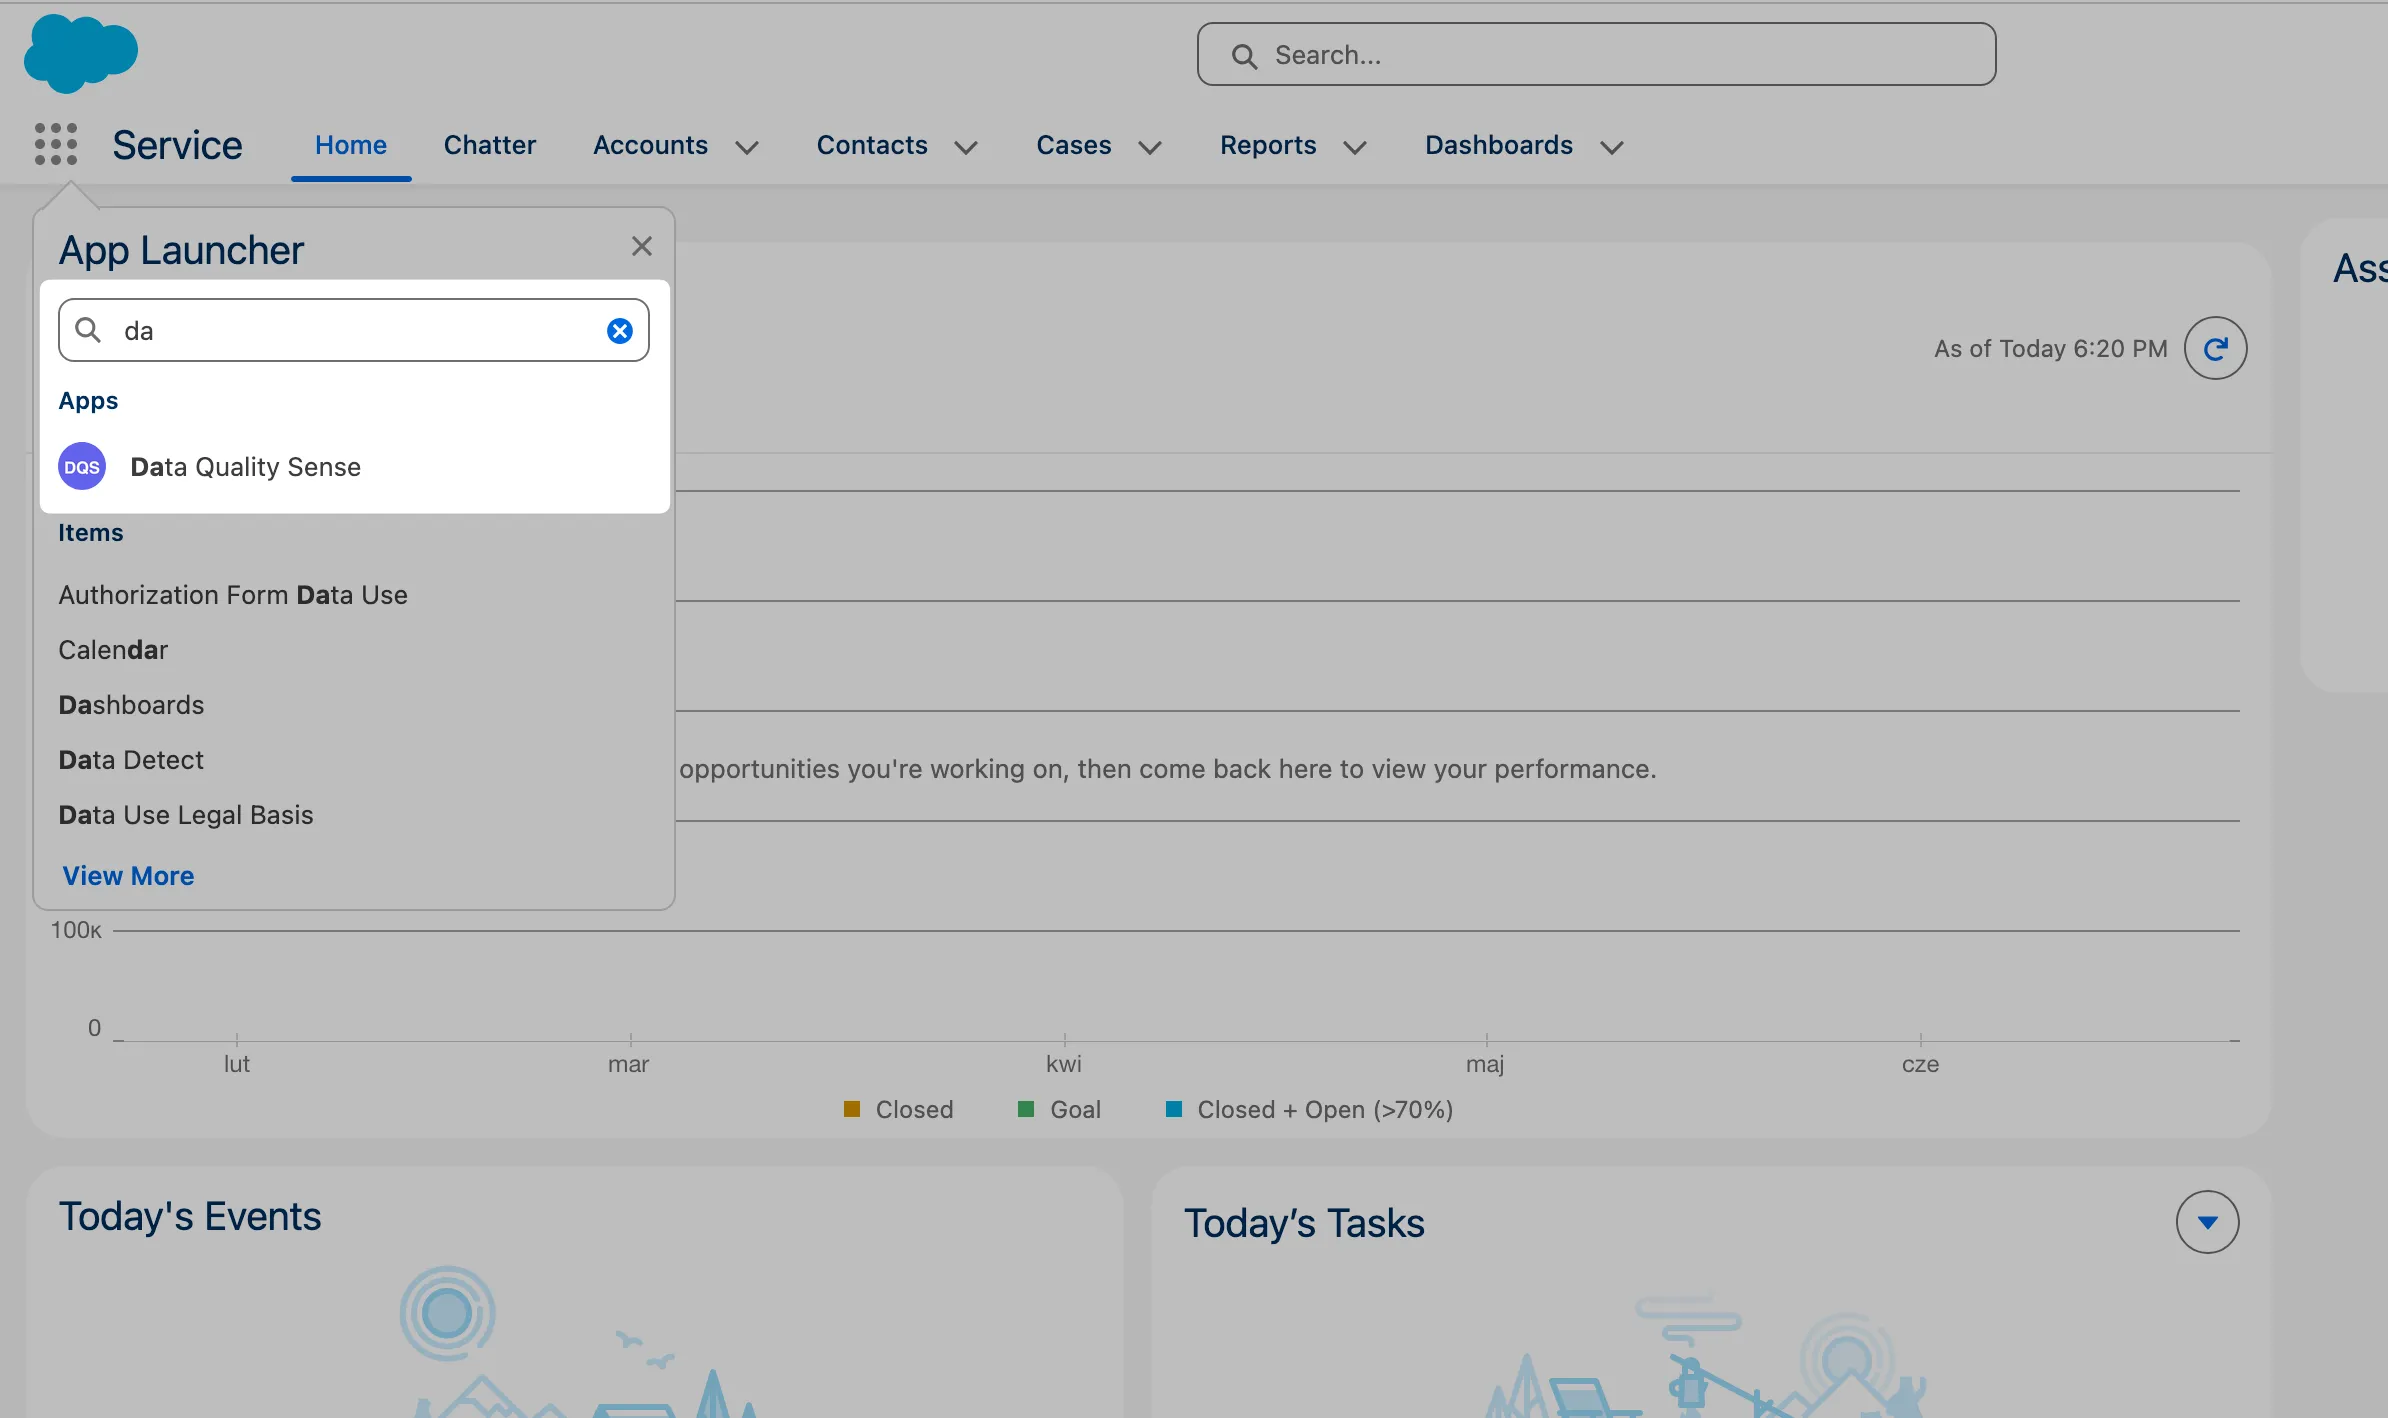
Open DQS Builder
Navigate to the Data Quality Sense app in Salesforce. If permissions are configured correctly, the Builder tab loads automatically.
Create a new definition
Click New Definition. Give it a name (e.g., “Account Quality Check”) and select the target object — for example, Account.
Select fields
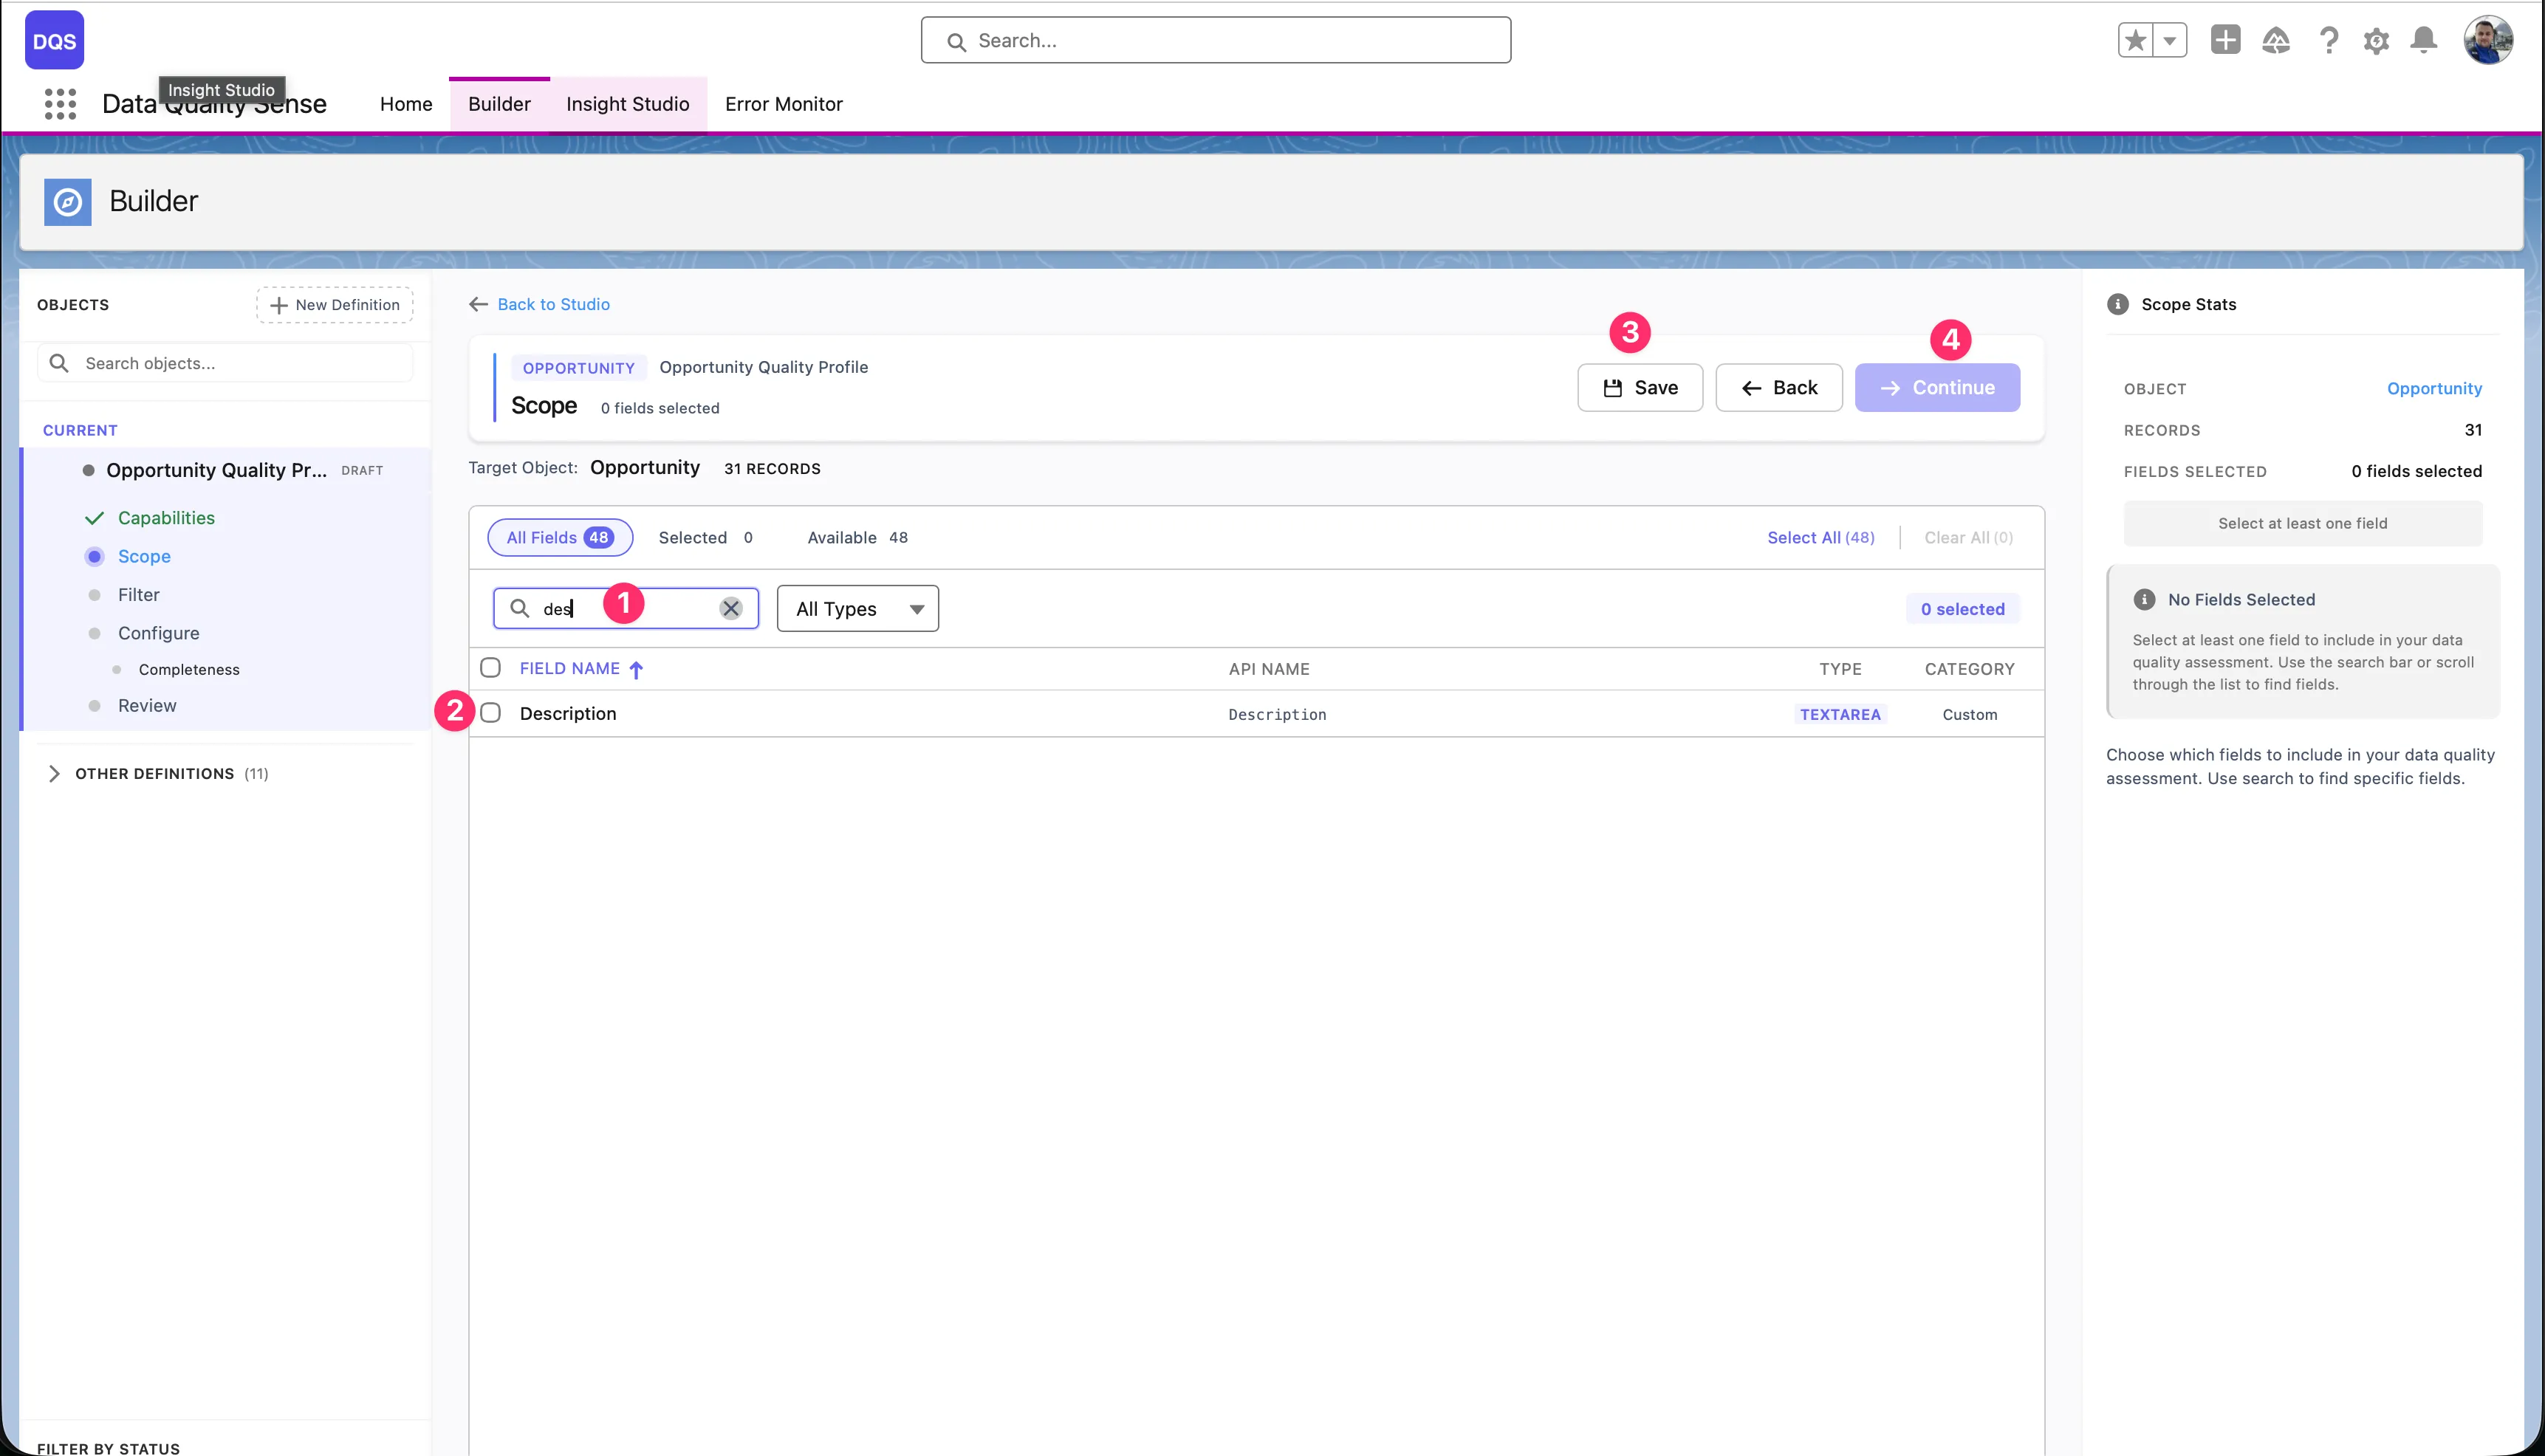
The field picker shows all available fields on the selected object. Pick the fields you want to monitor. You can use the search bar to filter, and sort by field type or label.
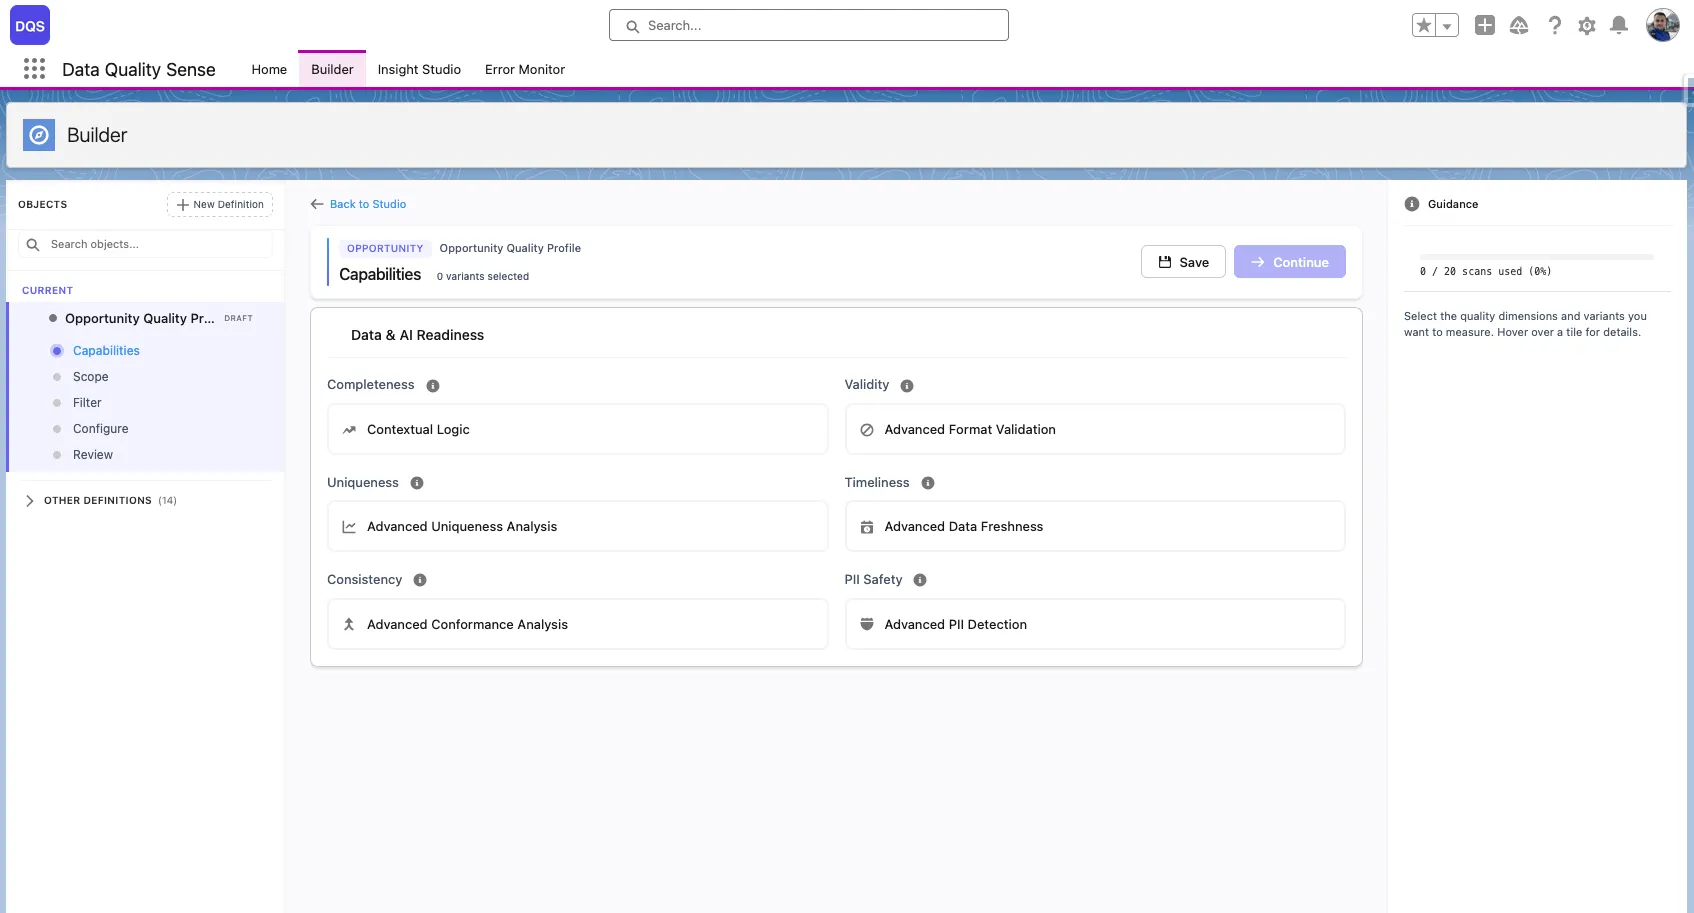
Choose capabilities
Select which quality dimensions to evaluate:
Start with Completeness for the quickest setup.
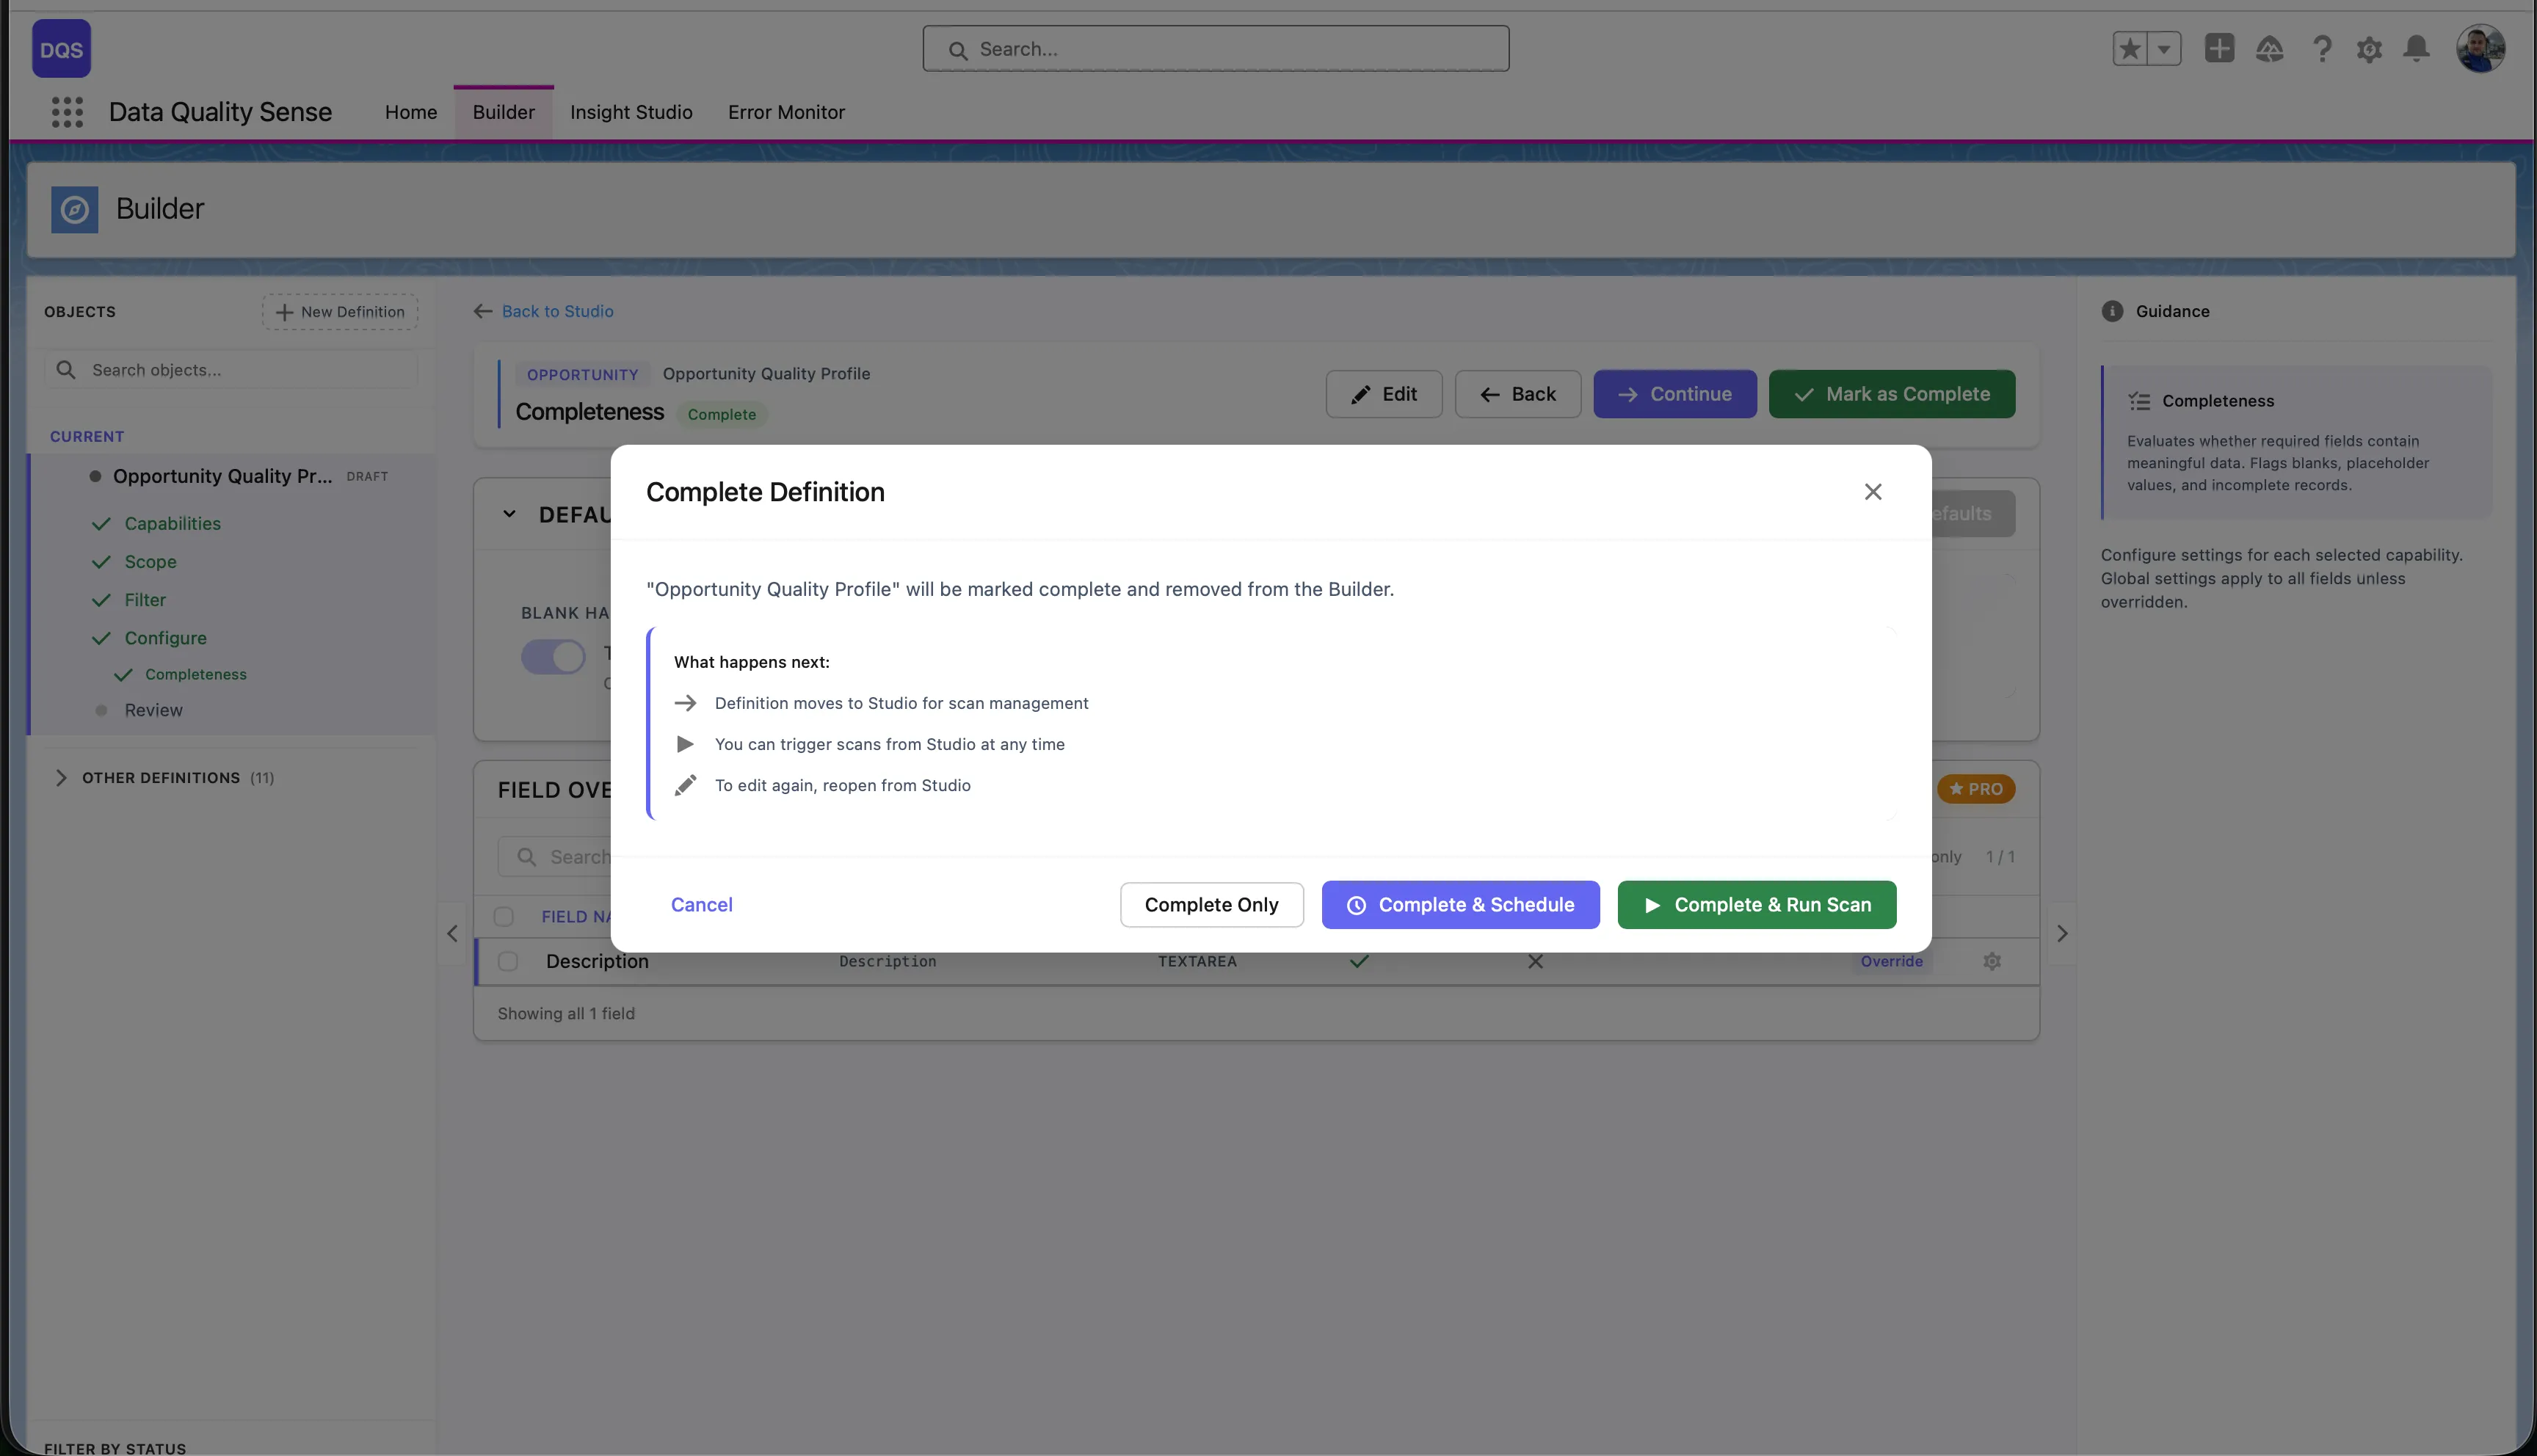
Review and activate
Review your configuration on the summary screen. Click Activate to move the definition from Draft to Active status.
Run the scan
Go to Insight Studio and trigger a scan manually, or set up a schedule.
View results
After the scan completes, Insight Studio shows your data quality scores with drill-down to field-level details.
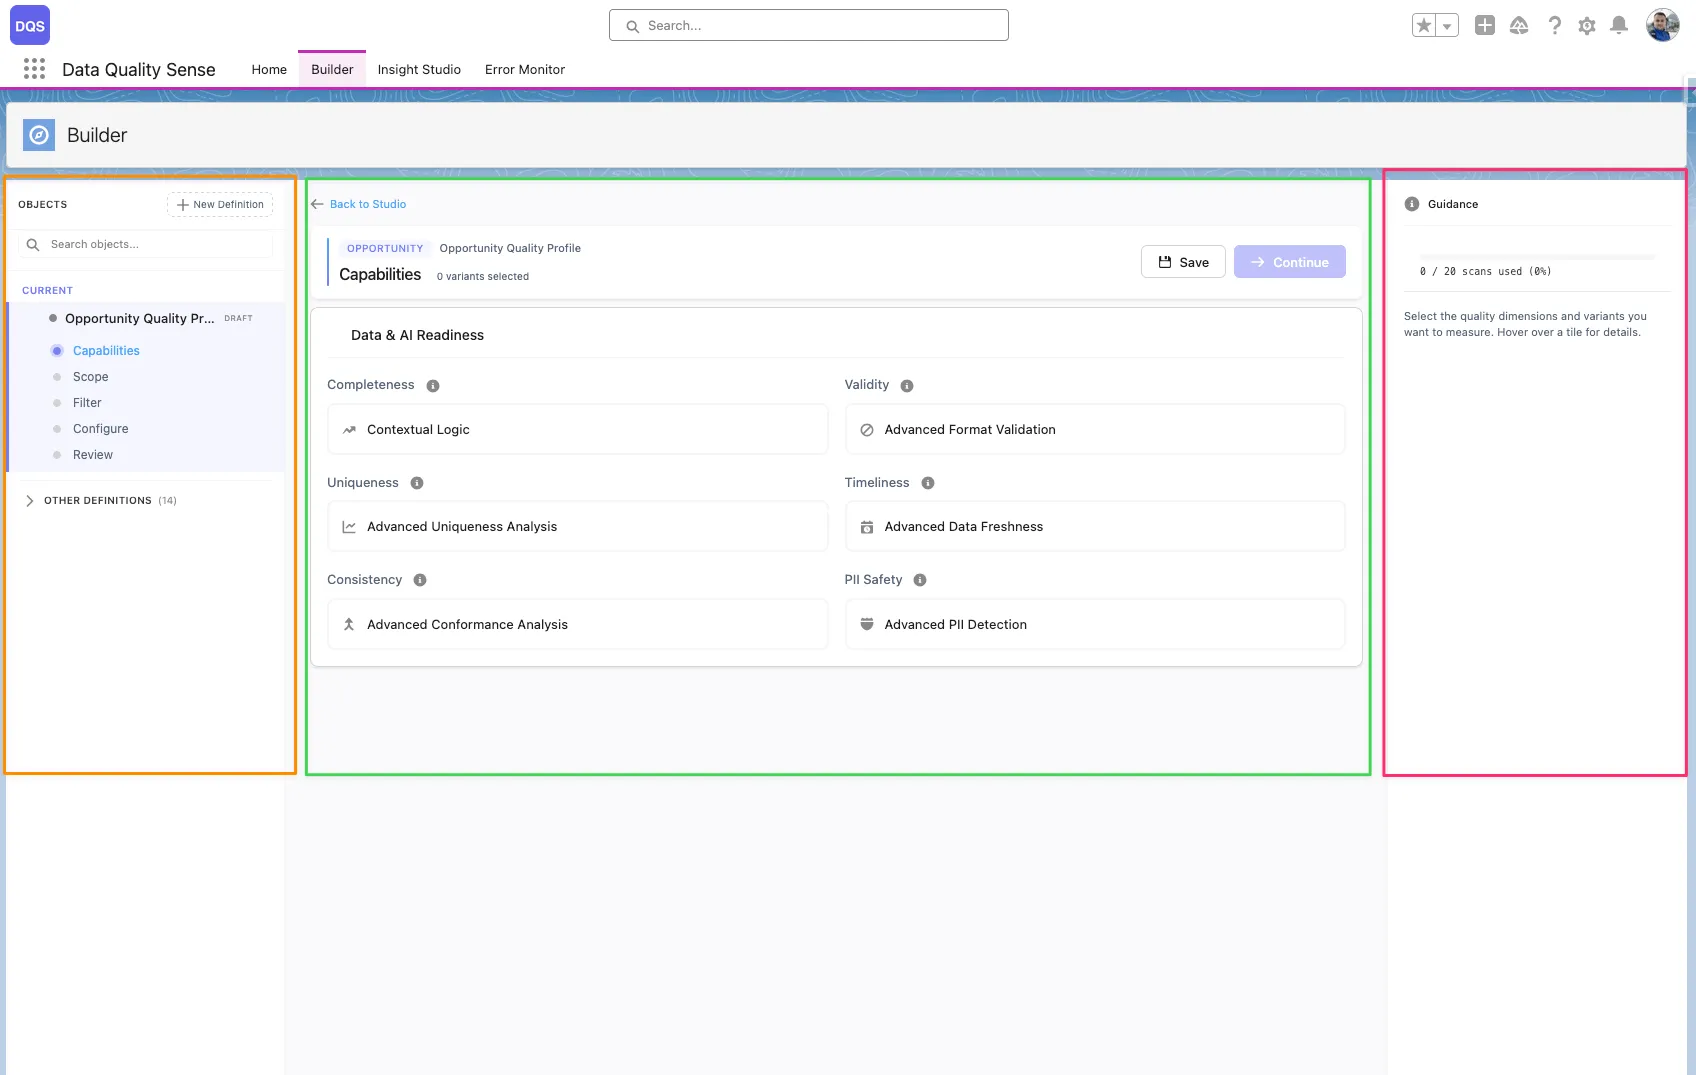
The DQS Builder is a multi-step configuration wizard that lets you define exactly how your data quality should be measured. It guides you through selecting objects, picking fields, choosing quality dimensions, and setting thresholds.
The Builder uses a 3-zone layout:
Definition
A scan configuration that specifies which object, fields, and quality capabilities to evaluate. Each definition produces a set of results when scanned.
Capability
A quality dimension like Completeness or Validity. Each capability can be configured globally or overridden per field.
Definition Detail
A record linking a specific field to a definition, storing per-field configuration overrides for each capability.
Lifecycle
Definitions progress through stages: Draft → Ready → Active → Obsolete. Only Active definitions can be scanned.
Each stage validates your input before allowing you to proceed to the next step.
A definition is the core configuration unit in DQS. It specifies:
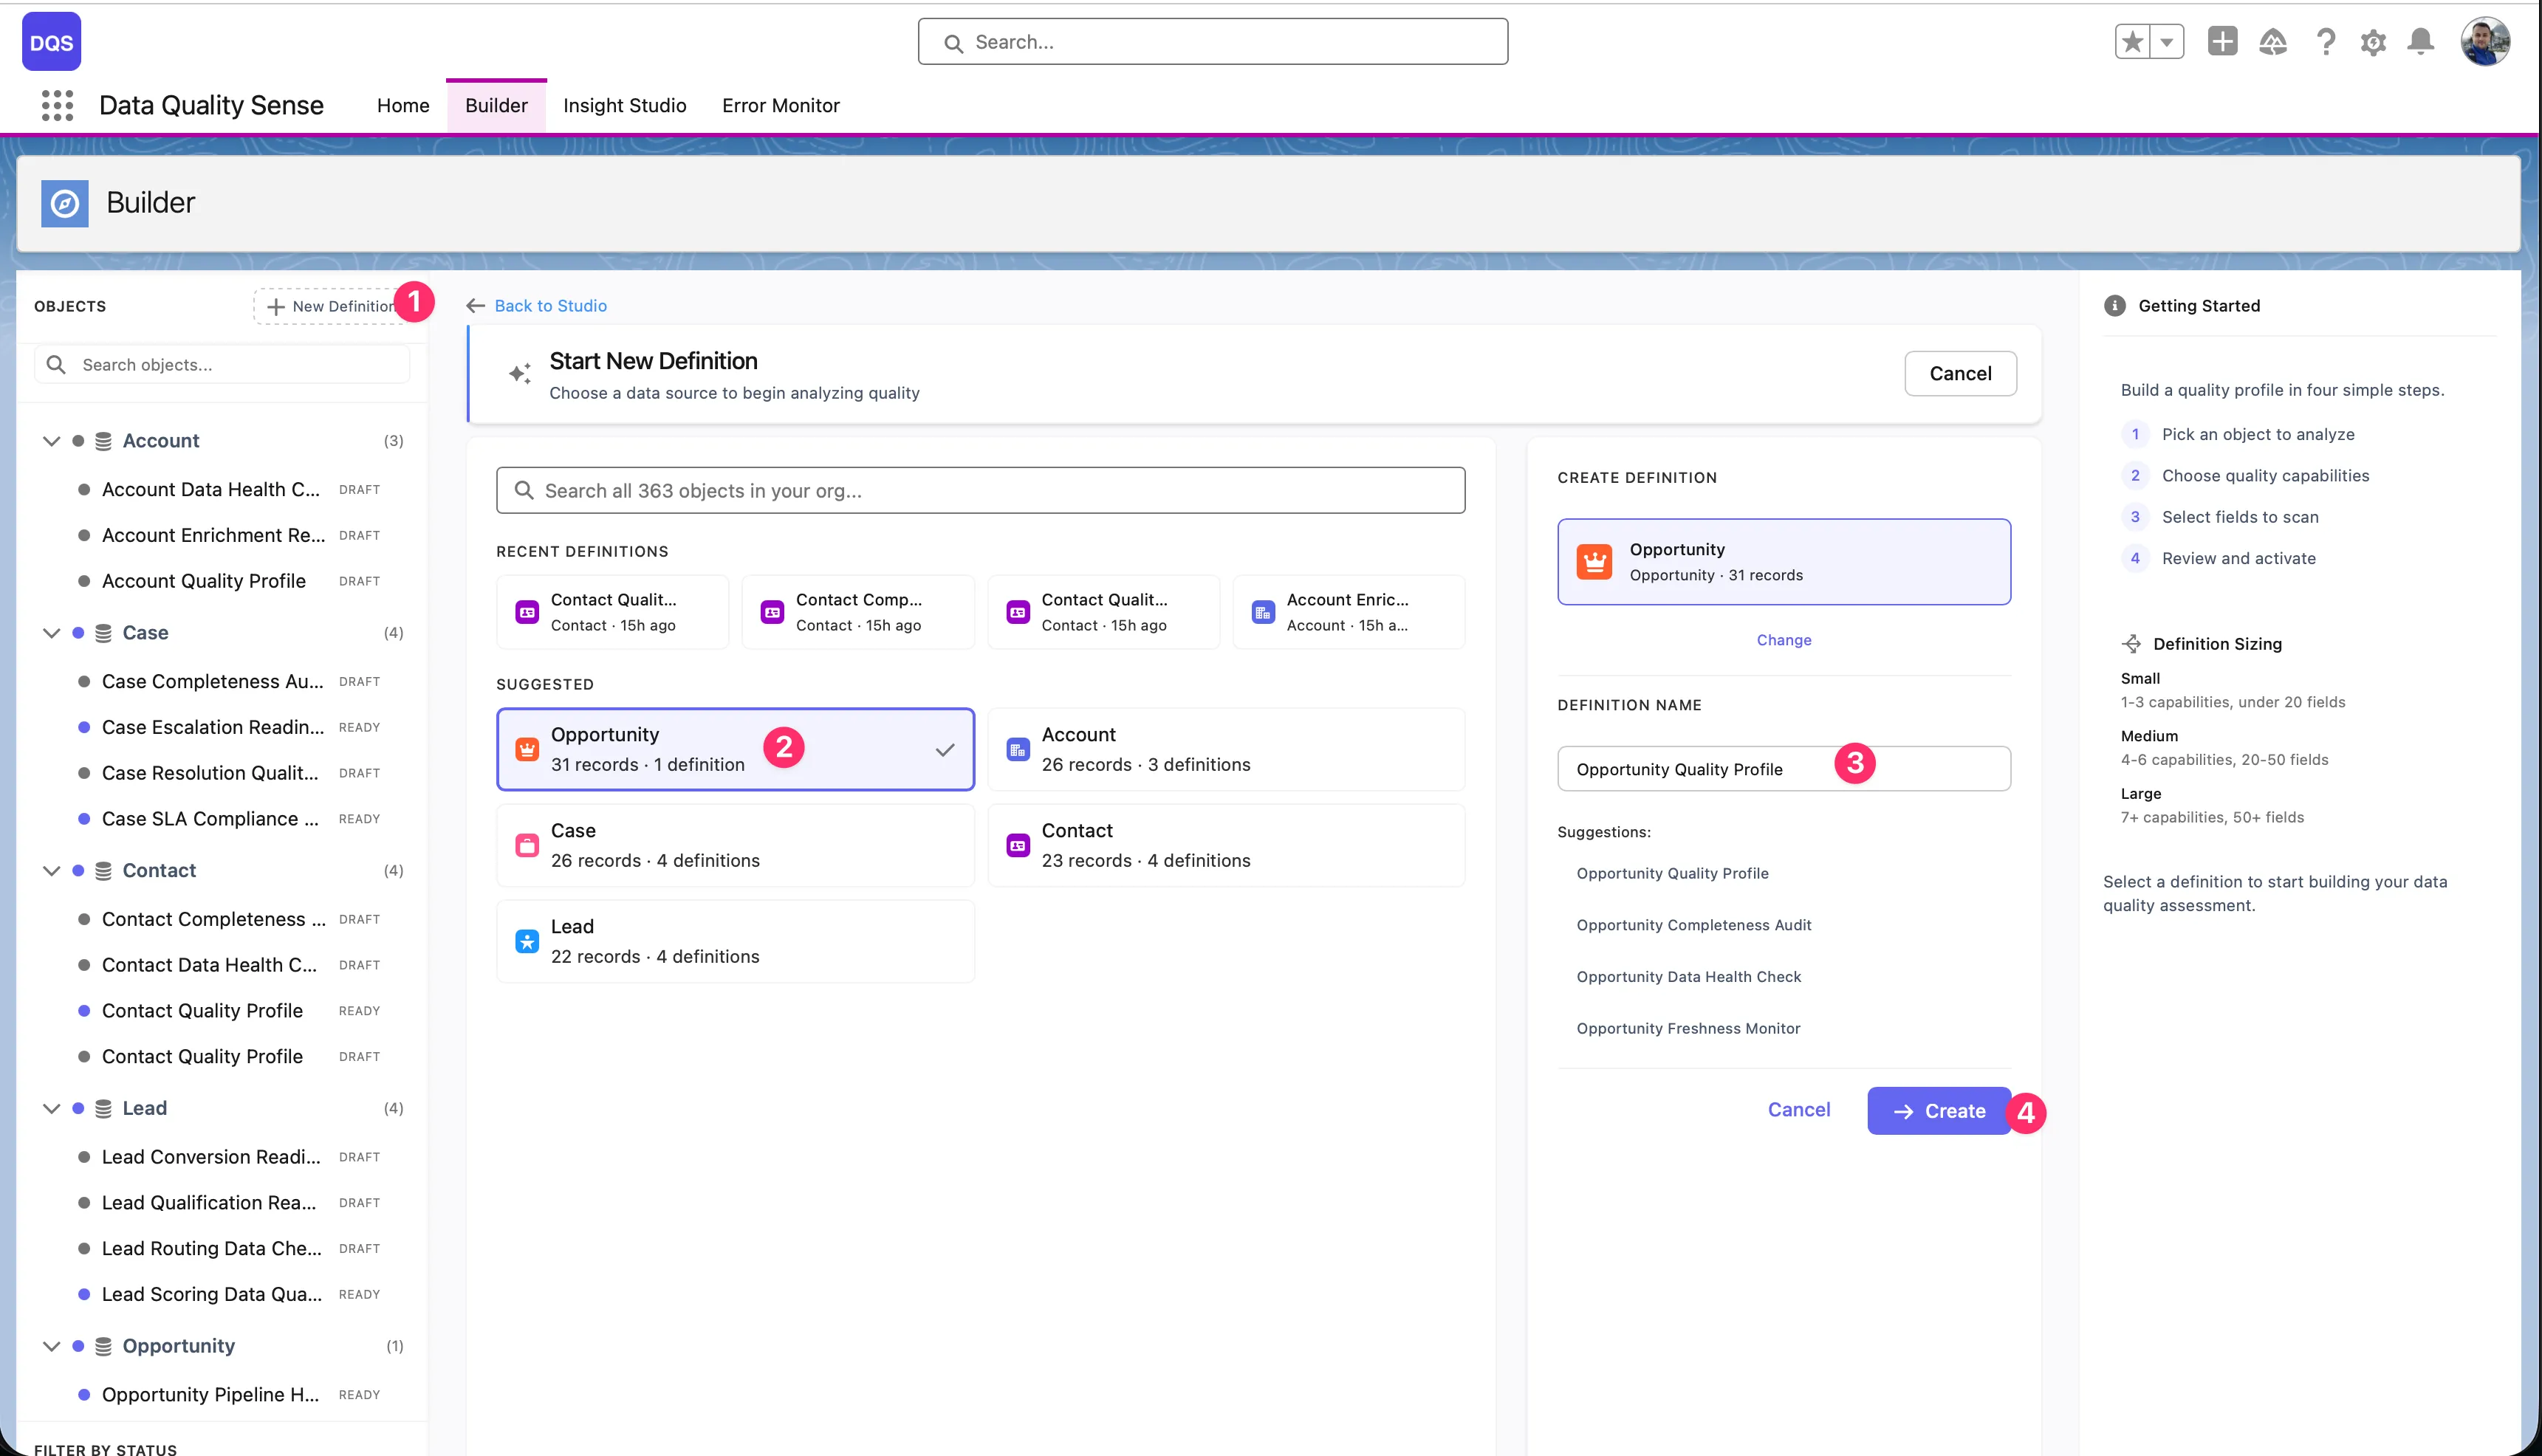
Click “New Definition”
In the Builder tab, click the New Definition button in the top-left corner. A creation dialog opens with object search, recent definitions, and suggested objects.
Select the target object
Pick the SObject you want to scan. You can search all objects in your org, choose from Recent Definitions (objects you’ve already built definitions for), or select from the Suggested list (Account, Opportunity, Contact, Case, Lead). The dialog shows how many records and existing definitions each object has.
Enter a definition name
Once you select an object, the right-hand panel shows a name field with auto-generated suggestions based on the object (e.g., “Opportunity Quality Profile”, “Opportunity Completeness Audit”). Pick a suggestion or type your own name.
Click ”+ Create”
The definition is created in Draft status and opens in the Builder wizard.
After creation, you can configure:
| Setting | Description |
|---|---|
| Name | Display name shown in lists and Insight Studio |
| Object | The target SObject (cannot be changed after creation) |
| Description | Optional notes about the scan’s purpose |
| Status | Current lifecycle stage (Draft, Ready, Active, Obsolete) |
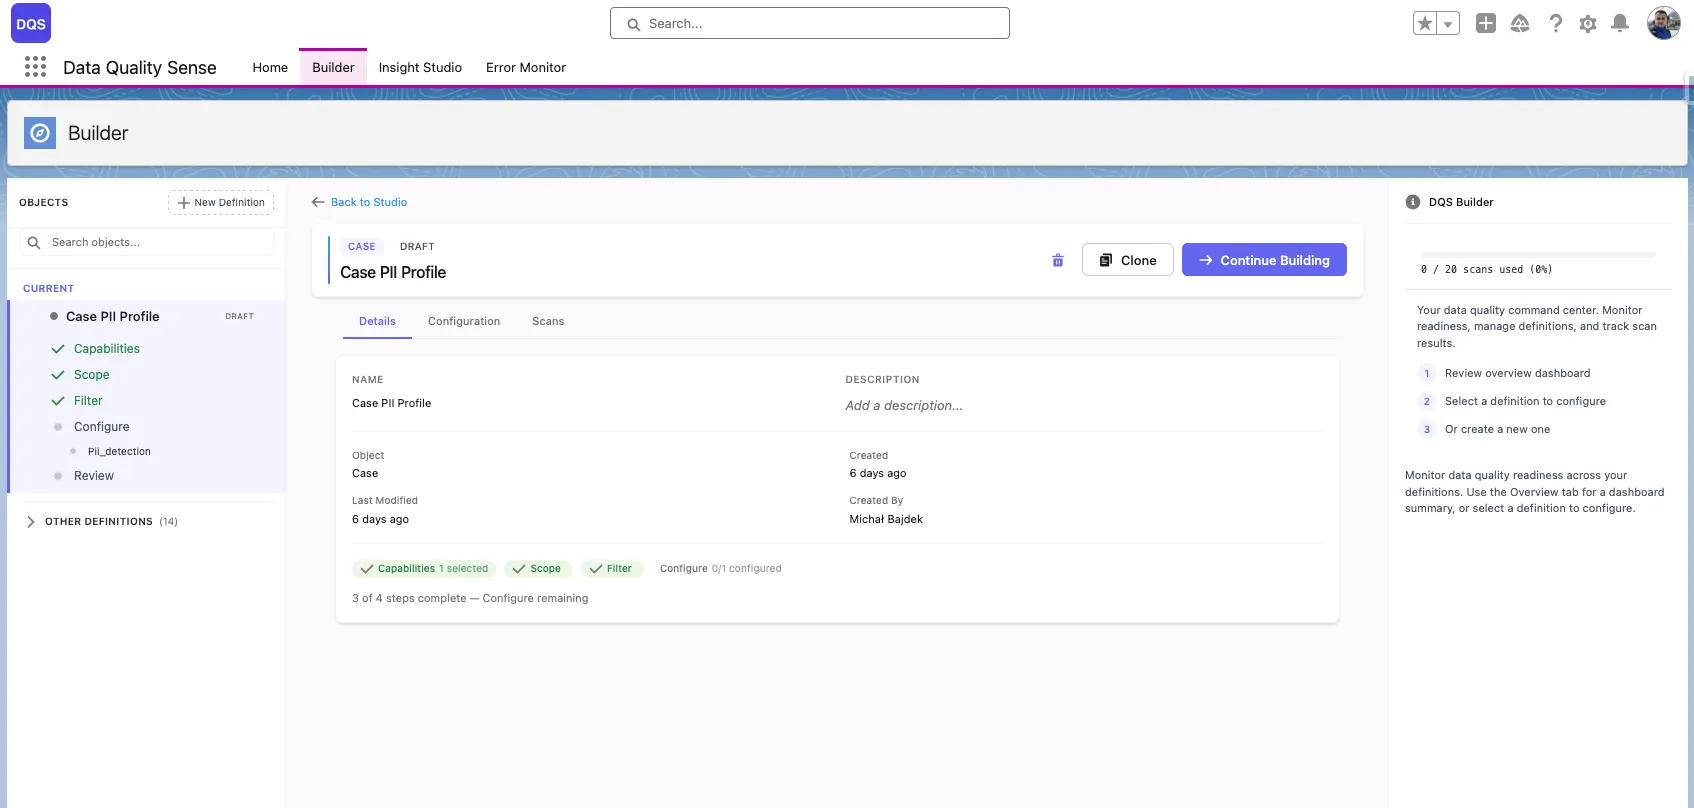
Open any definition from the Home tab’s recent activity table, or from the Builder’s sidebar navigation tree. Definitions in Draft status can be edited — click Continue Building to resume configuration.
The delete button (trash icon) is only available when both conditions are met:
Active or completed definitions cannot be deleted — retire them to Obsolete status instead.
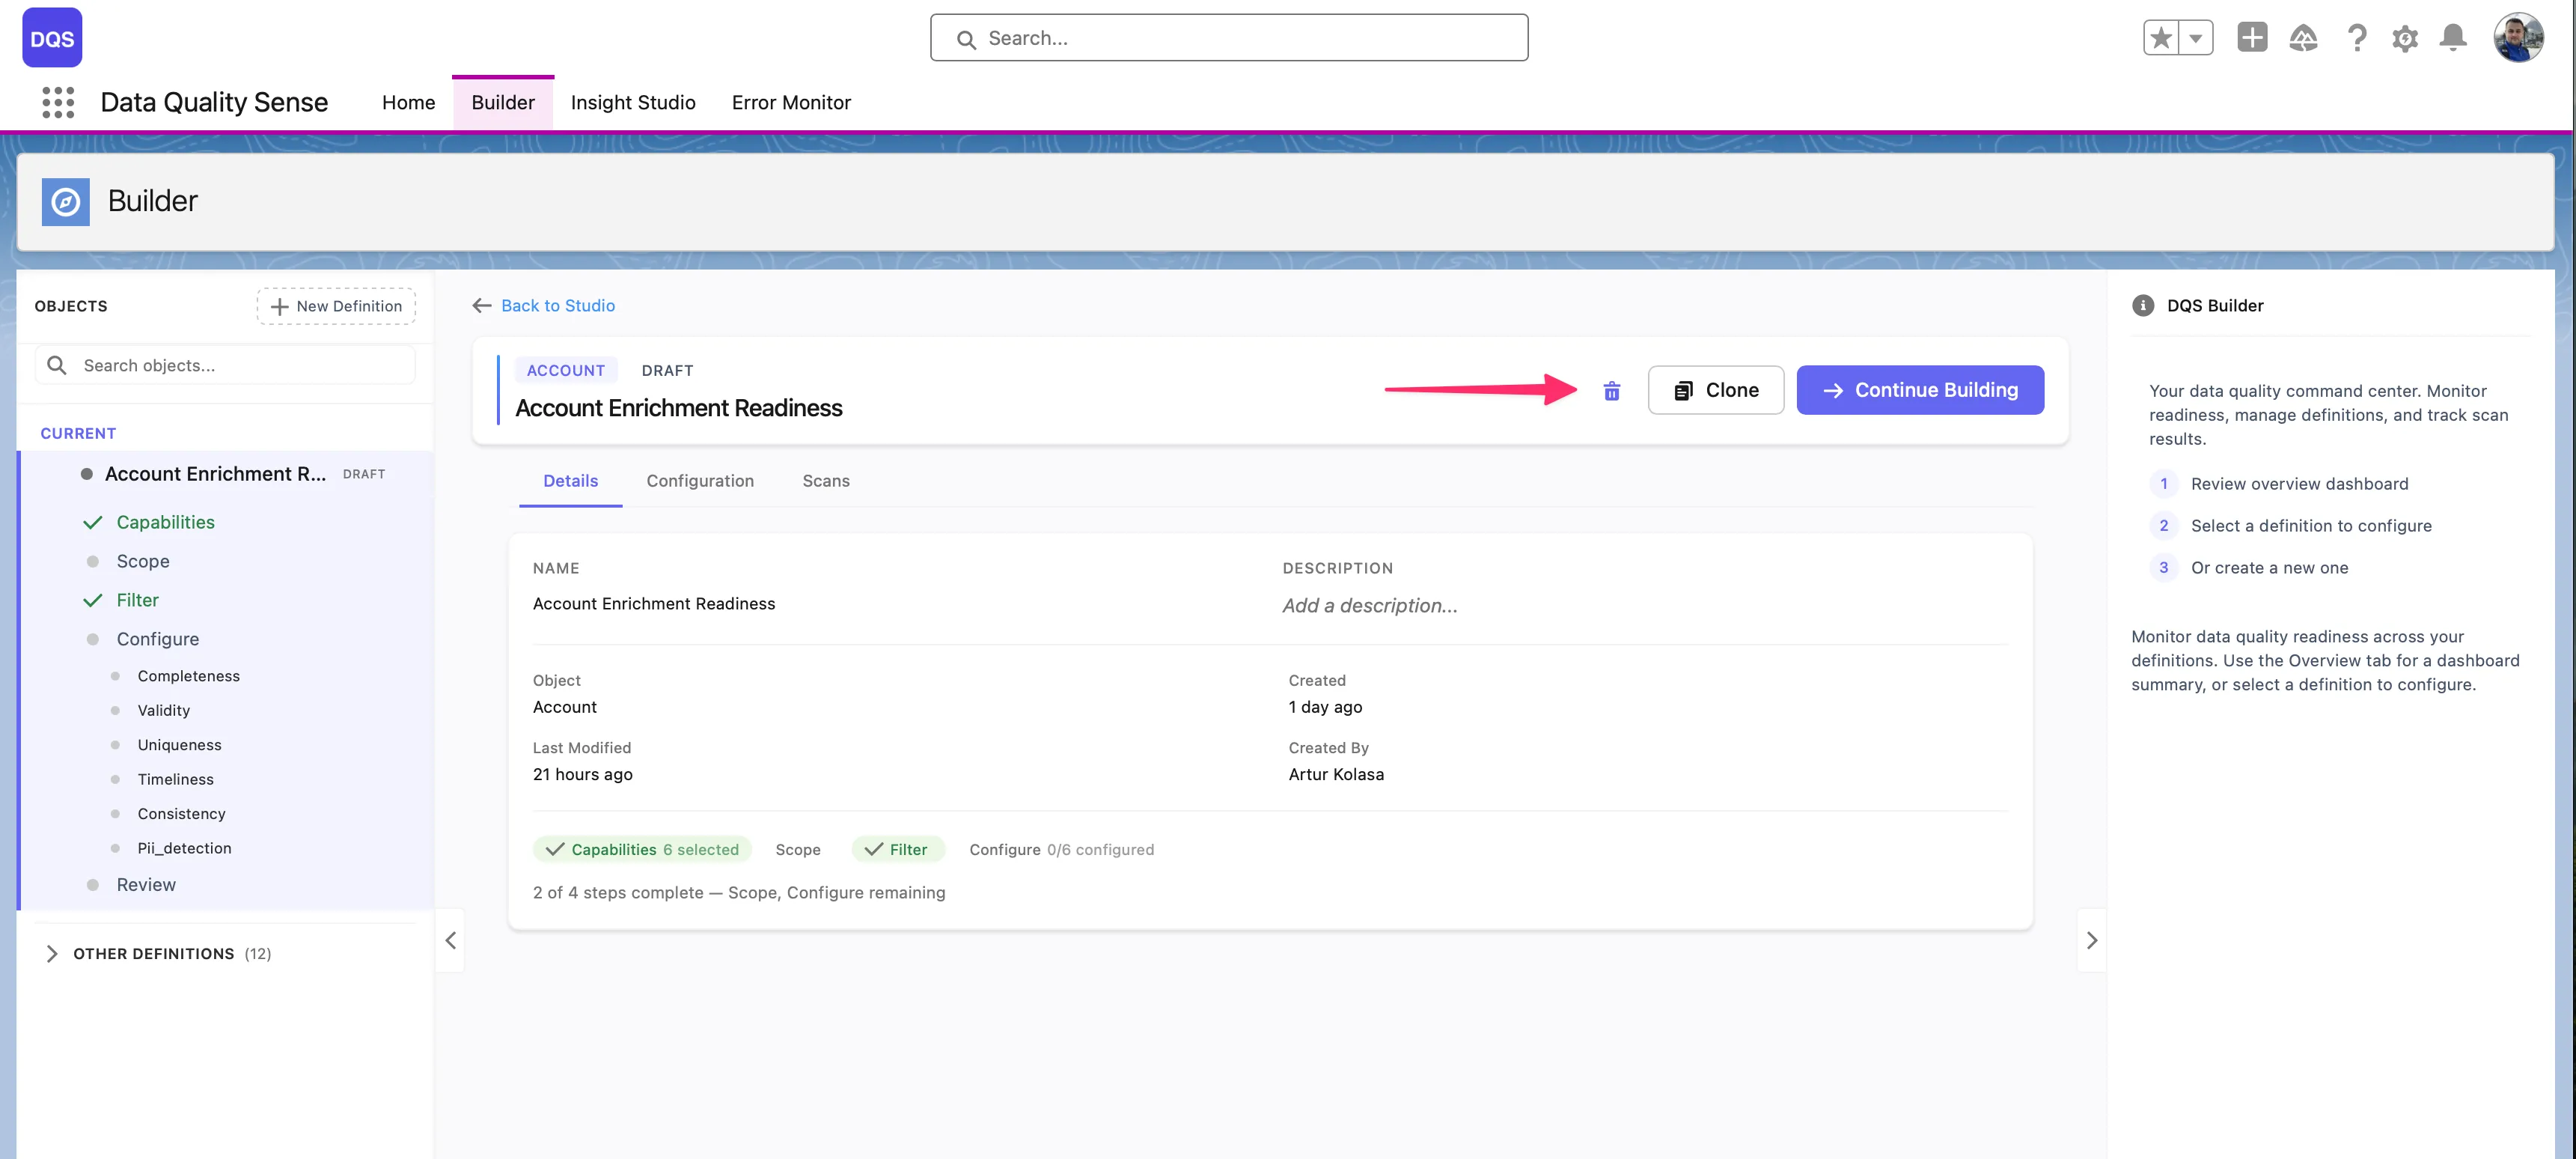
Deleting a definition removes all associated definition details, but preserves historical scan results for audit purposes.
The field picker is the second stage of the Builder wizard. It displays all available fields on your selected object in a paginated table.
For each field, the picker displays:
| Column | Description |
|---|---|
| Label | The field’s display name |
| API Name | The developer name (e.g., BillingCity) |
| Type | Field data type (Text, Number, Date, Picklist, etc.) |
| Required | Whether the field is required on the layout |
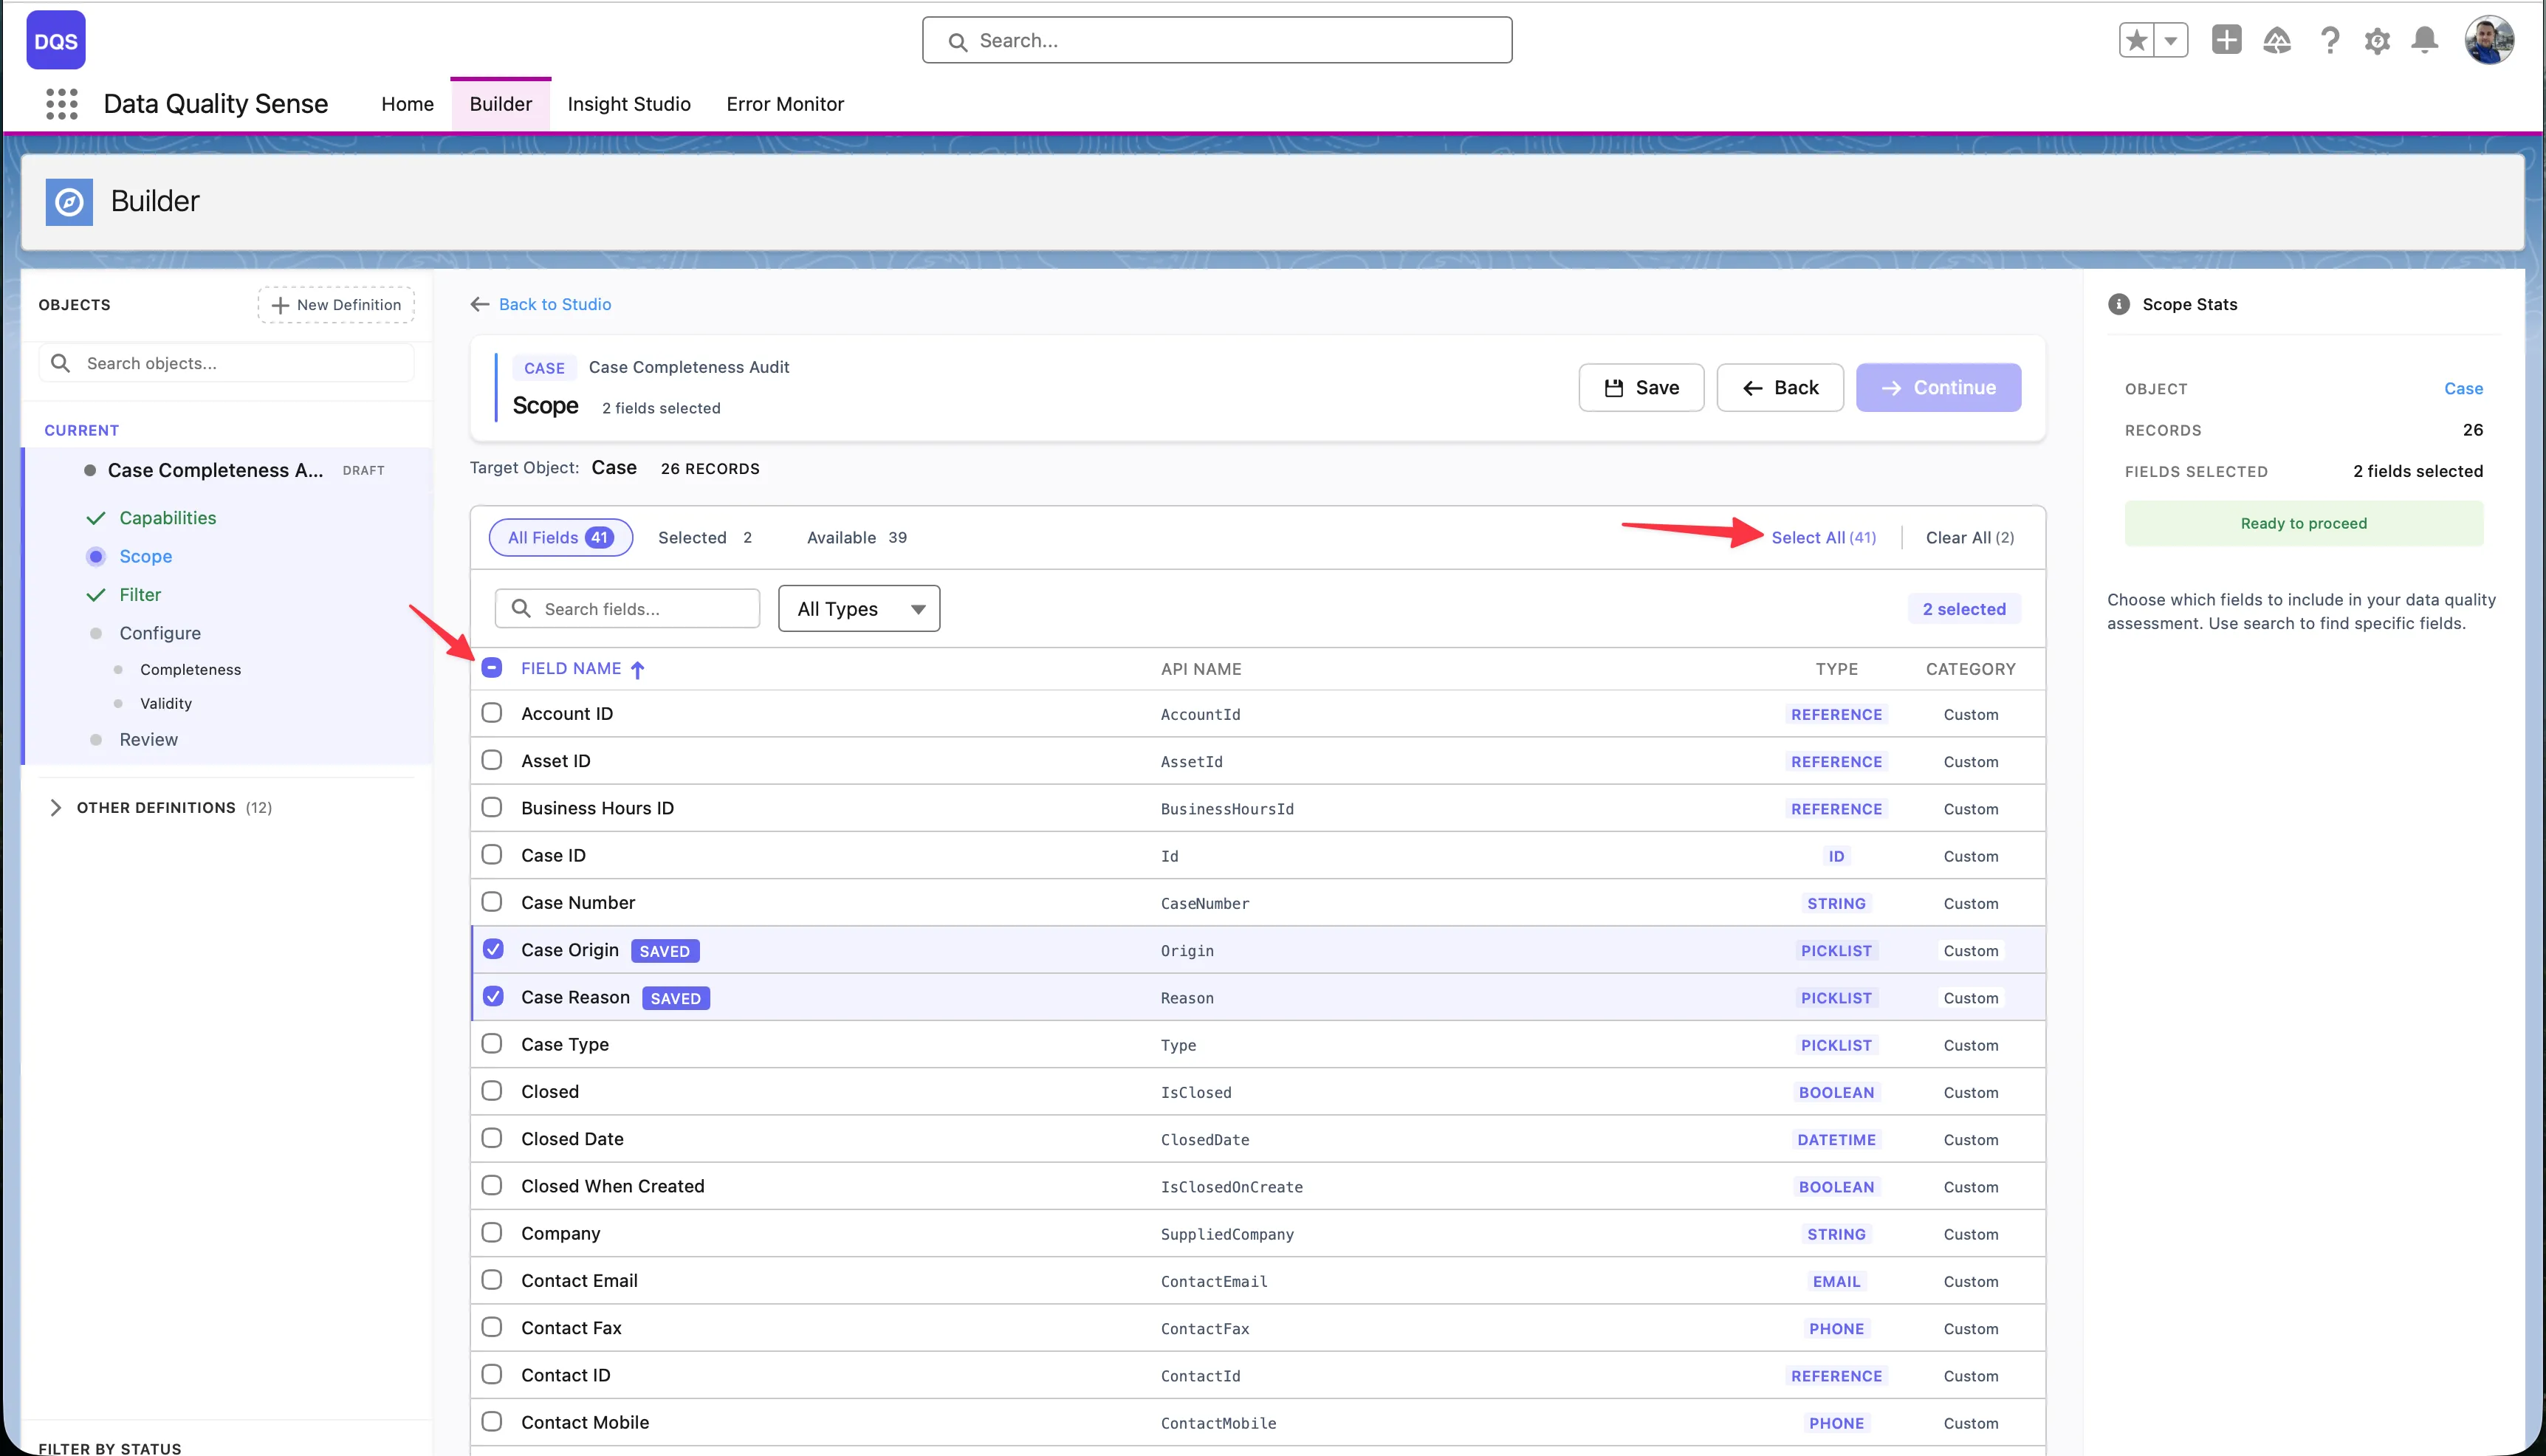
Use the Select All link to add all available fields to your scope at once — the link shows the total field count (e.g., “Select All (71)”). To remove all selections, click Clear All. The header bar displays live counters for Selected and Available fields so you always know how many fields are in scope.
Selections persist across pages — you can select fields on page 1, navigate to page 2, and your selections are preserved. The Scope Stats panel on the right summarizes your current selection.
For a comprehensive scan, include:
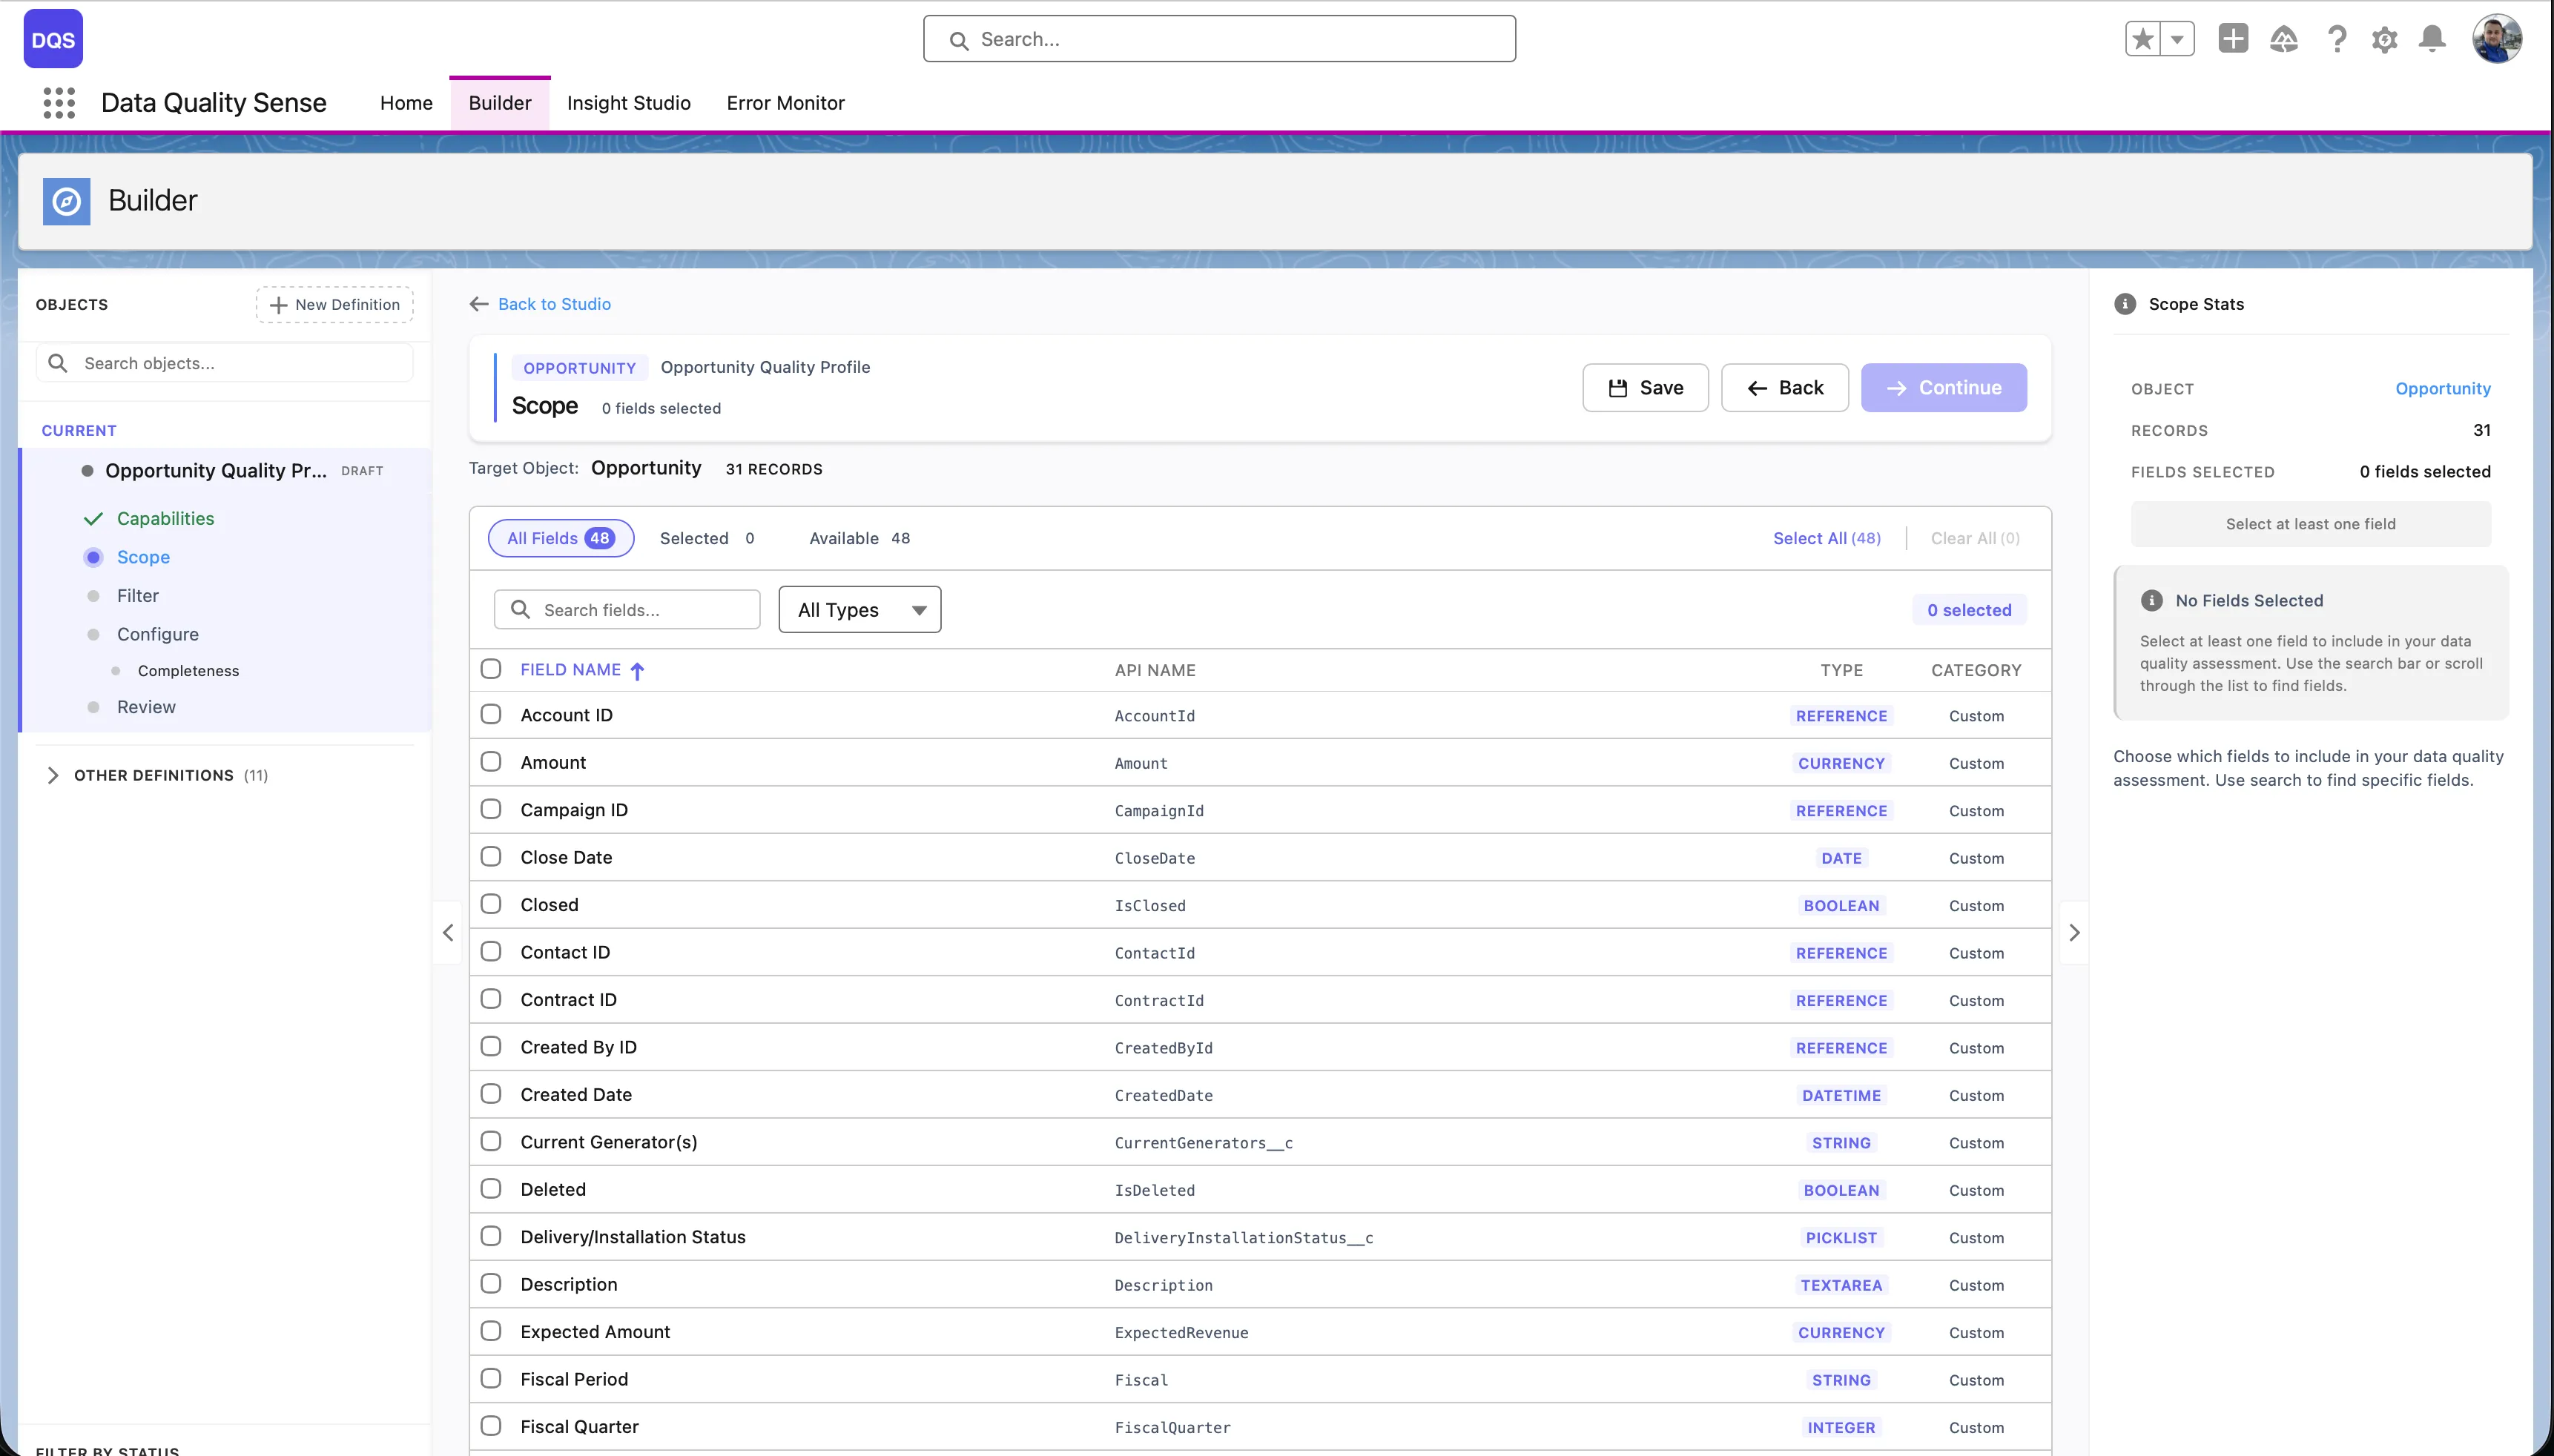
The Scope view is the main workspace for selecting and reviewing fields:
Scope step — Click the Scope step in the Builder wizard sidebar to load all fields for the target object. This is where you define which fields will be included in your data quality scan.
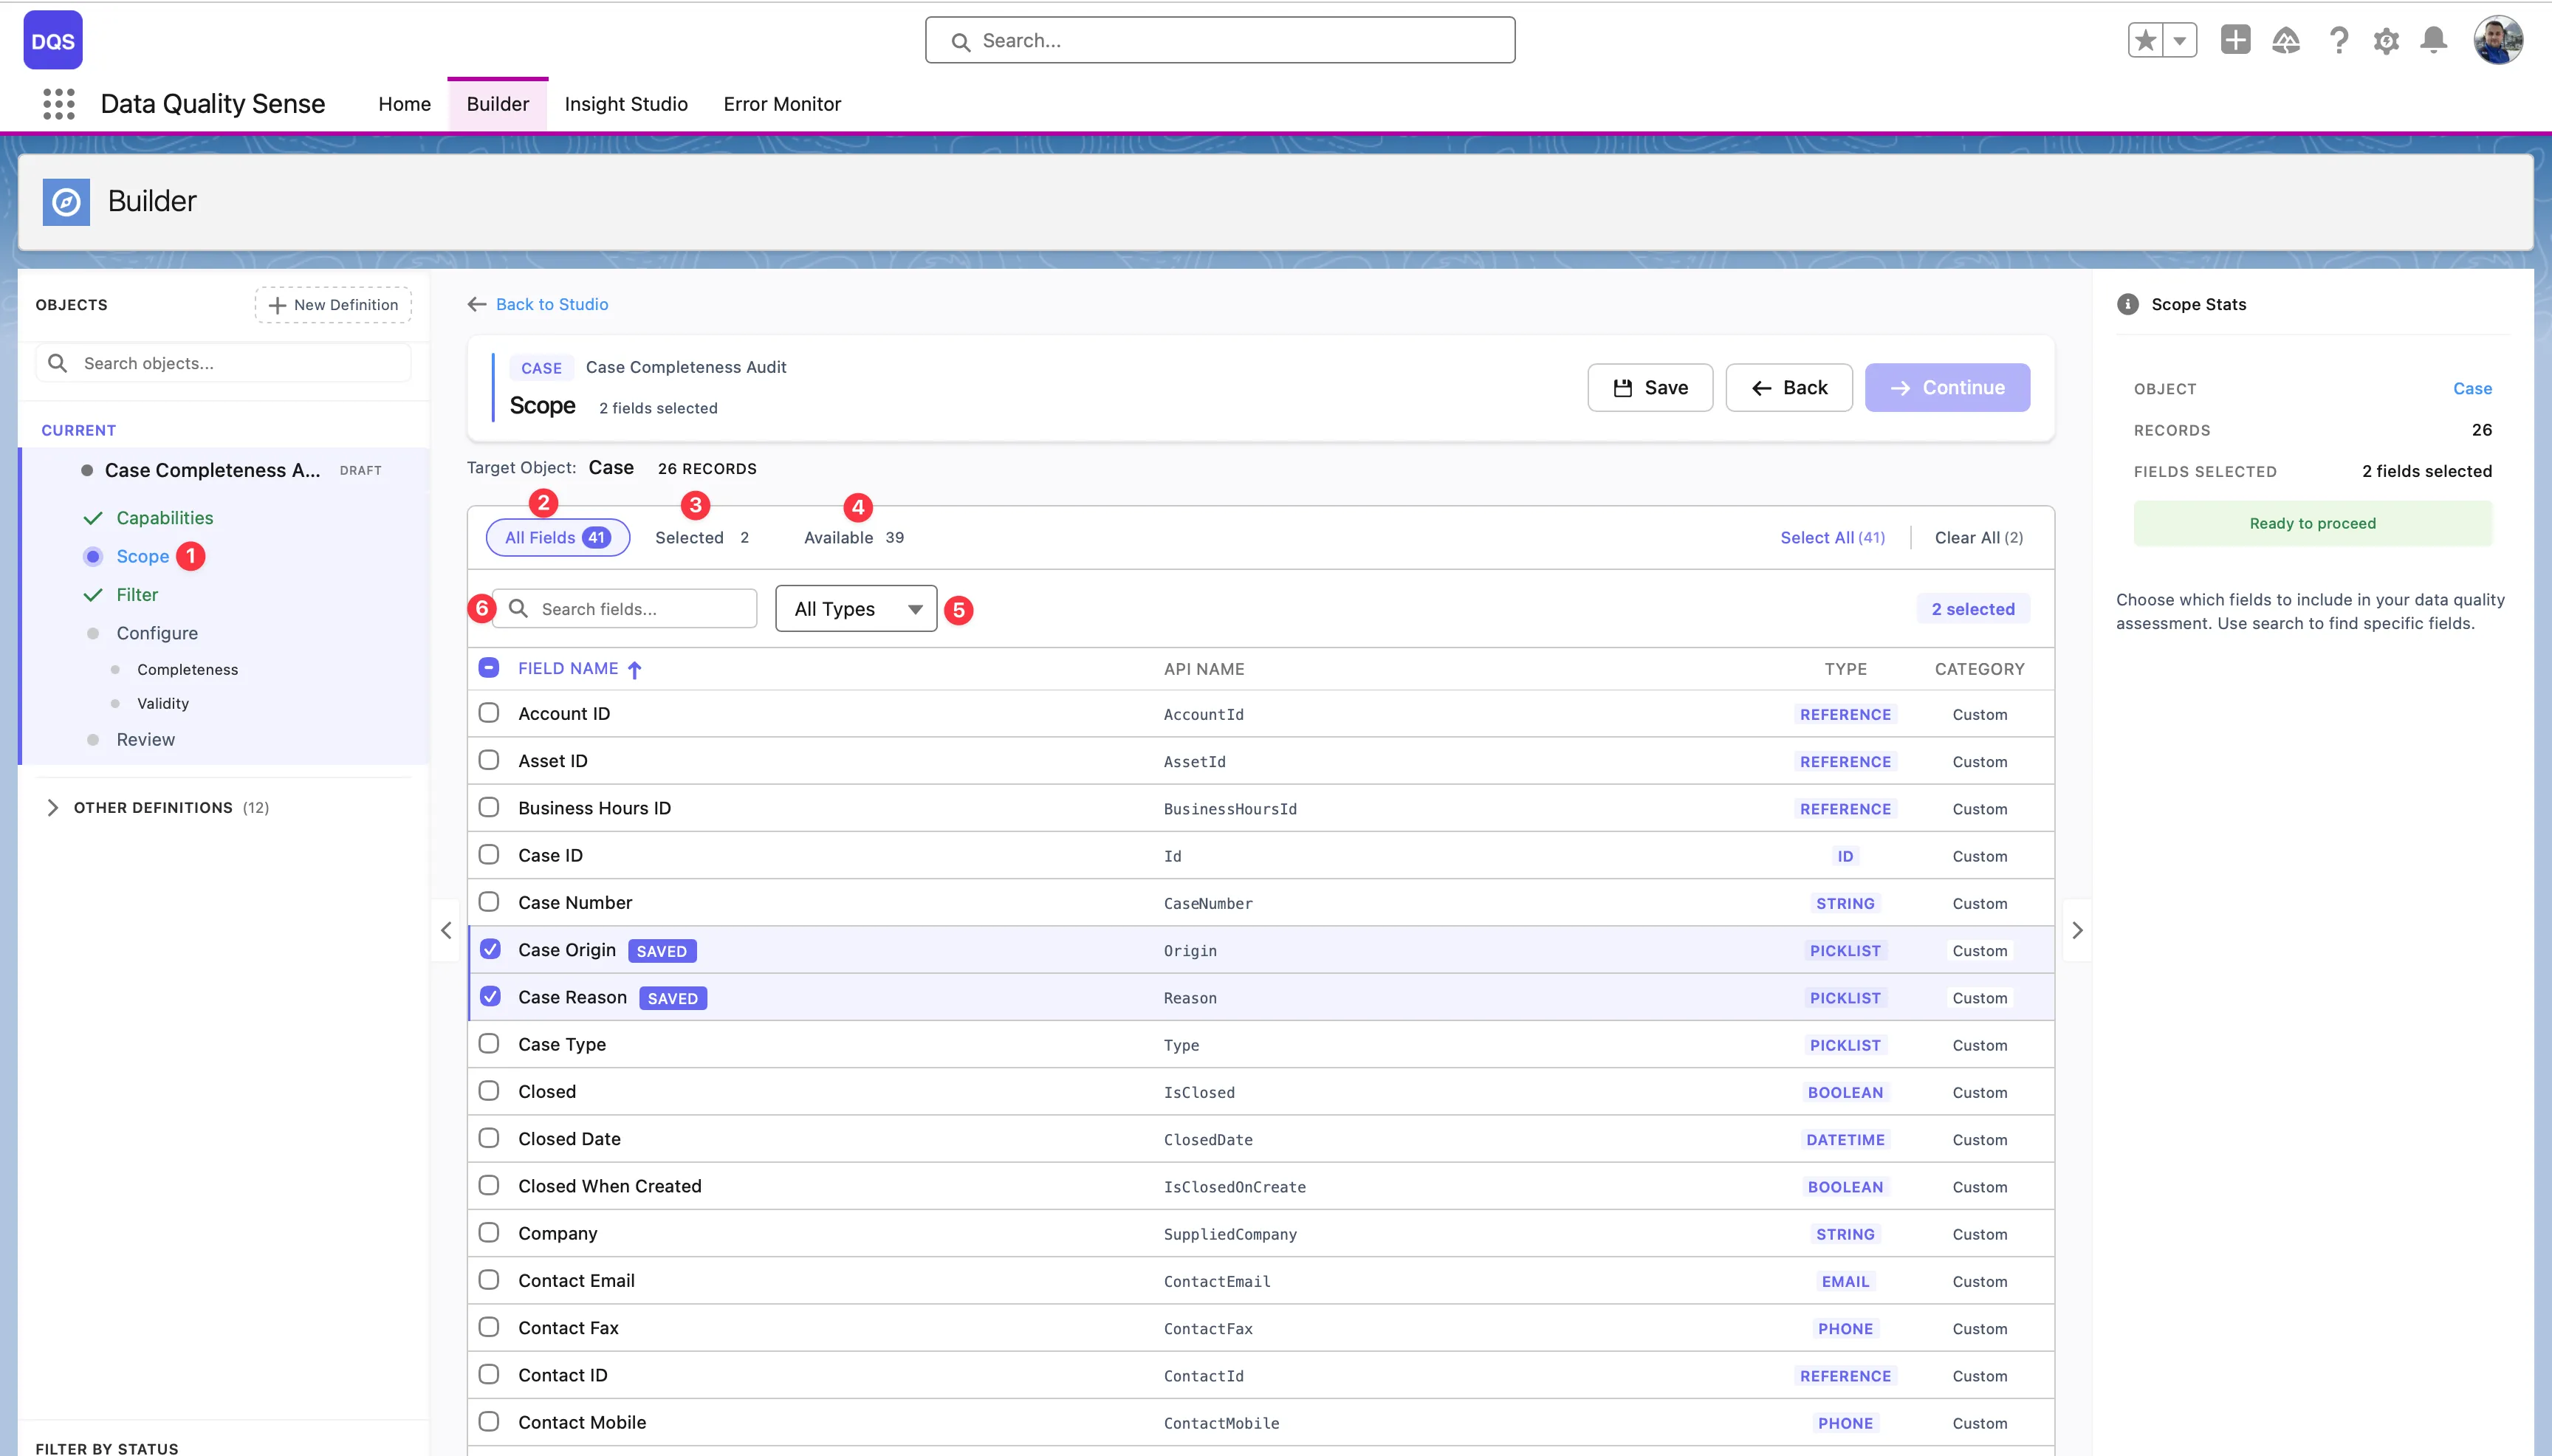
All Fields — The default view showing every field on the object. Use this tab to browse the full list, check or uncheck fields, and see each field’s label, API name, type, and whether it’s a standard or custom field. Fields you select are highlighted in the list.
Selected filter — Switch to this view to see only the fields you’ve already added to scope. The counter shows how many fields are selected (e.g., “Selected: 2”). Use it to quickly review your choices and remove any fields you no longer need.
Available filter — Shows only the fields that are not yet in your scope. The counter displays how many remain (e.g., “Available: 16”). Useful when you want to browse what’s left to add without scrolling past already-selected fields.
Type filter — The All Types dropdown lets you narrow the field list to a specific data type — Text, Number, Date, Picklist, Boolean, Lookup, and more. Combine it with the other filters to quickly find the exact fields you need (e.g., show only available Picklist fields).
The Scope Stats panel on the right summarizes your selection with a field count and shows a Ready to proceed indicator when at least one field is selected.
The third stage of the Builder wizard lets you enable quality dimensions and configure their settings. Each capability evaluates a different aspect of your data quality.
| Capability | What It Measures |
|---|---|
| Completeness | Are fields populated? |
| Validity | Do values match expected formats? |
| Uniqueness | Are there duplicate values? |
| Timeliness | Is data up to date? |
| Consistency | Are related fields logically consistent? |
| PII Detection | Is personal data properly handled? |
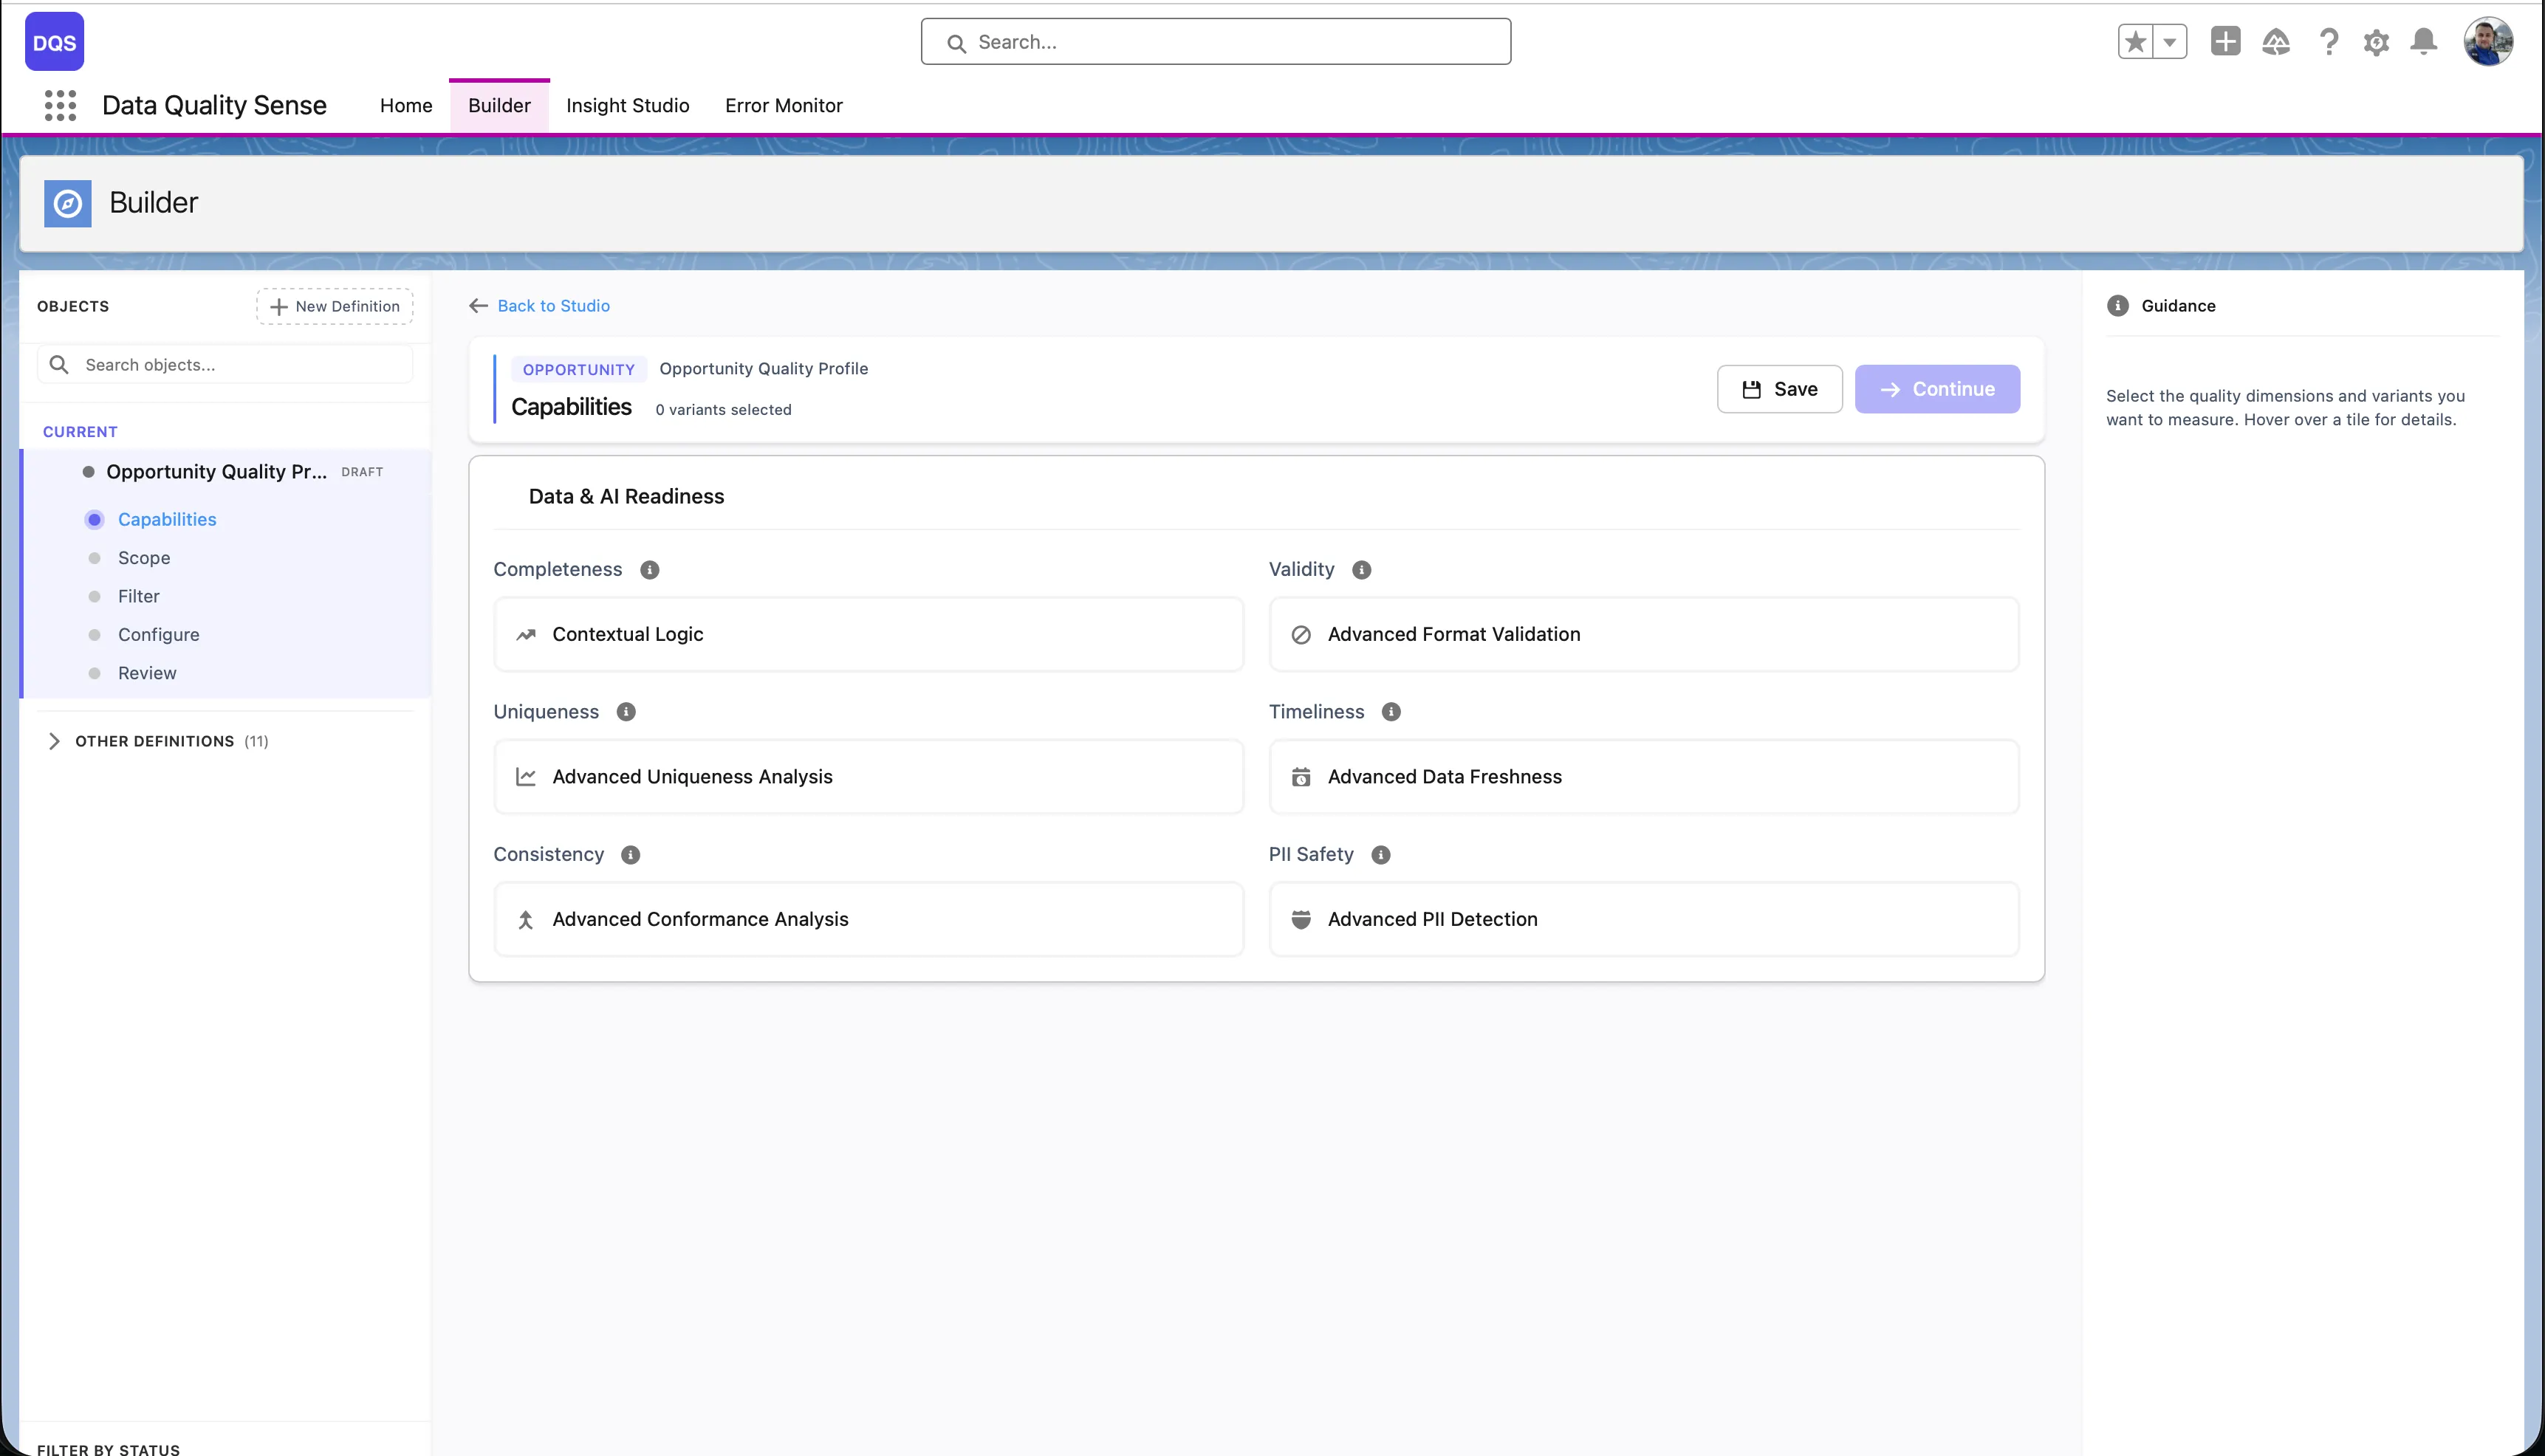
Select a capability from the list to enable it. Each capability has:
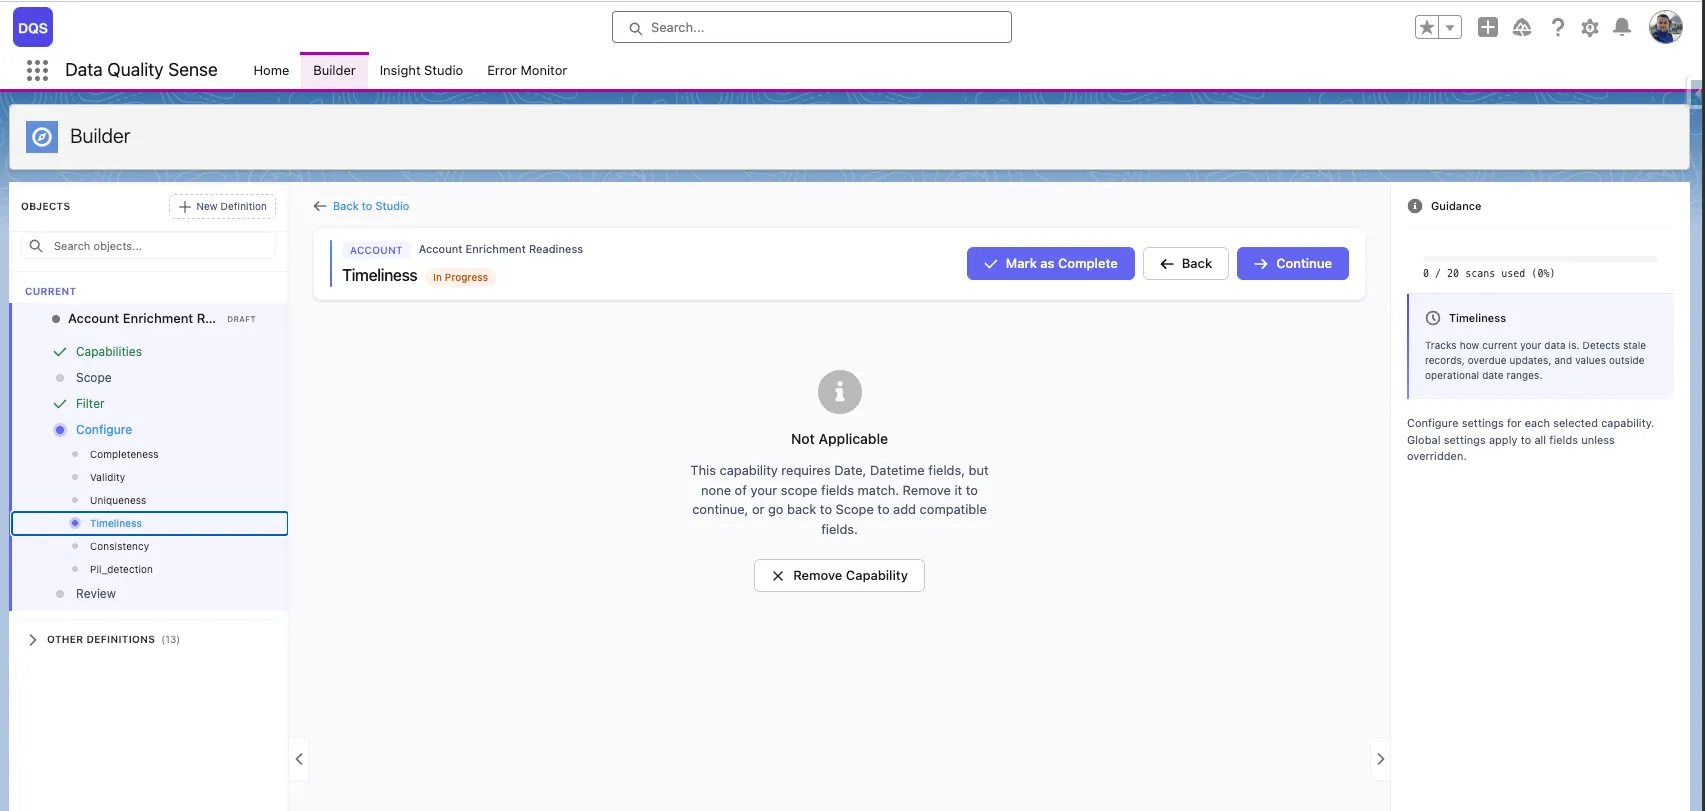
Some capabilities require specific field types. For example, Timeliness only works with Date and DateTime fields. If none of the fields in your definition match, the capability displays a “Not Applicable” message and cannot be configured until you go back to scope and add compatible fields.
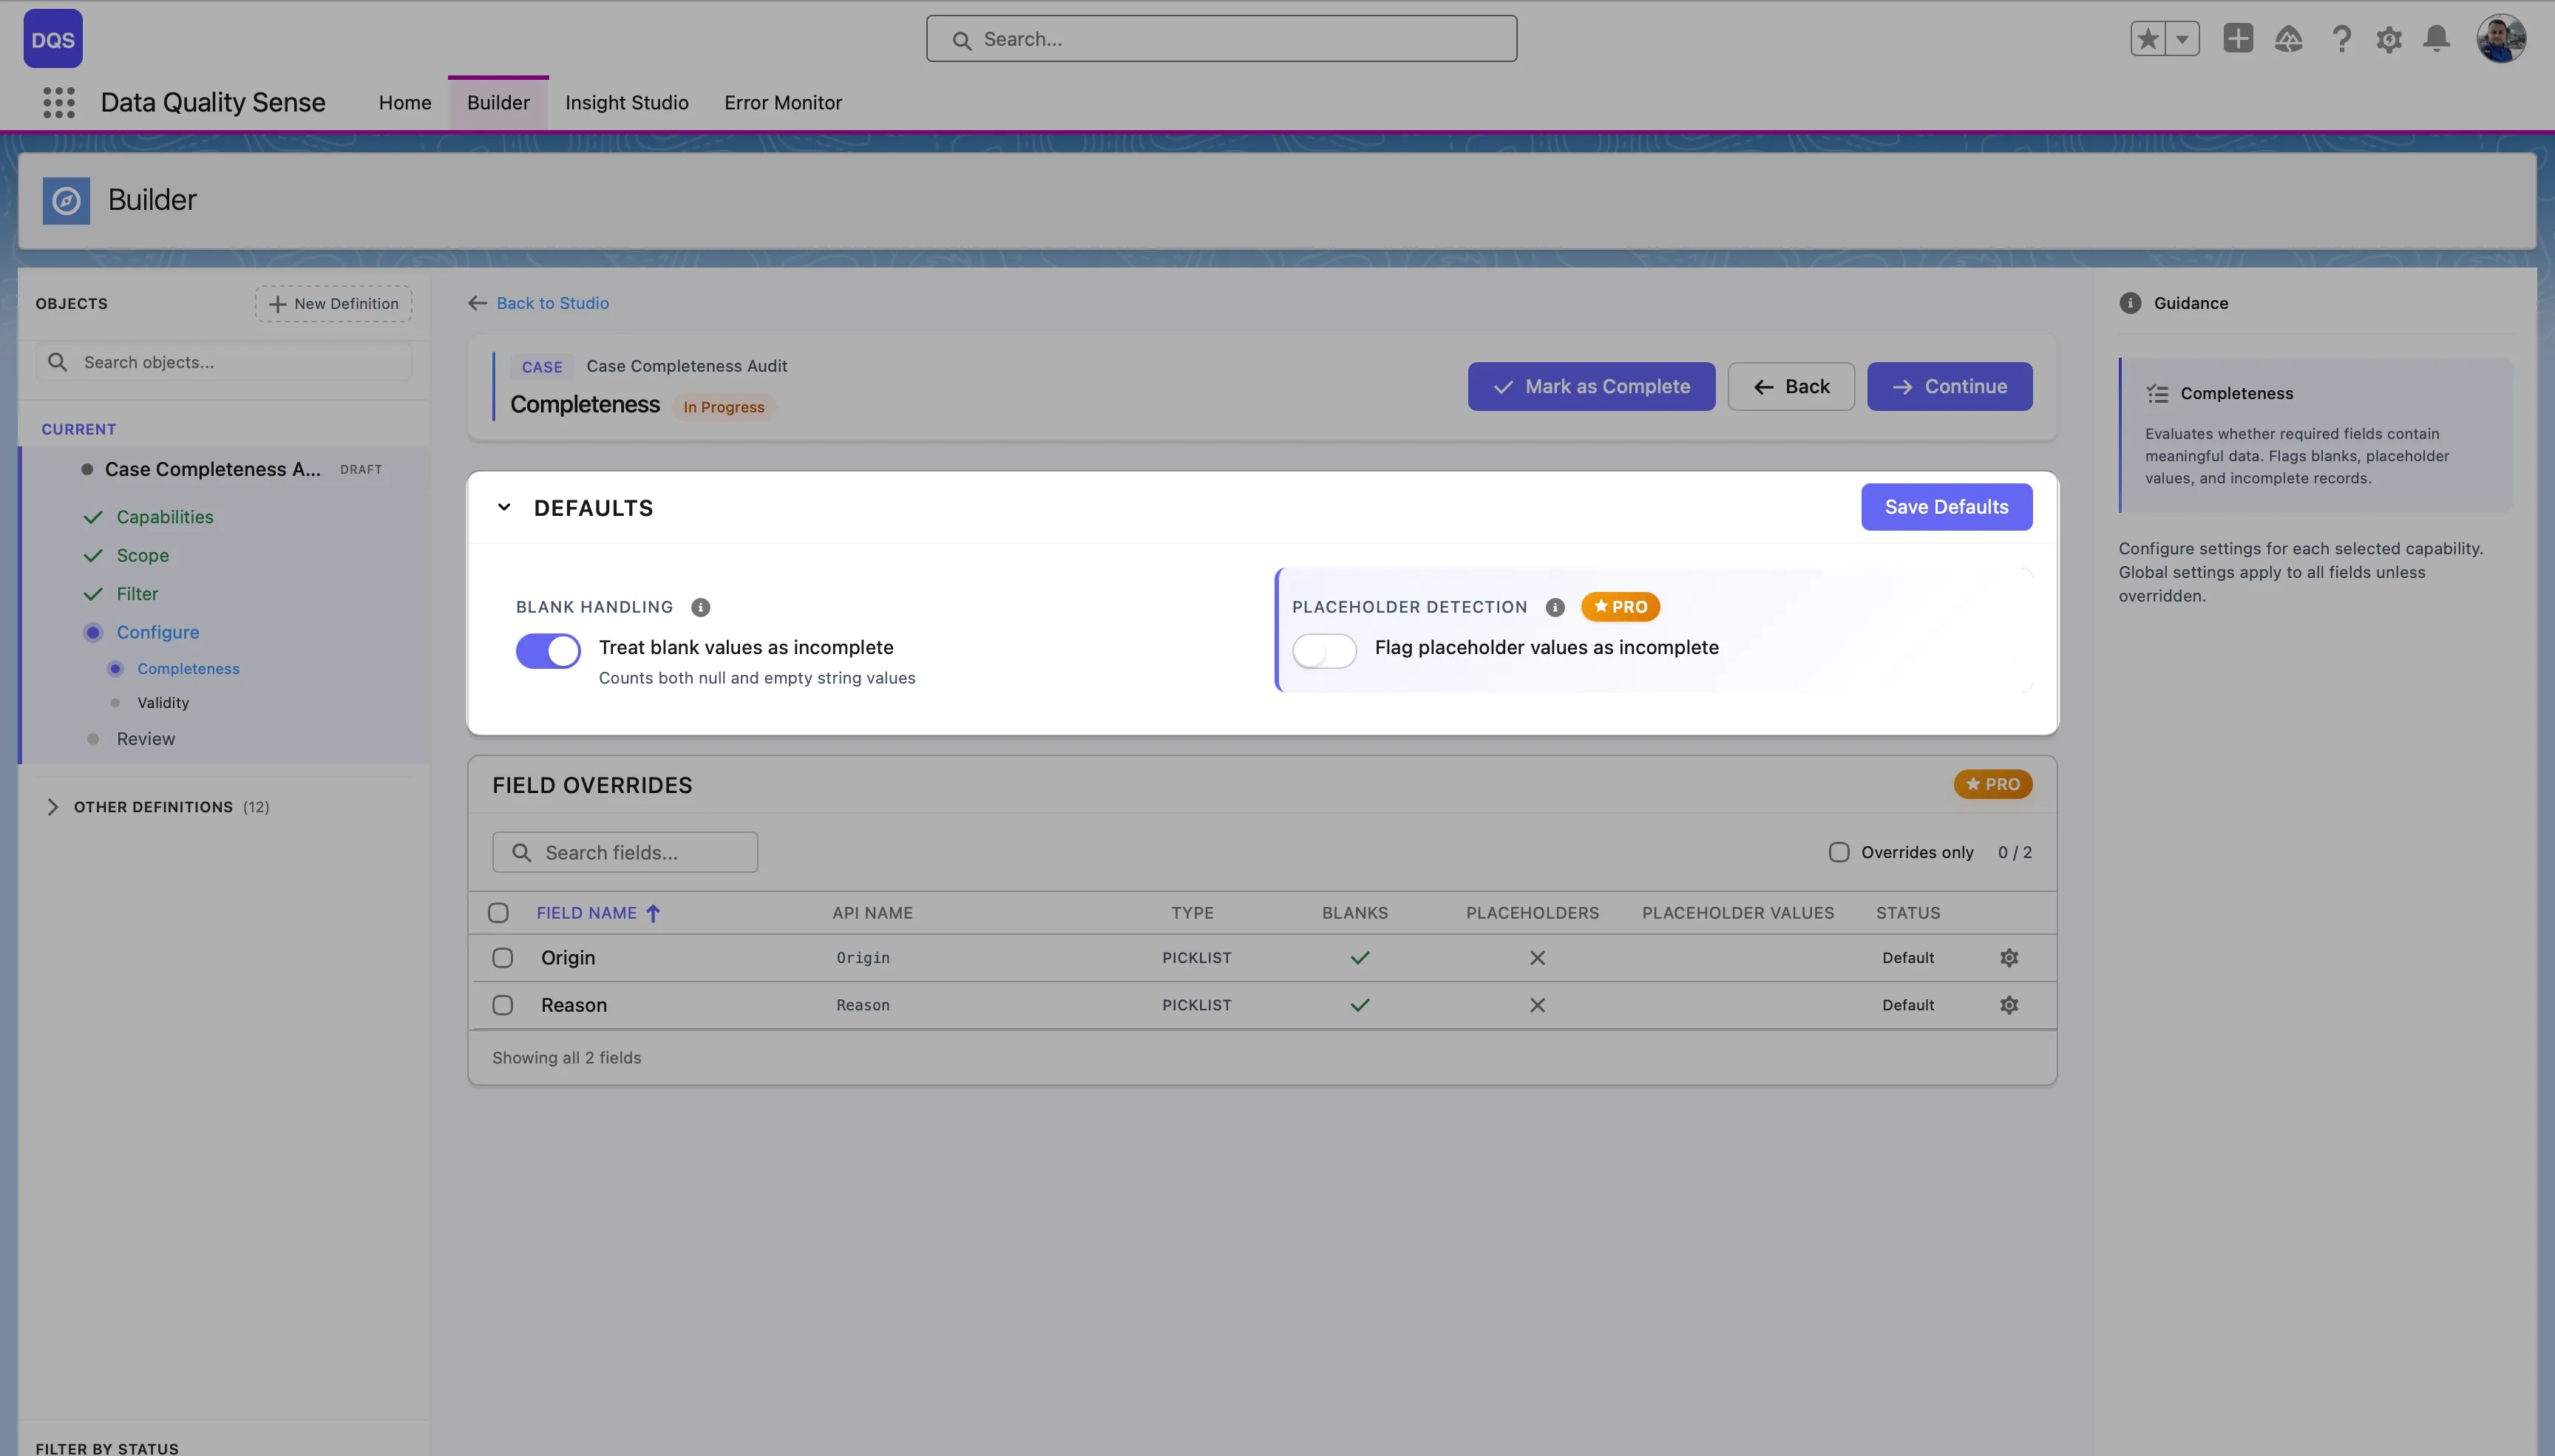
Most capabilities allow you to set global thresholds and then override them for specific fields. For example:
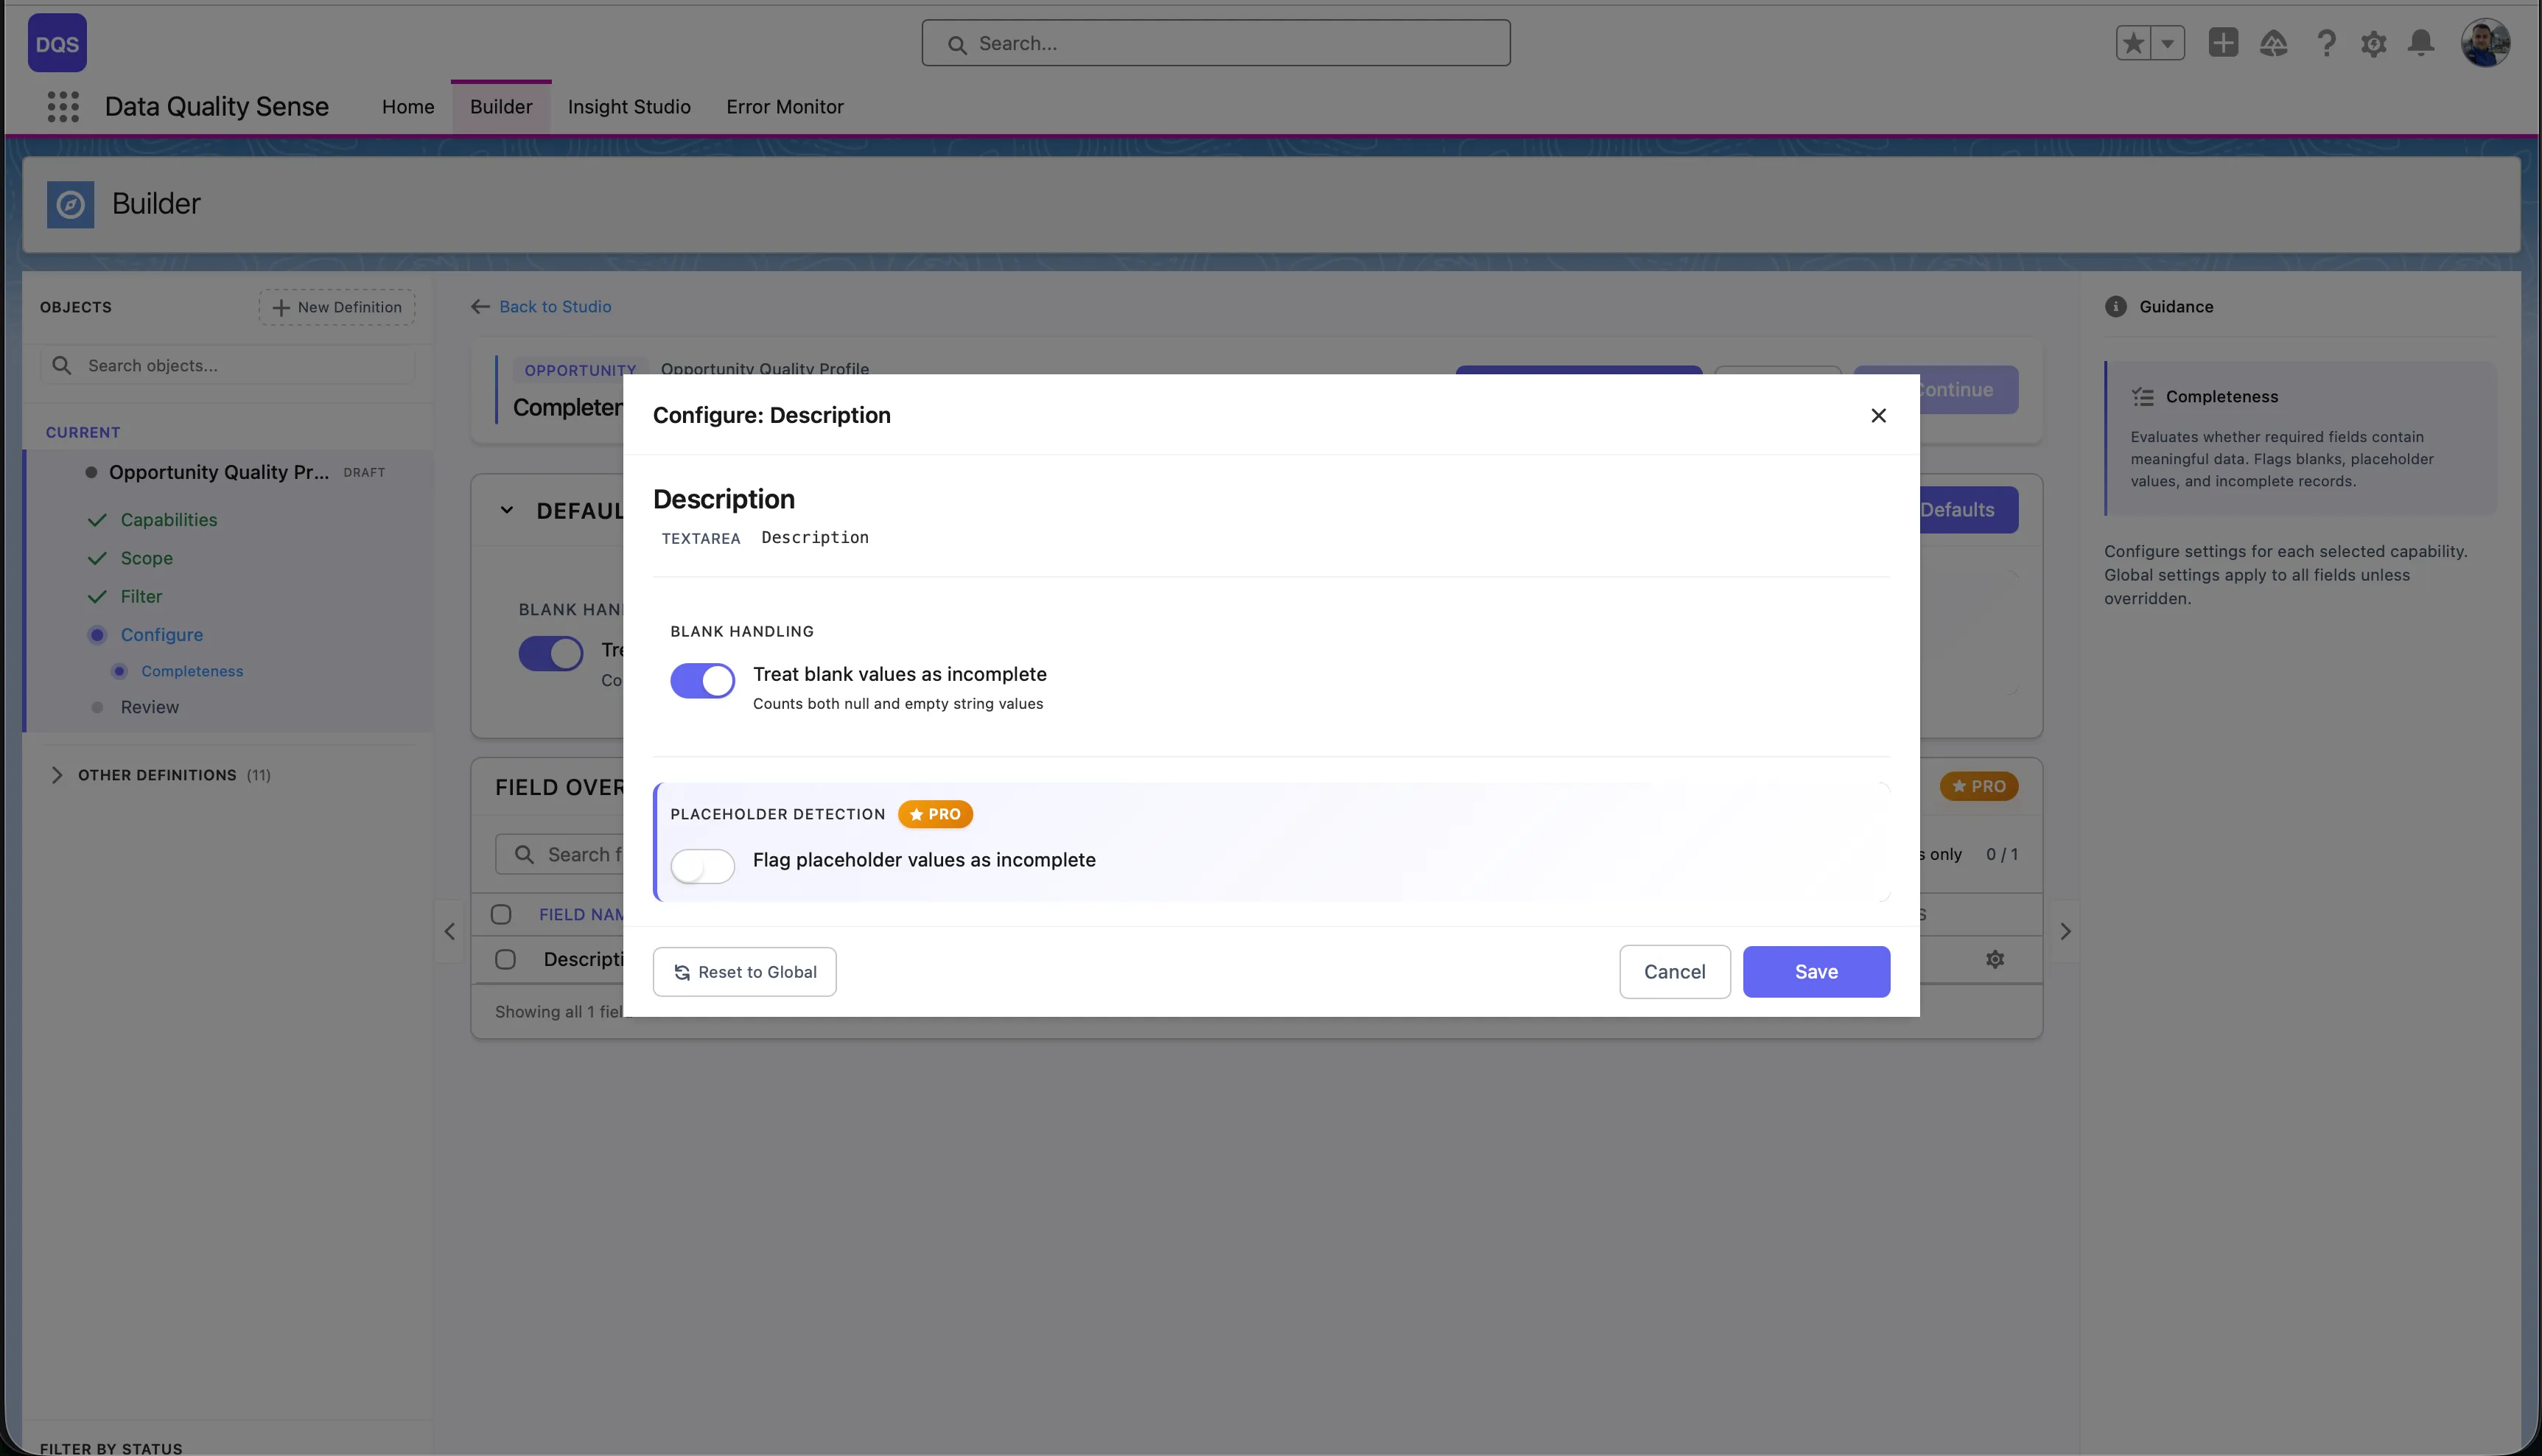
The Defaults section at the top controls global settings for the capability (e.g., Blank Handling and Placeholder Detection for Completeness). These apply to all fields unless overridden. The Field Overrides table below lists each field in scope with its current status — “Default” means the field uses the global settings.
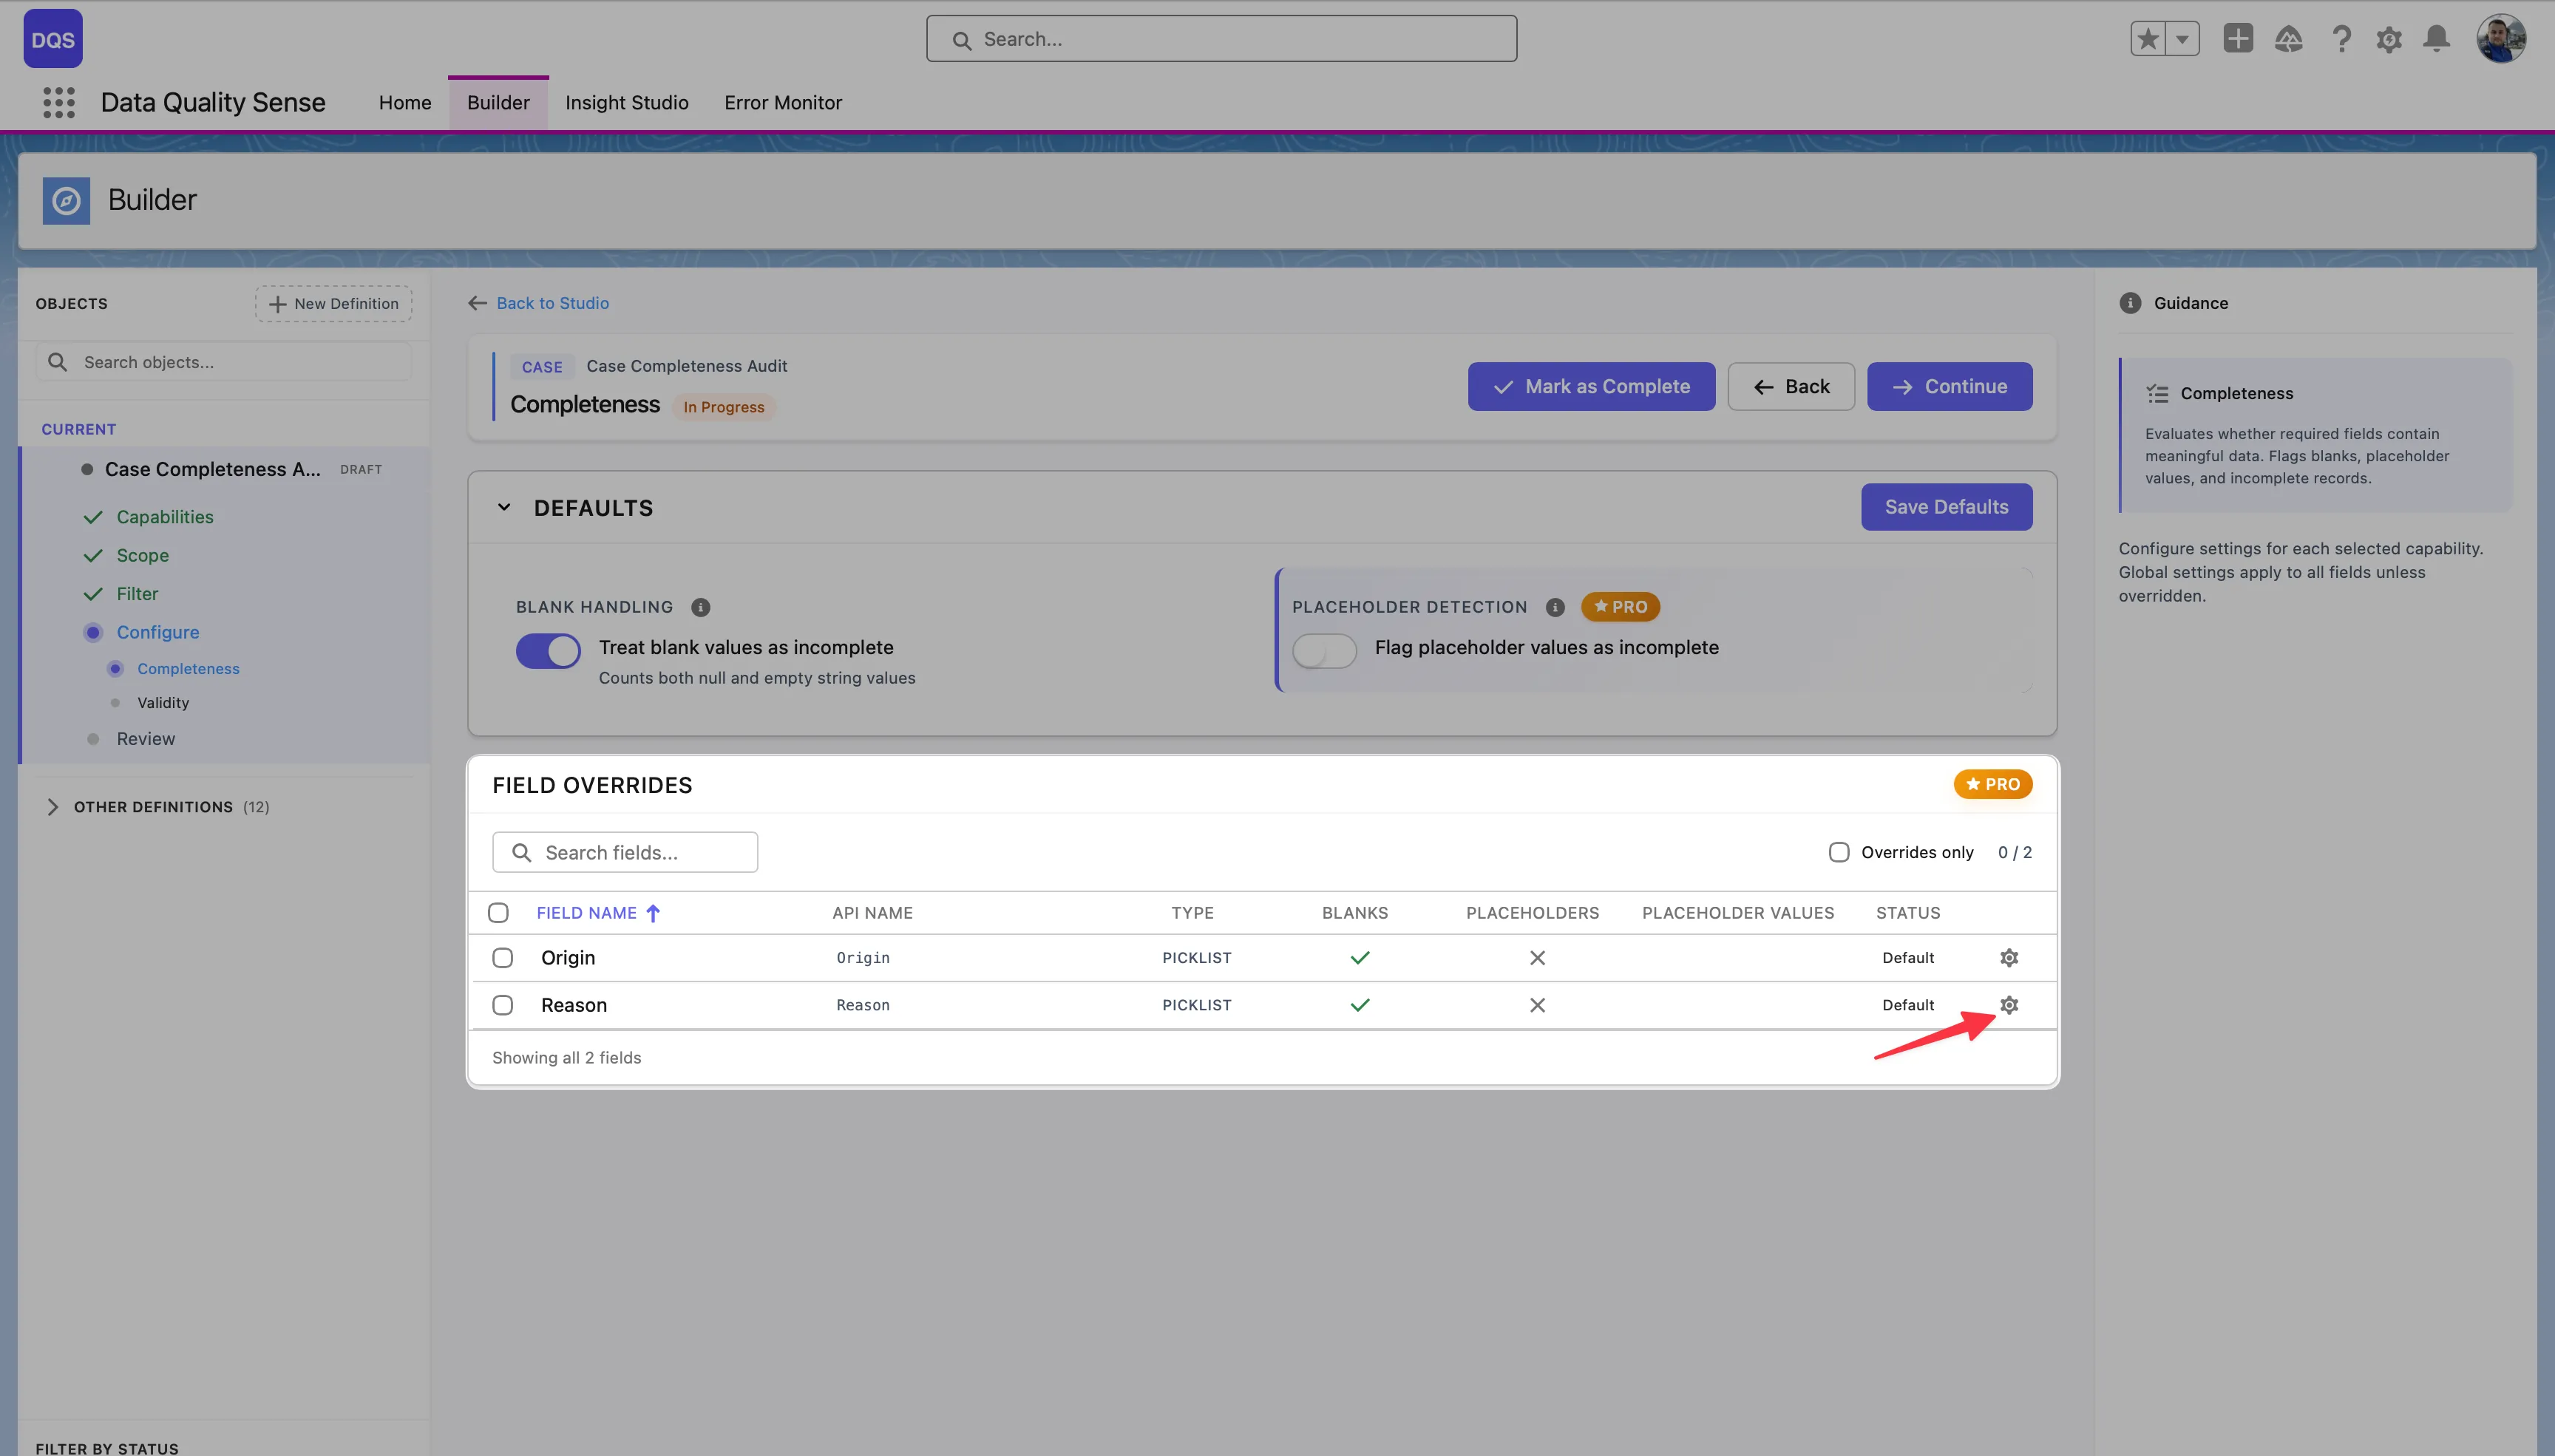
To override a specific field, click on it in the Field Overrides table. Its status changes to indicate a custom configuration. The red arrow below points to the Reason field after applying a per-field override.
Click the remove button on any enabled capability to disable it. This clears all global and per-field configurations for that capability. The action requires confirmation.
Every scan definition progresses through a series of stages:
Draft → Ready → Active → ObsoleteThe initial state when a definition is created. In Draft status:
A transitional state indicating the definition has been reviewed. In Ready status:
The operational state. In Active status:
The retired state. In Obsolete status:
Before a definition can be activated, DQS validates:
| Rule | Description |
|---|---|
| Fields selected | At least one field must be selected |
| Capabilities enabled | At least one capability must be enabled |
| Configuration complete | All required capability settings must be filled |
Data Quality Sense evaluates your data across 6 distinct quality dimensions (capabilities). Each dimension focuses on a different aspect of data quality and produces independent scores that roll up into an overall quality rating.
Completeness
Measures whether fields contain values. Detects null, blank, and missing data across your selected fields. Learn more →
Validity
Checks whether values conform to expected formats, ranges, and patterns. Supports picklist validation and regex matching. Learn more →
Uniqueness
Identifies duplicate values across records. Flags fields where unique values are expected but duplicates exist. Learn more →
Timeliness
Evaluates whether data is current and up-to-date. Measures freshness based on configurable time windows. Learn more →
Consistency
Checks logical consistency between related fields. Detects contradictions like a closed date before an open date. Learn more →
PII Detection
Scans for personally identifiable information in free-text fields. Helps with data privacy compliance. Learn more →
Each capability produces a score from 0 to 100 for every scanned field:
Scores are aggregated:
Not all capabilities apply to all field types. DQS automatically handles non-applicable combinations:
| Field Type | Completeness | Validity | Uniqueness | Timeliness | Consistency | PII Detection |
|---|---|---|---|---|---|---|
| Text | ✓ | ✓ | ✓ | — | ✓ | ✓ |
| Number | ✓ | ✓ | ✓ | — | ✓ | — |
| Date | ✓ | ✓ | — | ✓ | ✓ | — |
| Picklist | ✓ | ✓ | — | — | ✓ | — |
| Boolean | ✓ | — | — | — | ✓ | — |
| ✓ | ✓ | ✓ | — | — | ✓ | |
| Phone | ✓ | ✓ | ✓ | — | — | ✓ |
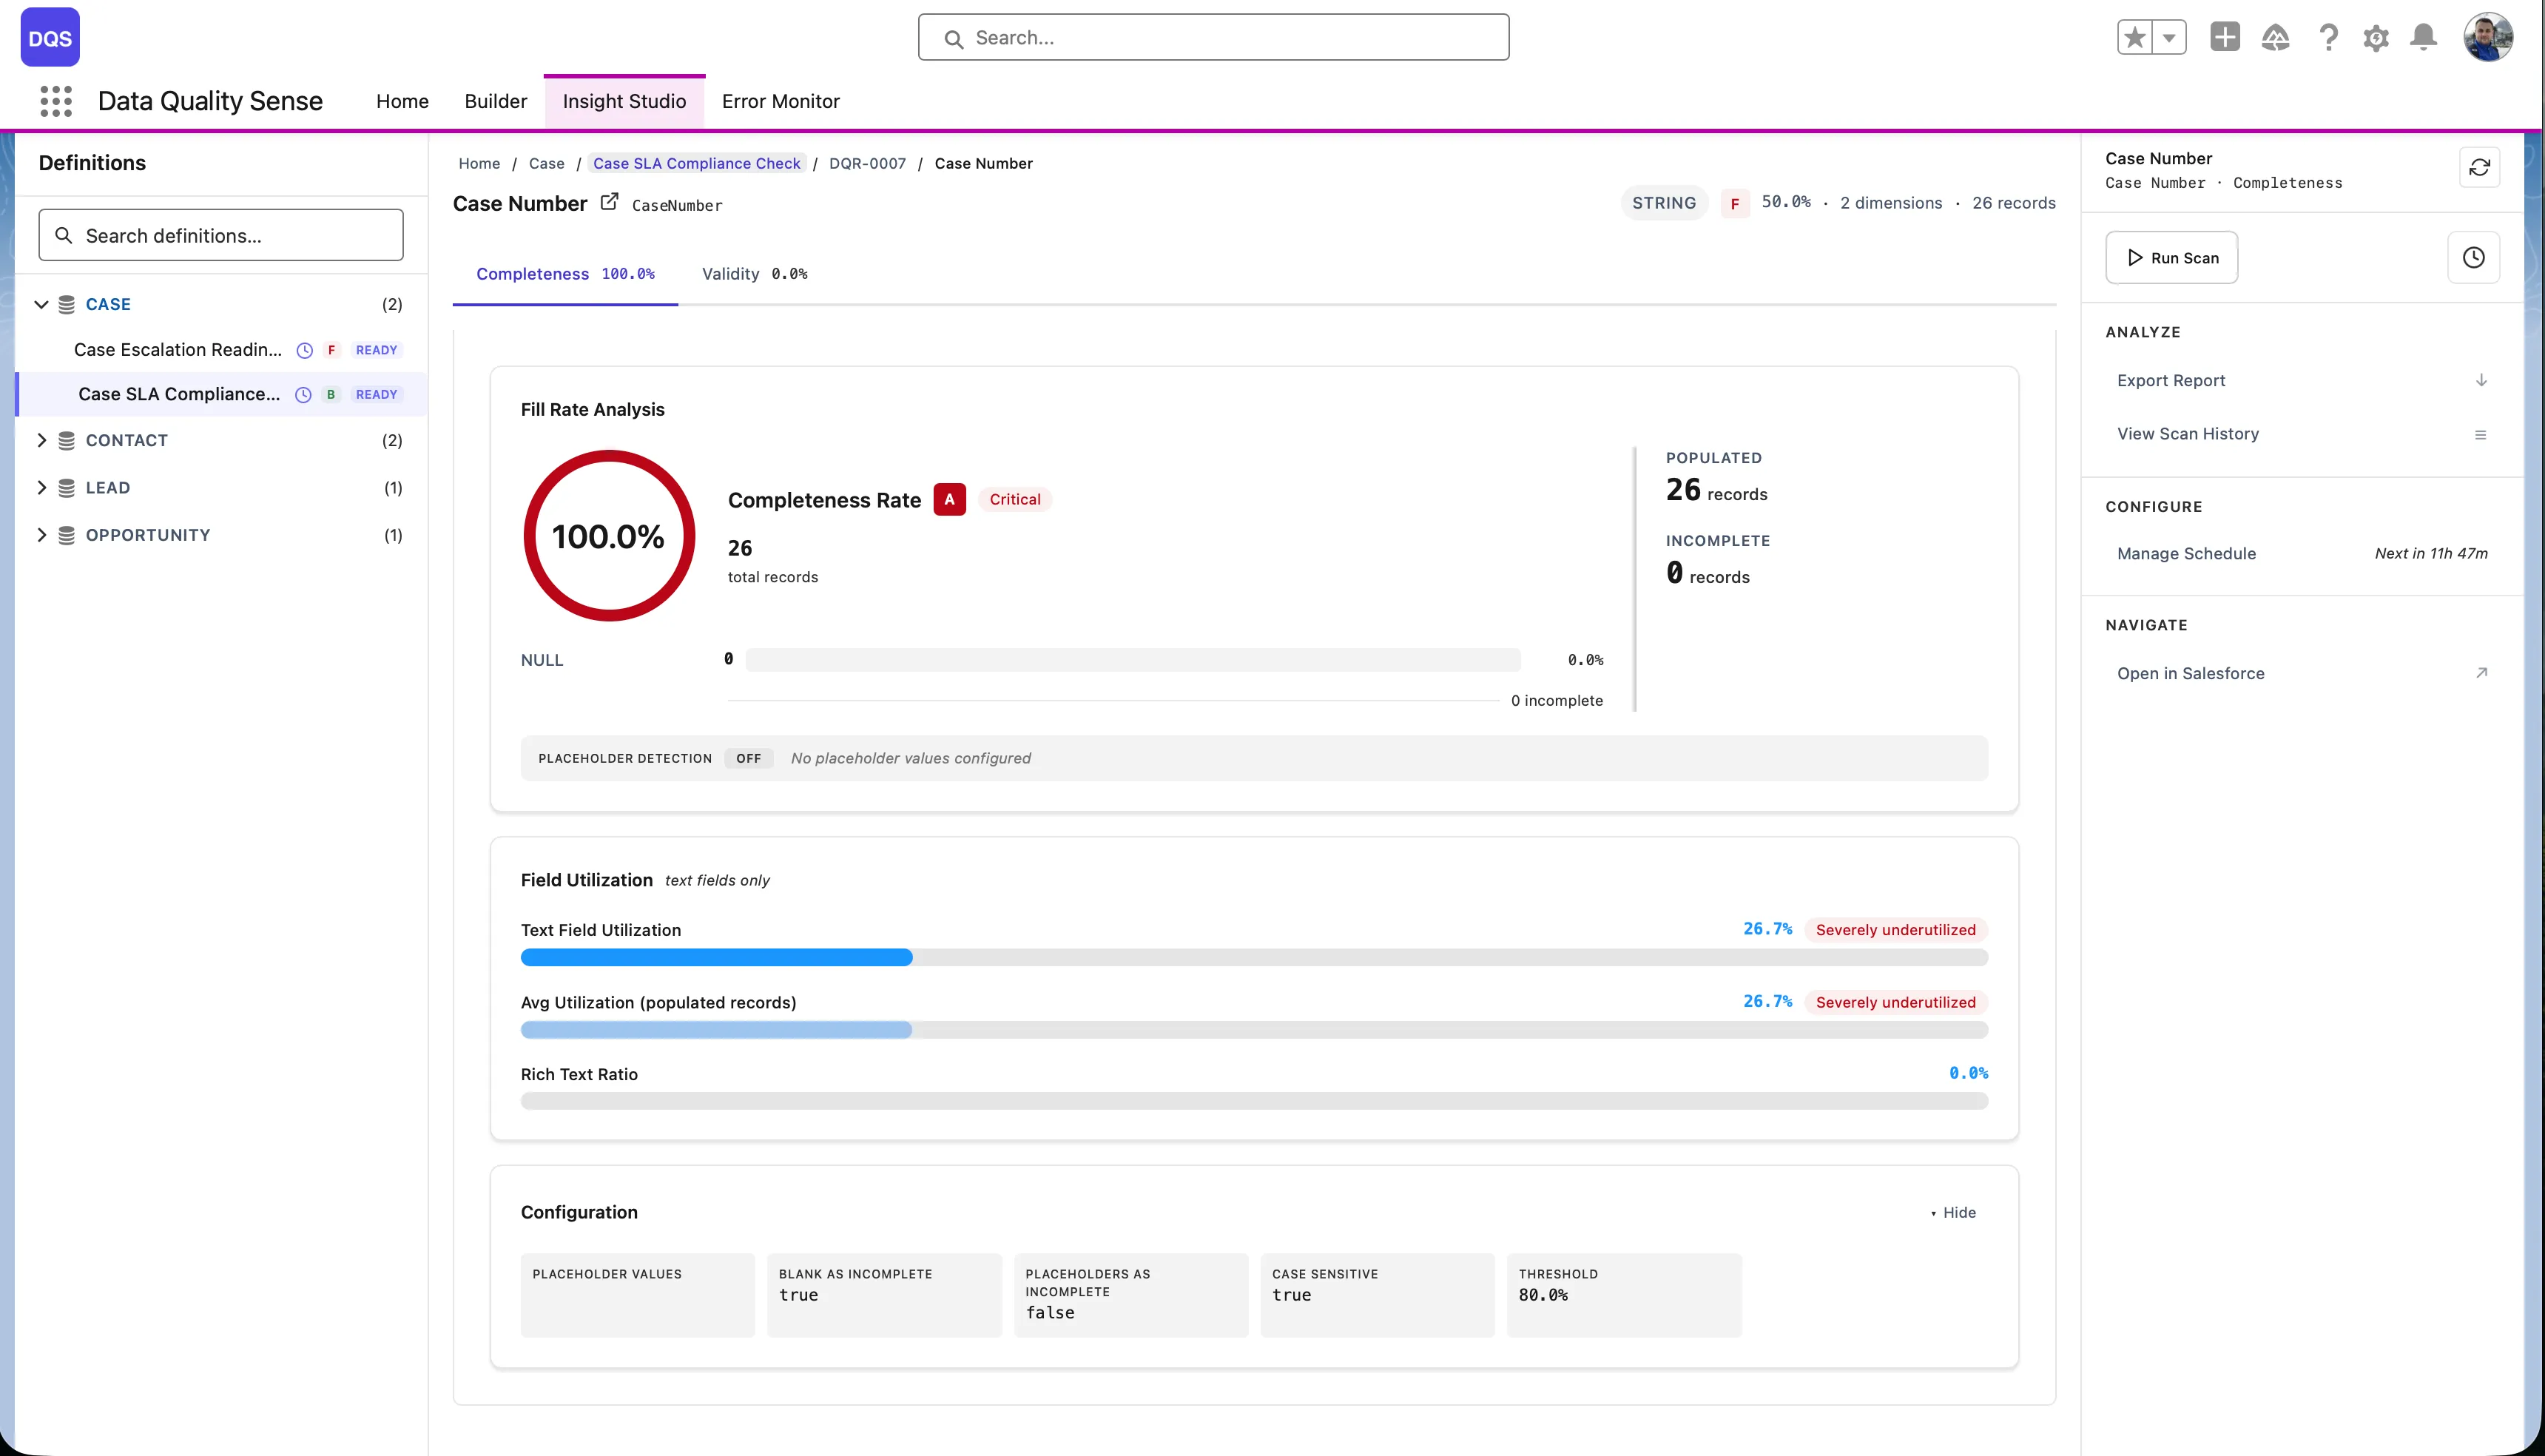
Completeness measures the fill rate of your fields — the percentage of records where a field contains a non-null, non-blank value.
For each field included in the scan, the Completeness strategy:
(populated records / total records) × 100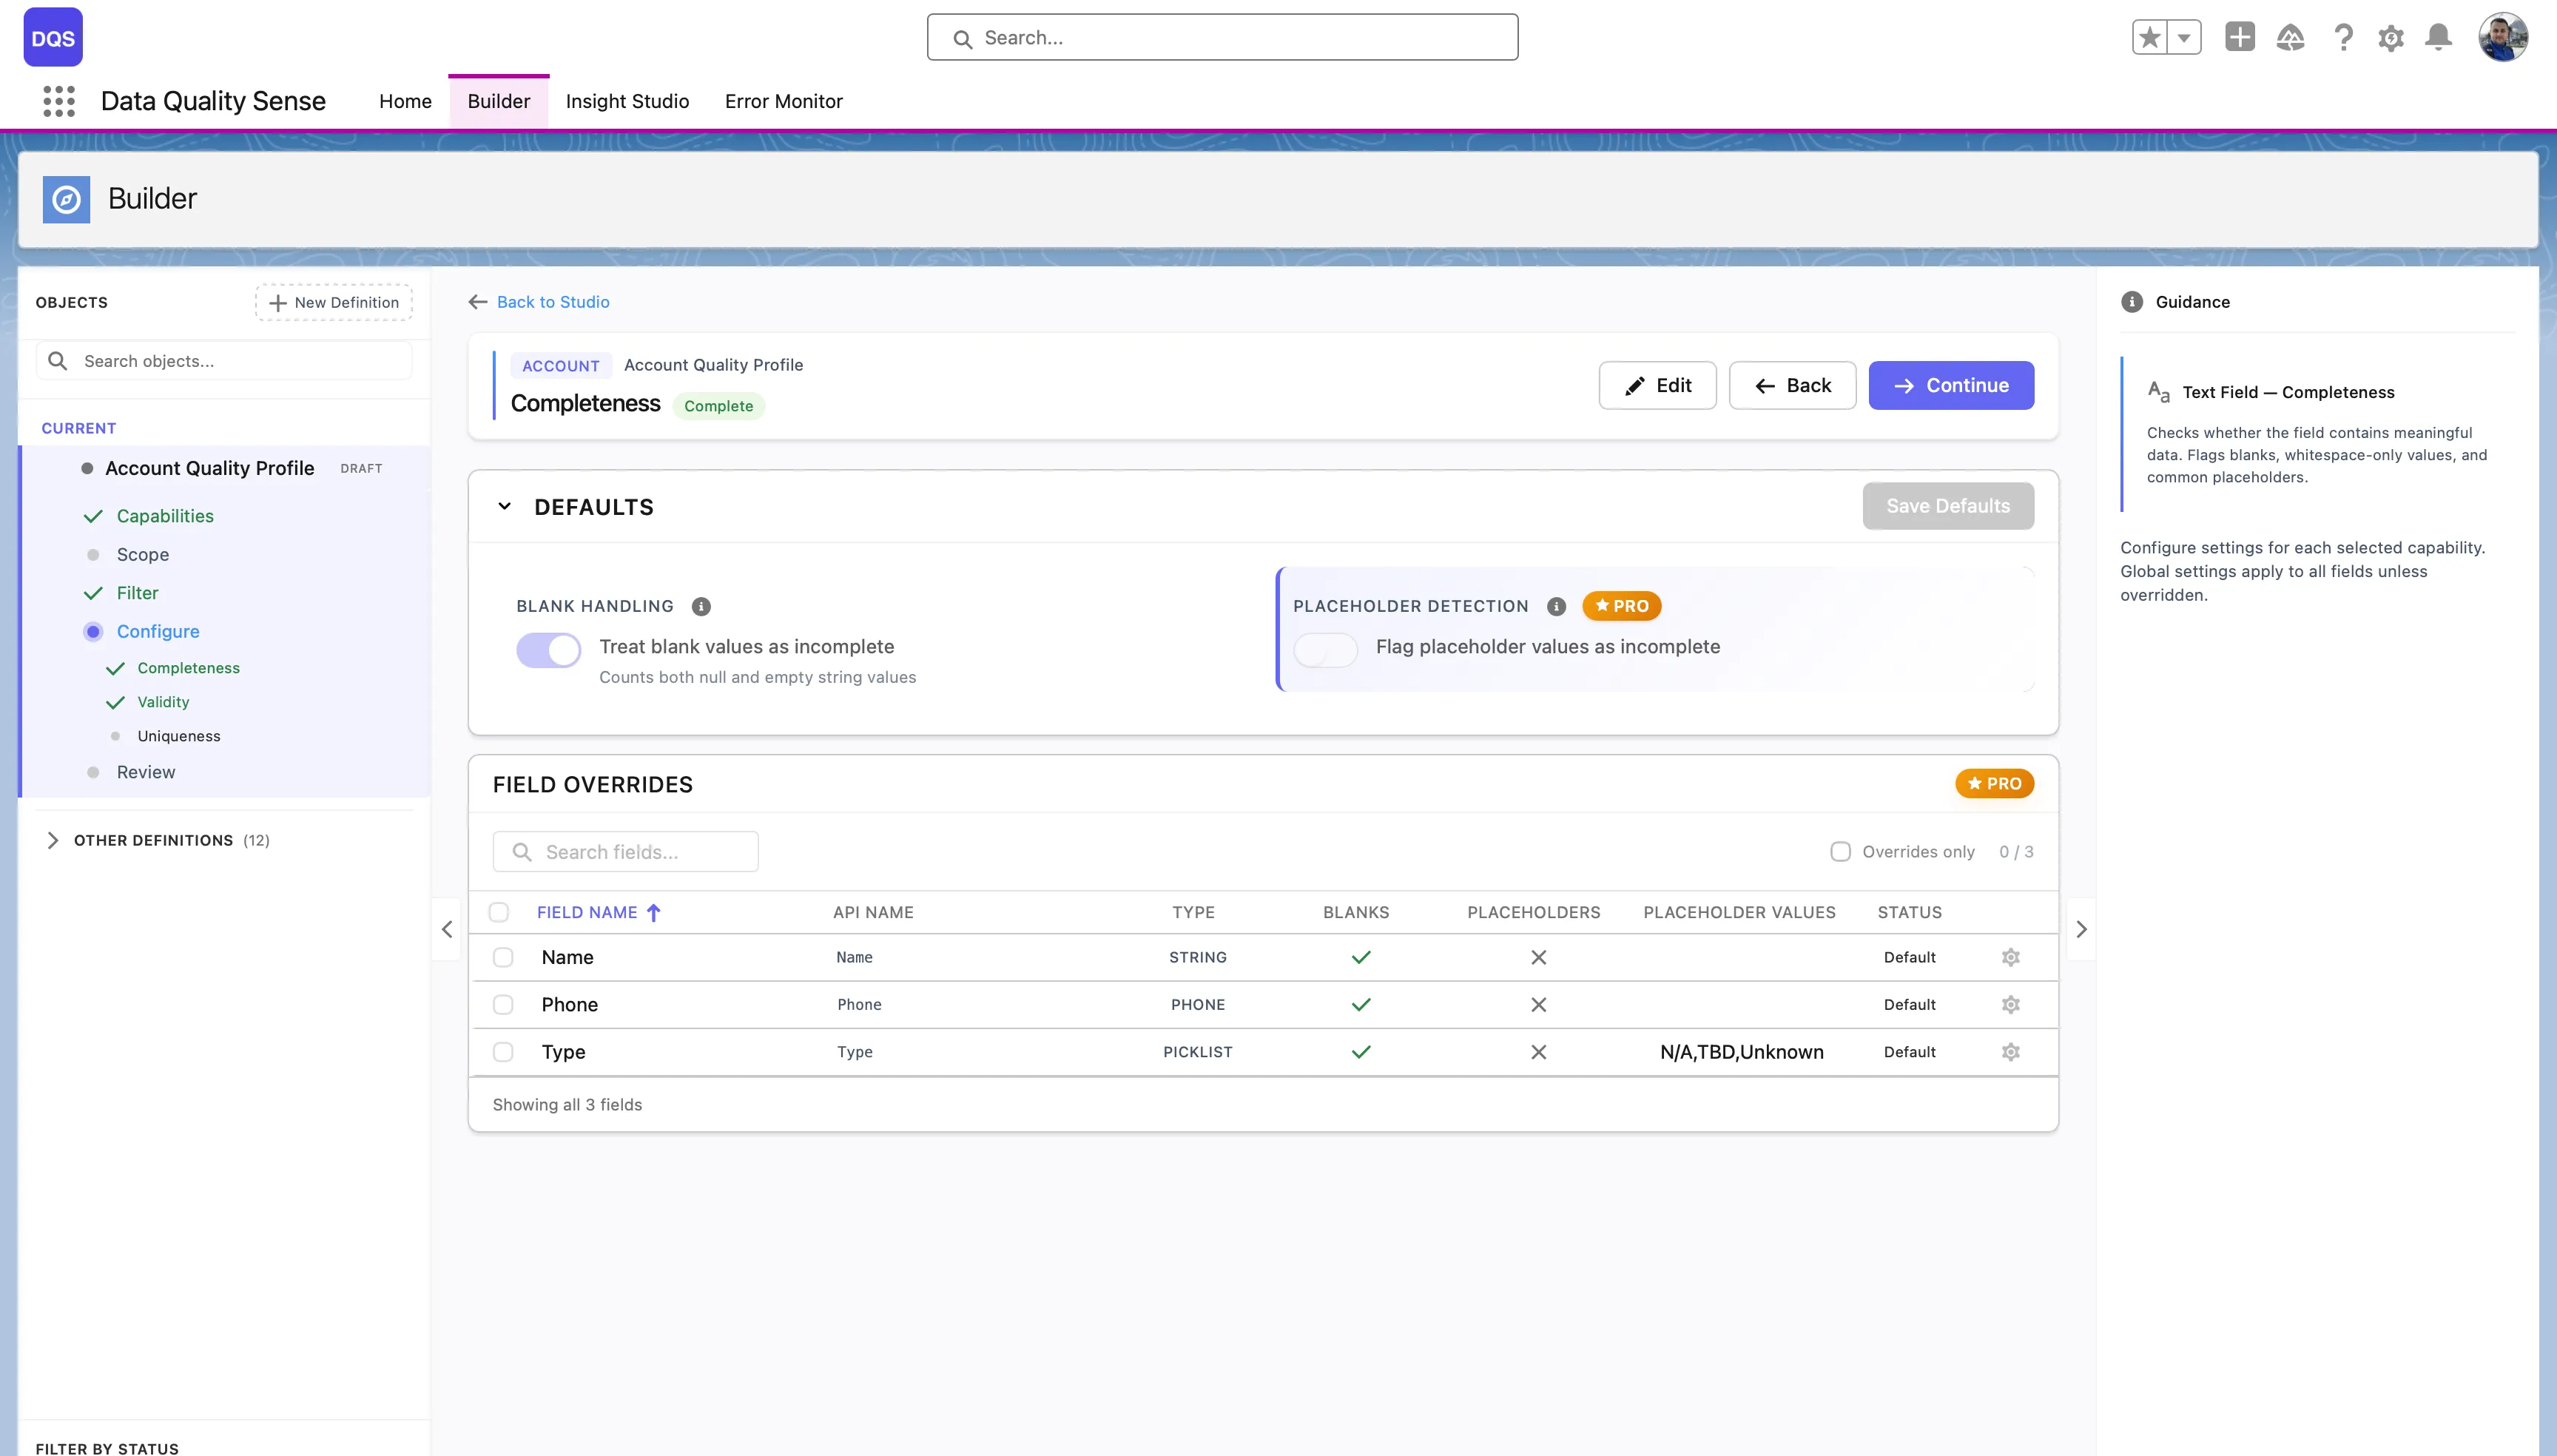
| Setting | Description | Default |
|---|---|---|
| Expected Fill Rate | The minimum acceptable percentage of populated records | 80% |
Override the expected fill rate for individual fields. Common overrides:
| Fill Rate | Score |
|---|---|
| ≥ Expected | 100 |
| Below expected | Proportional (e.g., 70% fill with 80% target = 87.5 score) |
| 0% | 0 |
Use the Bulk Config option to set the same fill rate override across multiple fields at once — useful when you have many fields that share the same completeness requirement.
Validity measures whether field values conform to expected formats, ranges, and patterns. A field can be populated (complete) but still contain invalid data — Validity catches these issues.
The Validity strategy evaluates each field value against expected rules:
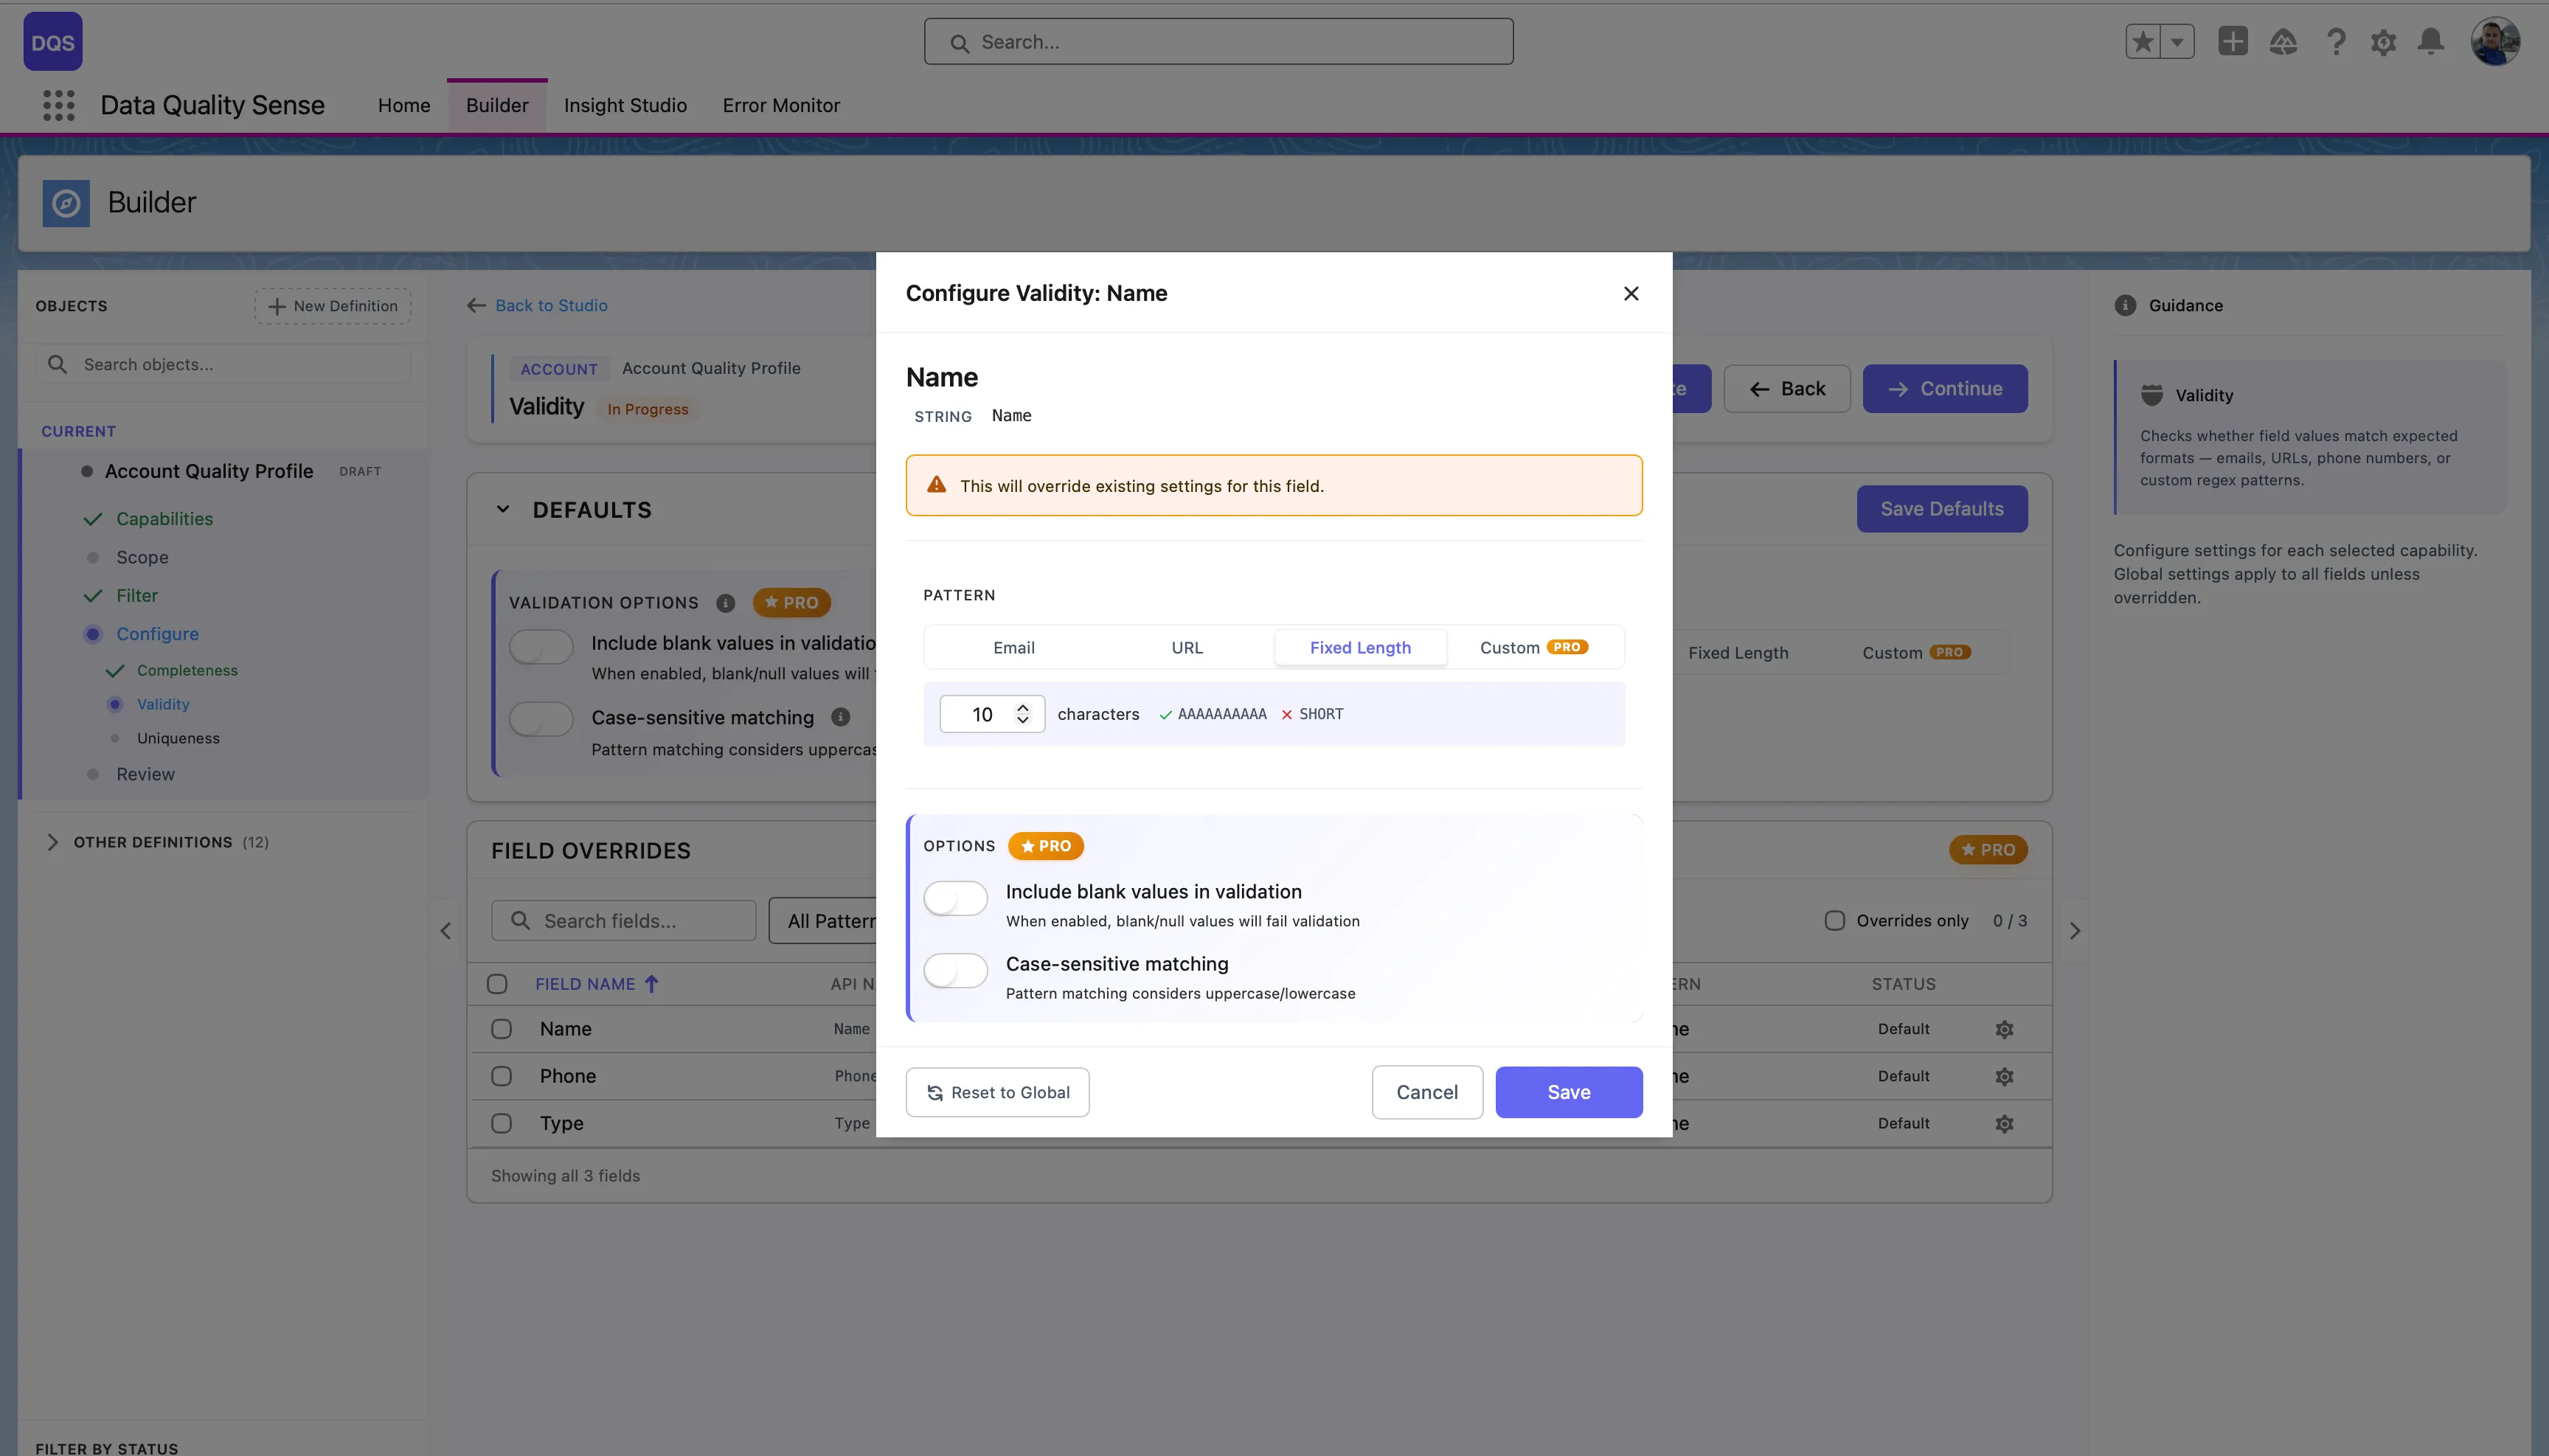
The Defaults section controls global validation options that apply to all fields:
| Setting | Description |
|---|---|
| Include blank values in validation | When enabled, blank/null values will fail validation |
| Case-sensitive matching | Pattern matching considers uppercase/lowercase |
| Pattern Selection | Choose a default validation pattern (Email, URL, Fixed Length, or Custom regex) |
The Field Overrides table below lists each field in scope with its current pattern and status. Fields marked “Default” use the global settings, “None” means no pattern is assigned yet.
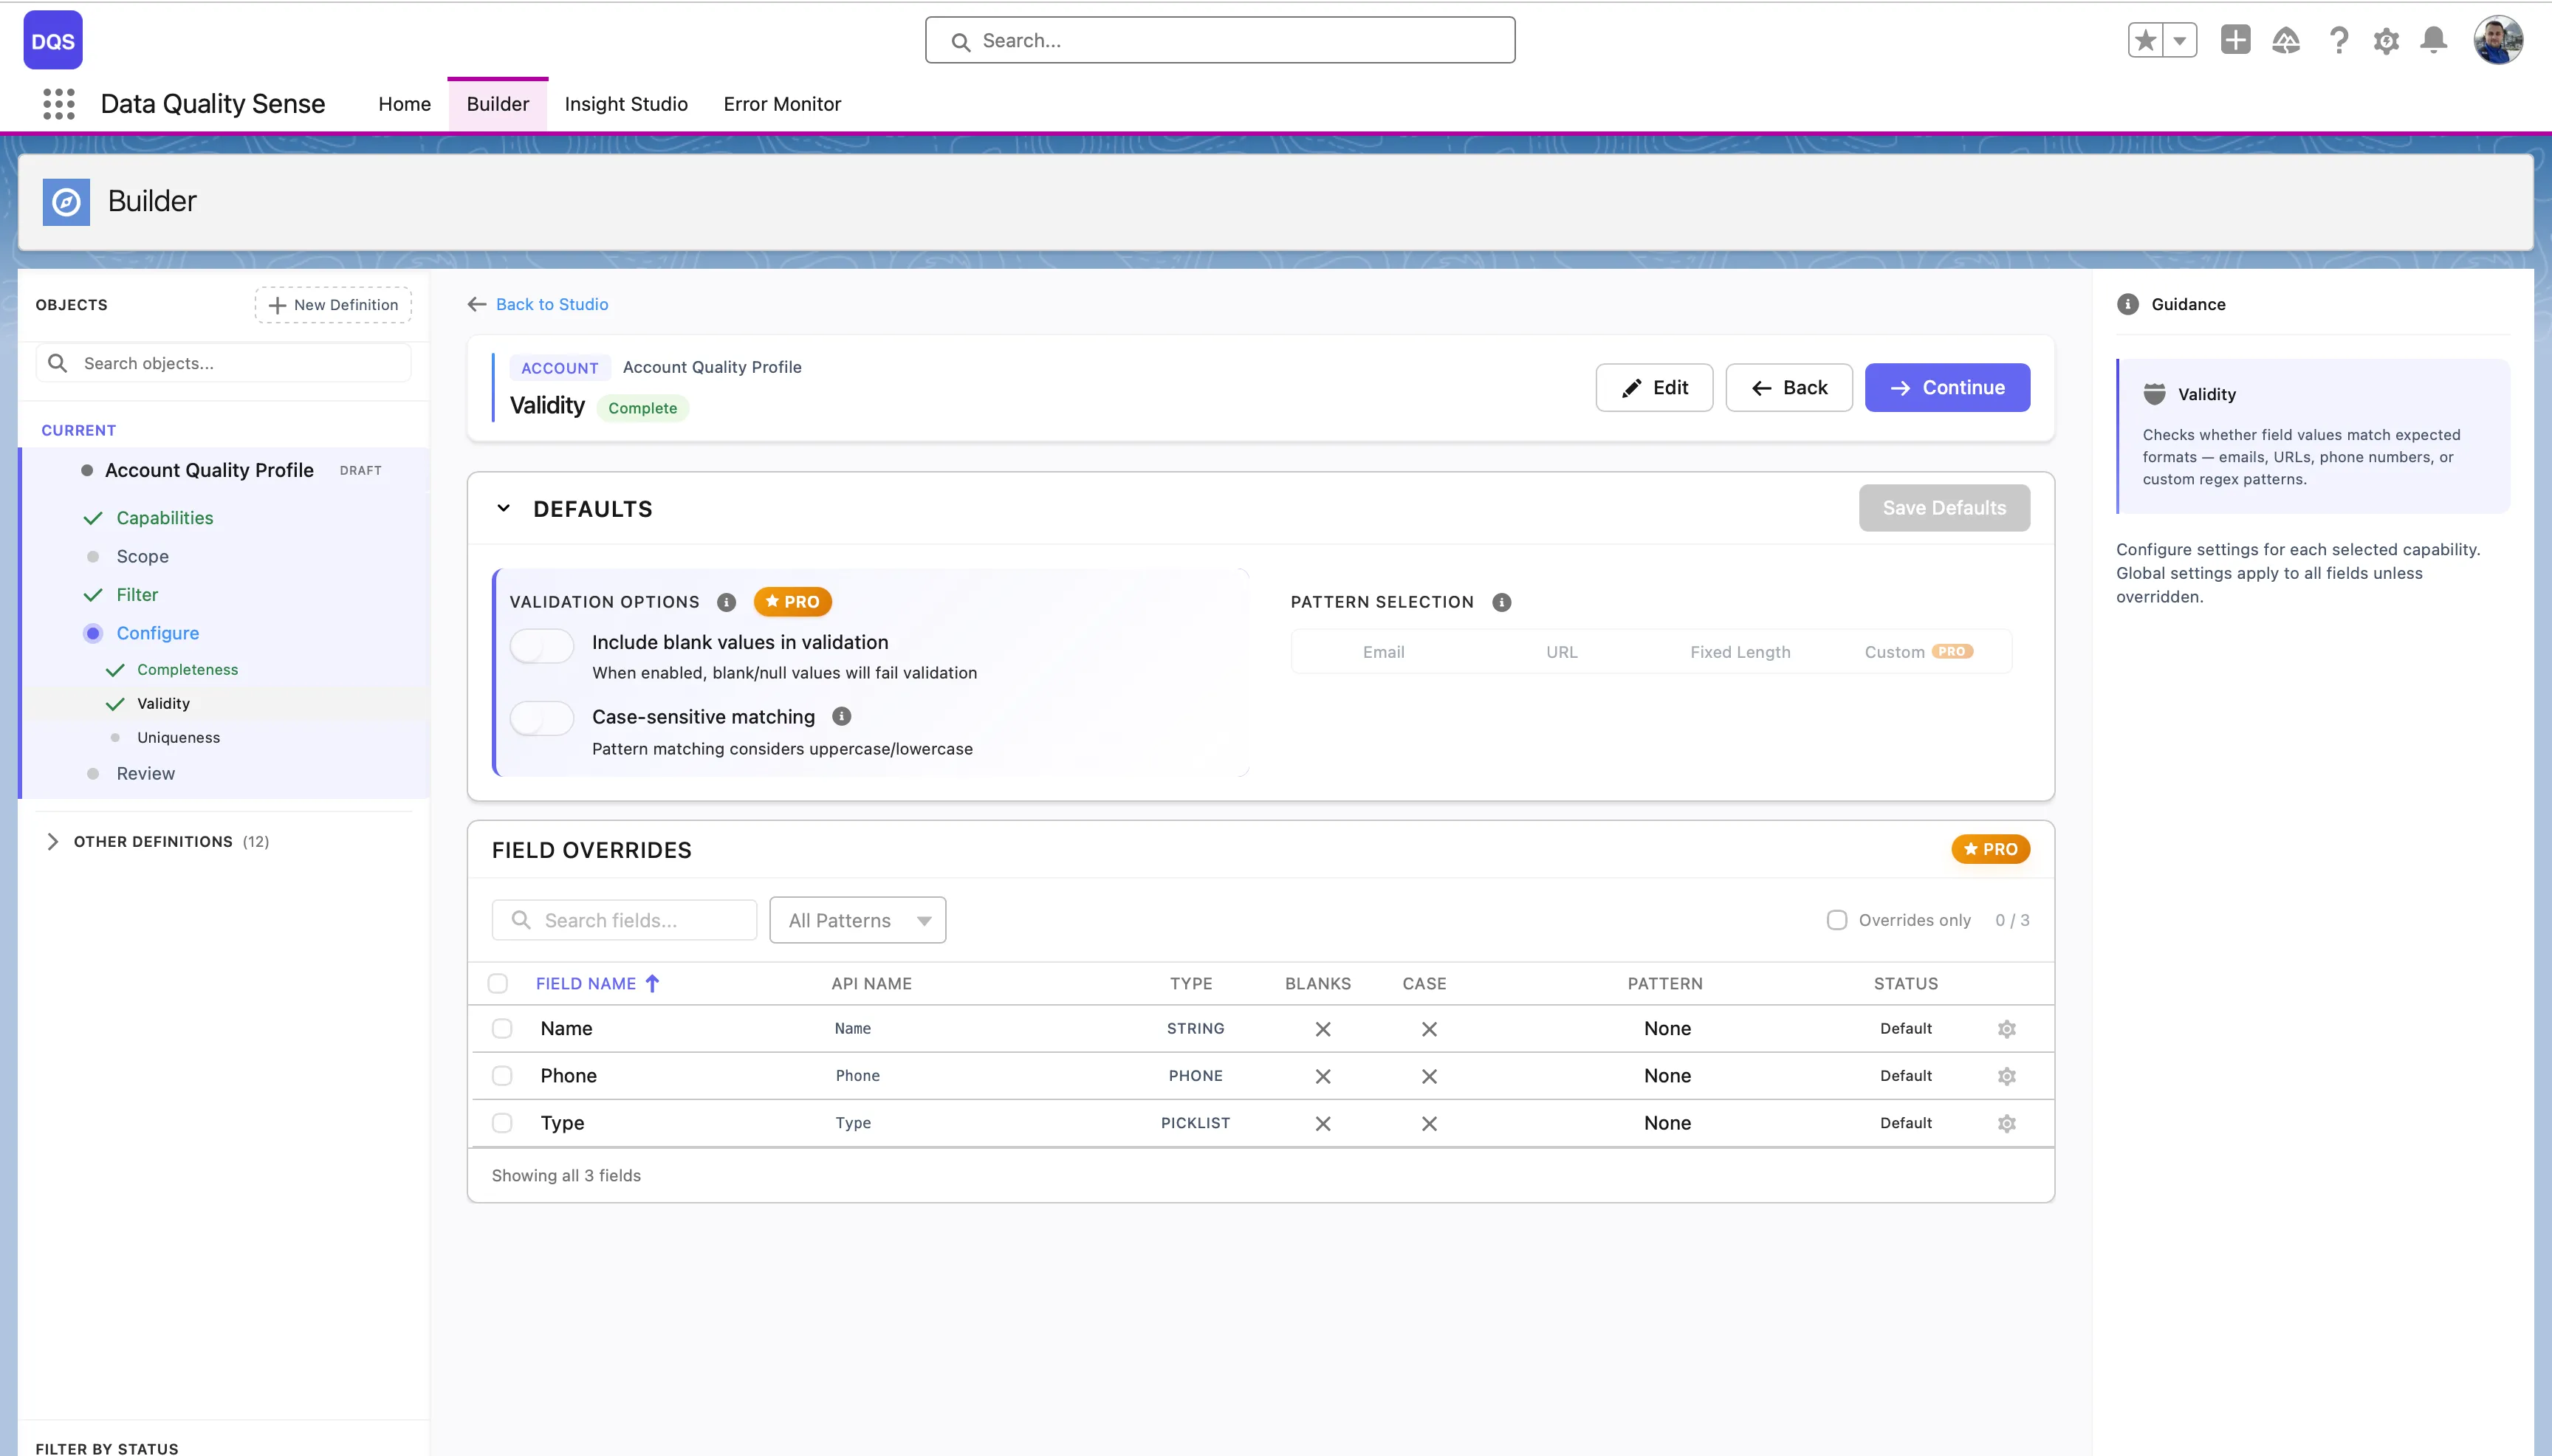
Click on a field in the Field Overrides table to open its configuration modal. Here you can assign a specific validation pattern for that field — choose from predefined patterns (Email, URL, Fixed Length) or select Custom to enter your own regex. Each field override also lets you toggle Include blank values and Case-sensitive matching independently from the global defaults. Use the Revert to Global link to reset the field back to the global settings.
| Result | Score |
|---|---|
| All values valid | 100 |
| Some invalid | Proportional to valid percentage |
| All invalid | 0 |
| No data | 0 |
DQS uses Java-compatible regular expressions for text field validation. When you select Custom in the pattern picker, a text field appears where you can enter your own regex pattern.
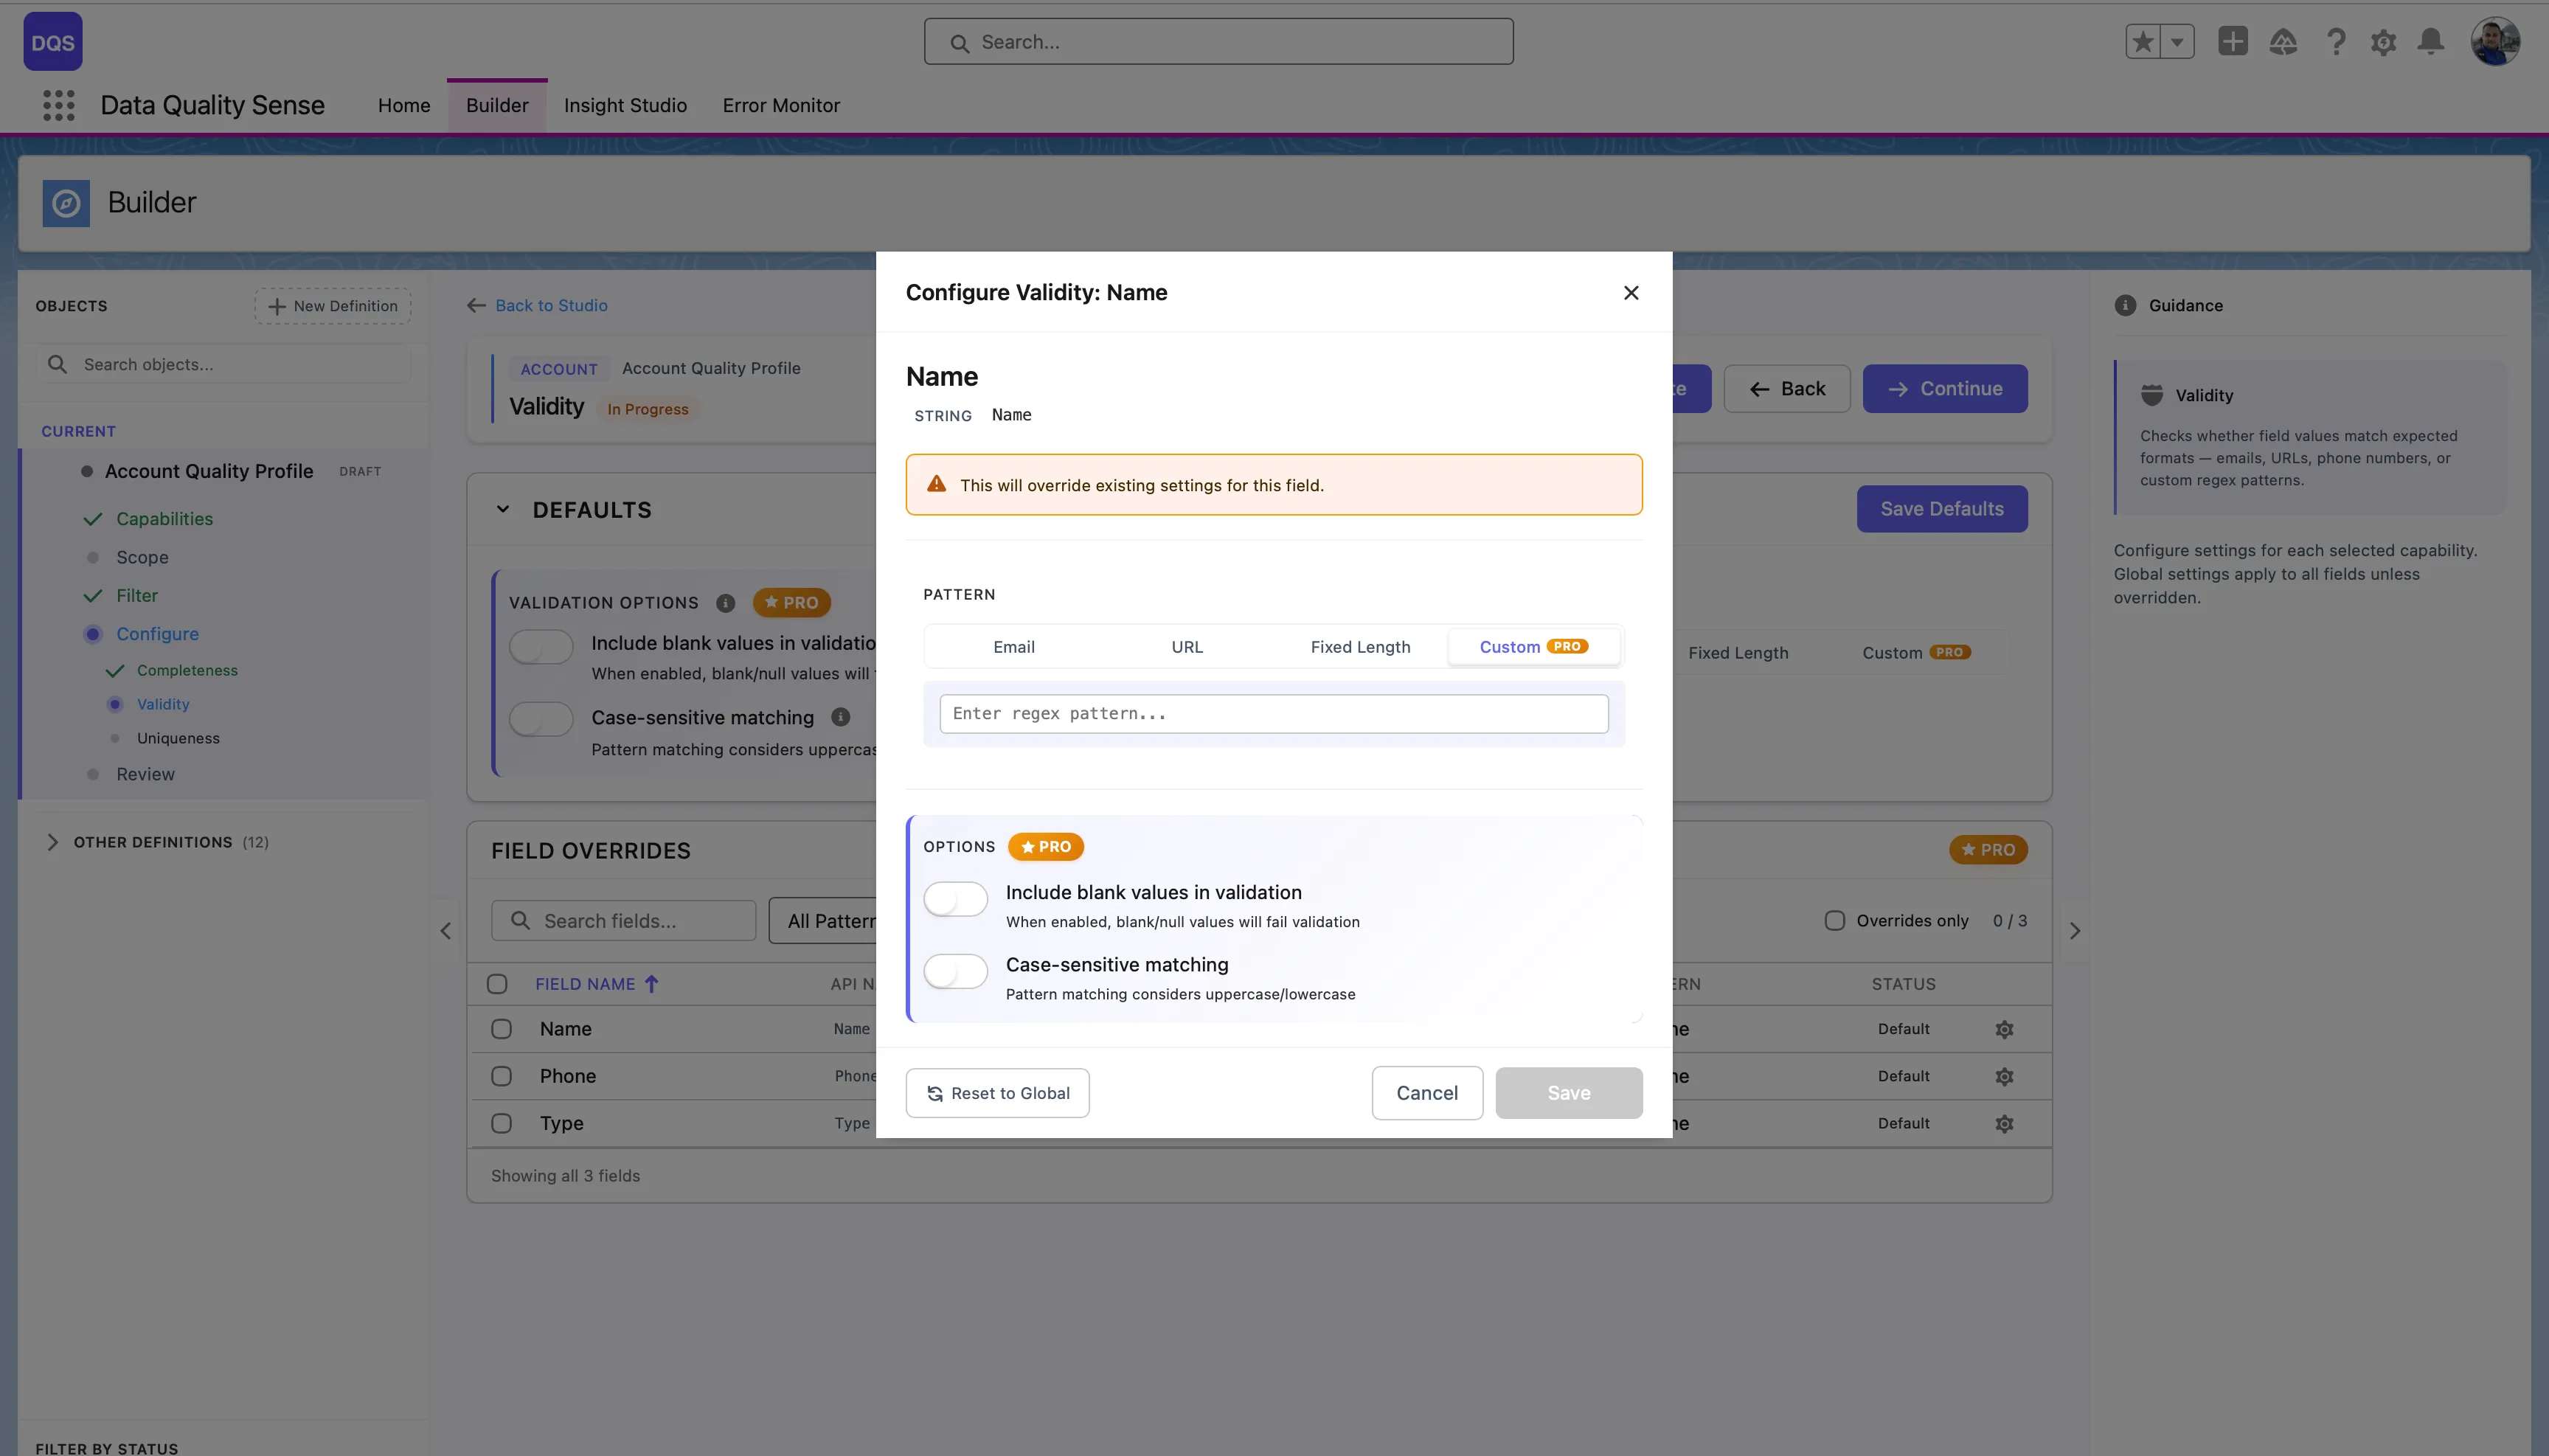
See the Regex Tester for an interactive tester and a library of ready-to-use patterns for email, phone, URL, postal codes, and more.
Uniqueness measures whether field values are distinct across records. High uniqueness means each record has a different value for the field — low uniqueness indicates duplicates.
For each field, the Uniqueness strategy:
(unique values / total populated values) × 100The Defaults section controls global uniqueness options:
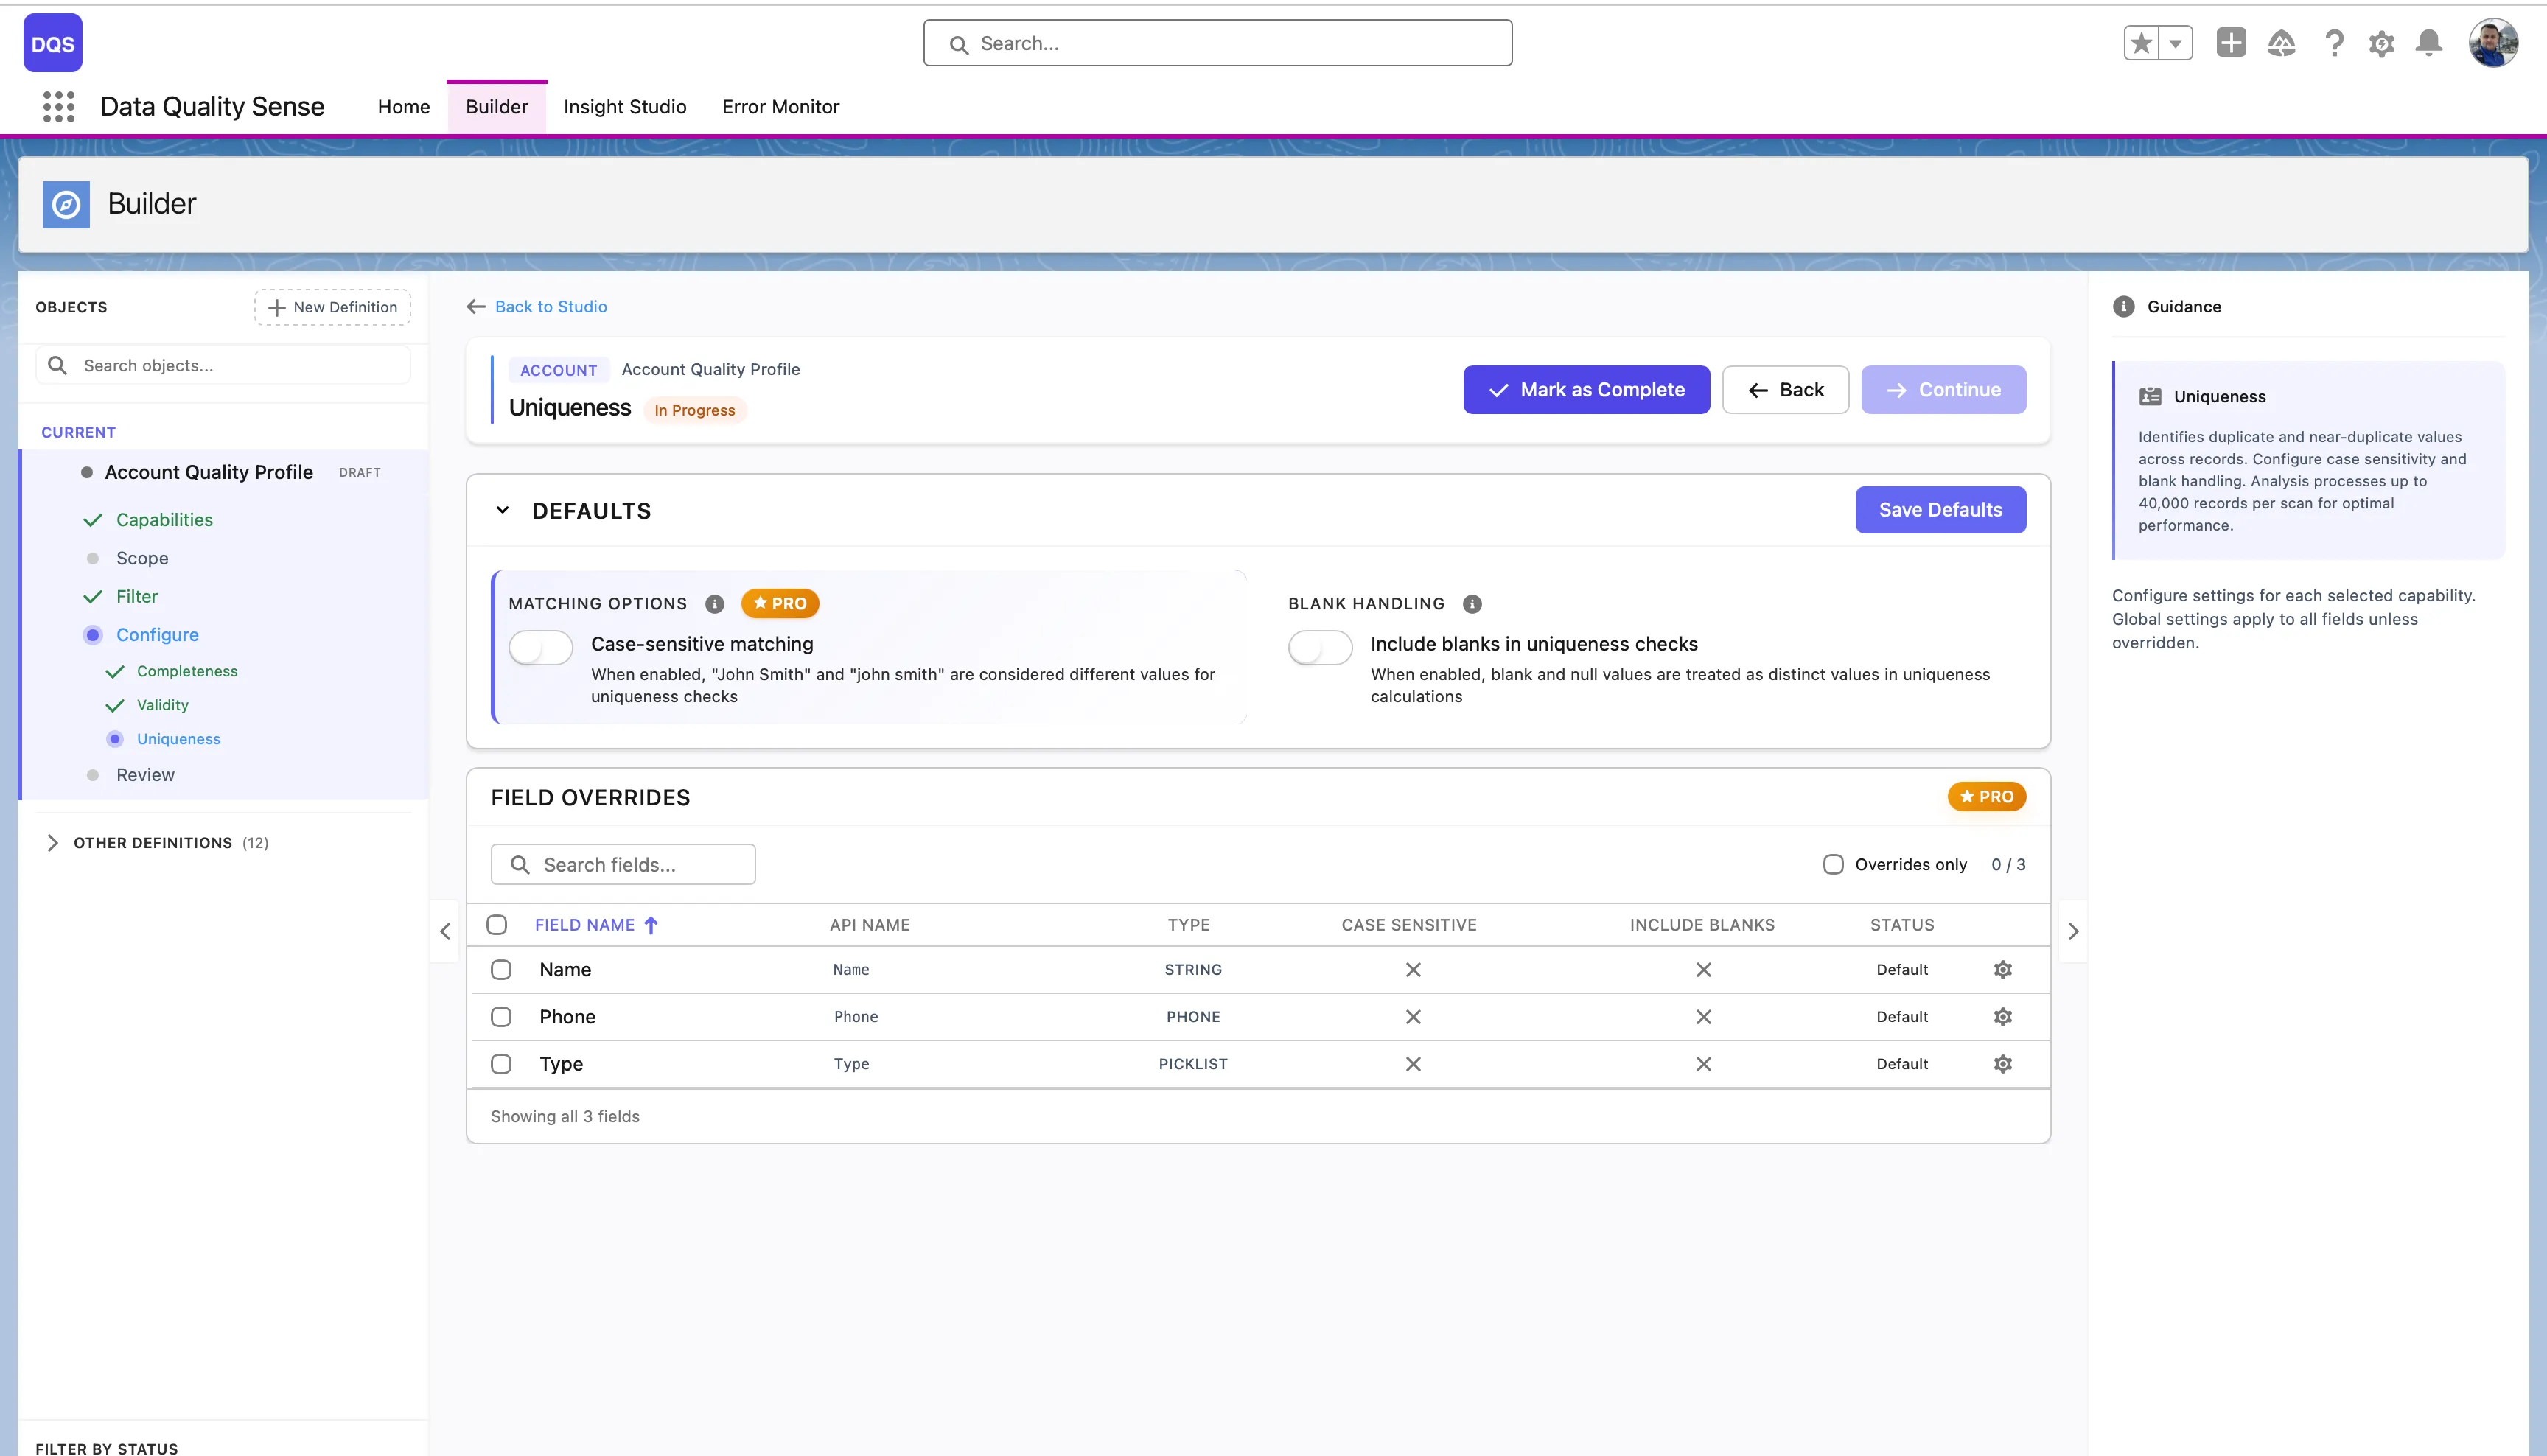
| Setting | Description |
|---|---|
| Case-sensitive matching | When enabled, “John Smith” and “john smith” are considered different values for comparison. When disabled, they count as duplicates. |
| Include blanks in uniqueness checks | When enabled, blank and null values are treated as distinct values in comparison calculations. |
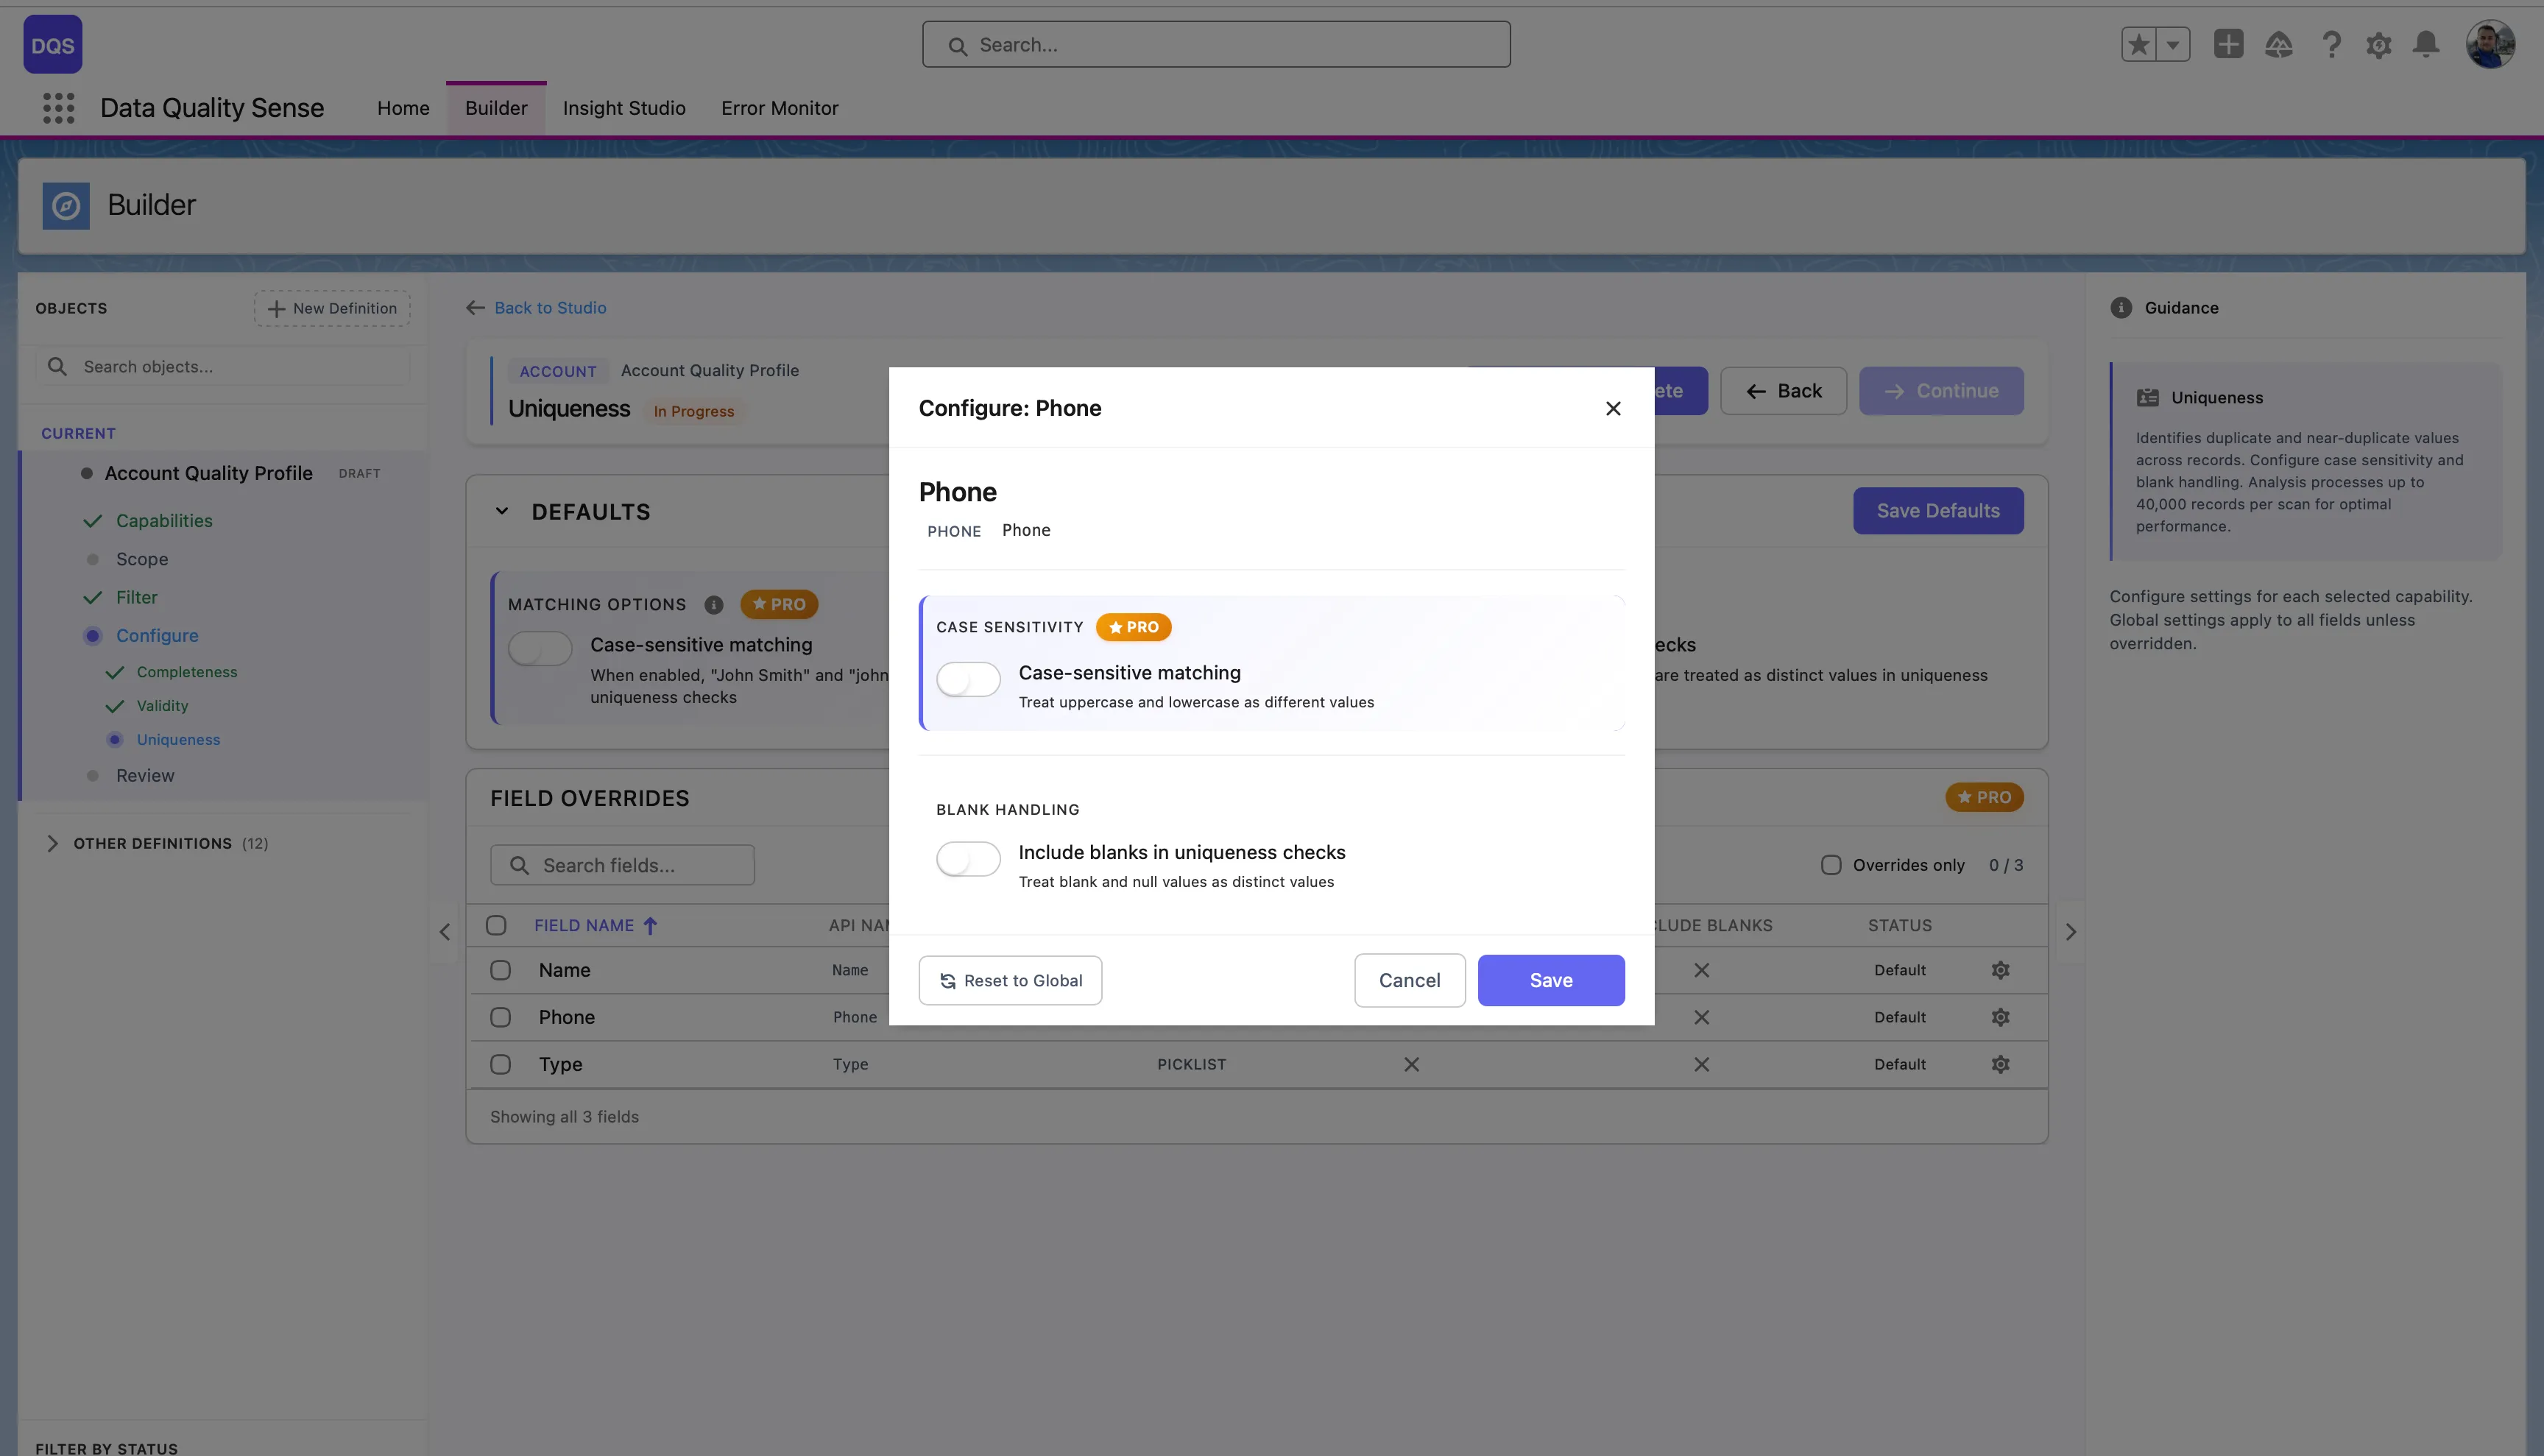
The Field Overrides table below lists each field with its current Case Sensitive, Include Blanks settings, and status.
Click on a field in the Field Overrides table to open its configuration modal. You can toggle Case-sensitive matching and Include blanks in uniqueness checks independently from the global defaults. Use the Revert to Global link to reset the field back to global settings.
| Result | Score |
|---|---|
| All values unique | 100 |
| Some duplicates | Proportional to unique percentage |
| All values identical | Near 0 |
| No data | 0 |
Uniqueness analysis processes up to 40,000 records per scan. For objects with more records, results reflect a representative sample. This limit exists to prevent Salesforce heap memory overflow, since the engine builds an in-memory map of value counts per field. Fields that exceed 40,000 distinct values are flagged as high cardinality fields.
Uniqueness is most meaningful for:
Less meaningful for:
Timeliness measures whether date and datetime fields contain recent, up-to-date values. It answers the question: “Is this data still fresh?”
For each date field, the Timeliness strategy:
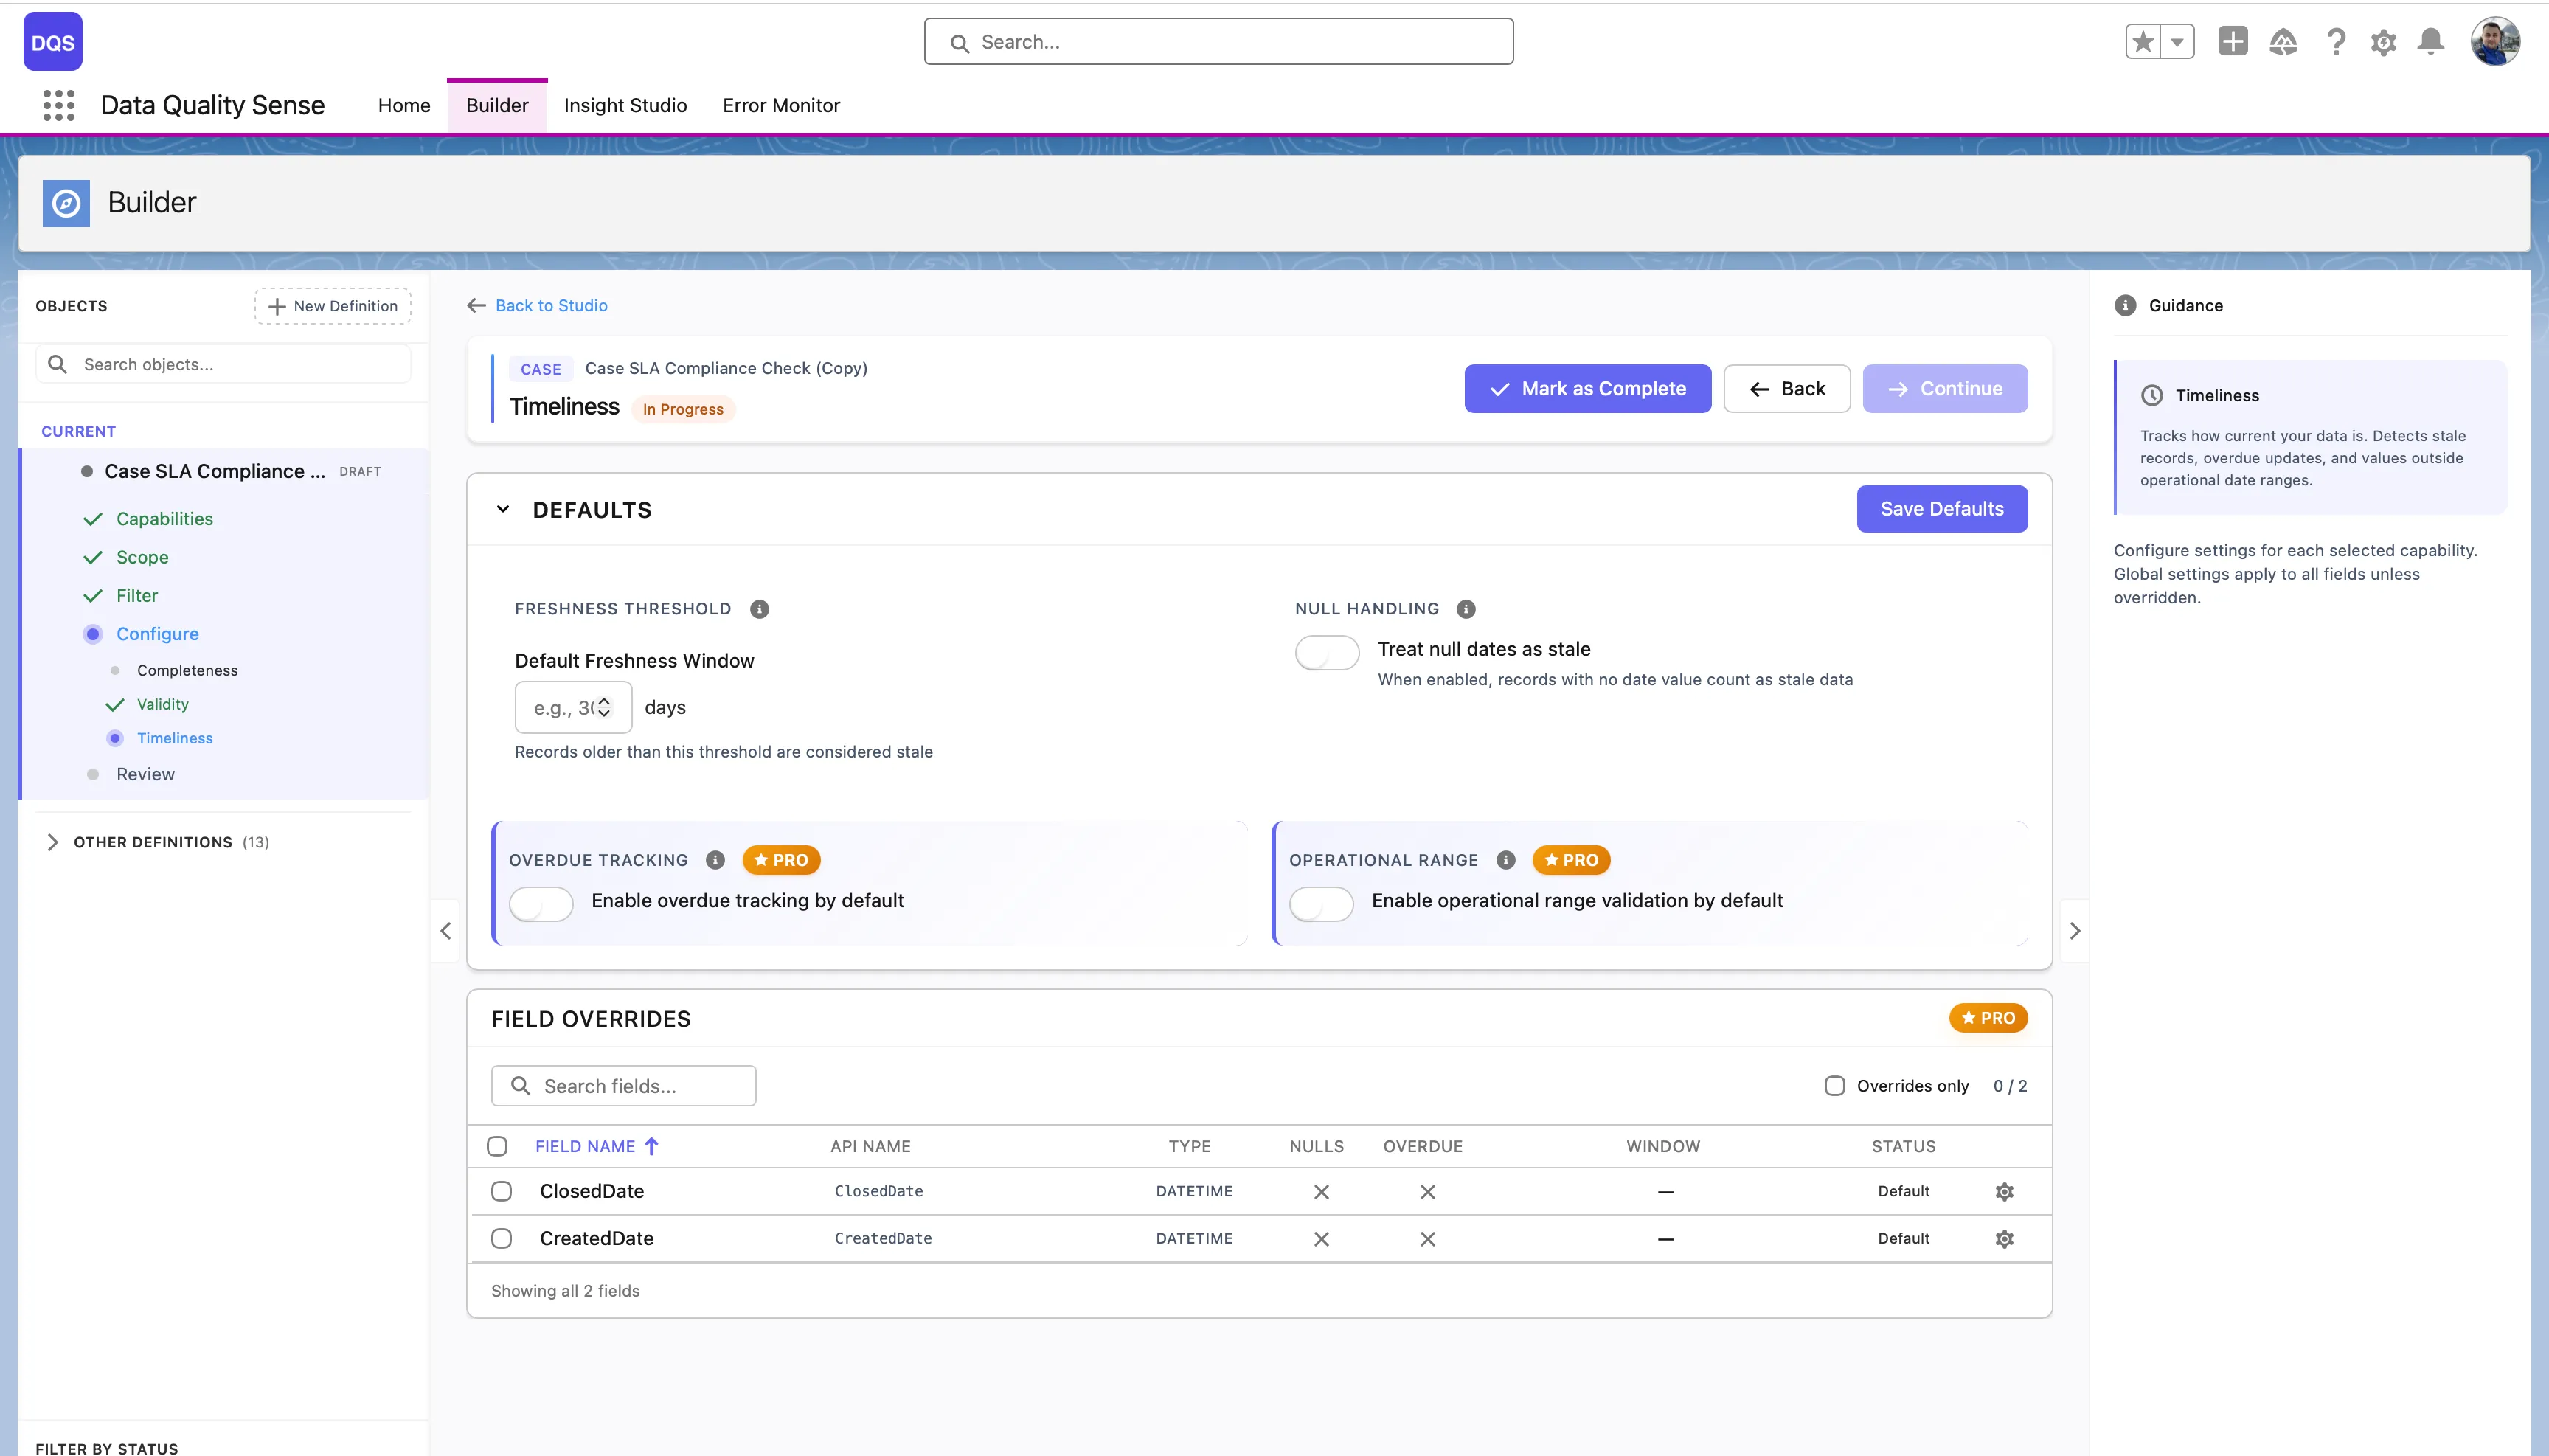
The Defaults section controls global timeliness options:
| Setting | Description |
|---|---|
| Freshness Threshold | The Default Freshness Window in days — records older than this threshold are considered stale. |
| Null Handling | Treat null dates as stale — when enabled, records with no date value count as stale data. |
| Overdue Tracking | Enable overdue tracking by default. Flags records past their expected date. (PRO) |
| Operational Range | Enable operational range validation by default. Checks whether dates fall within an acceptable time span. (PRO) |
The Field Overrides table lists each date field with its current threshold, overdue, and window settings.
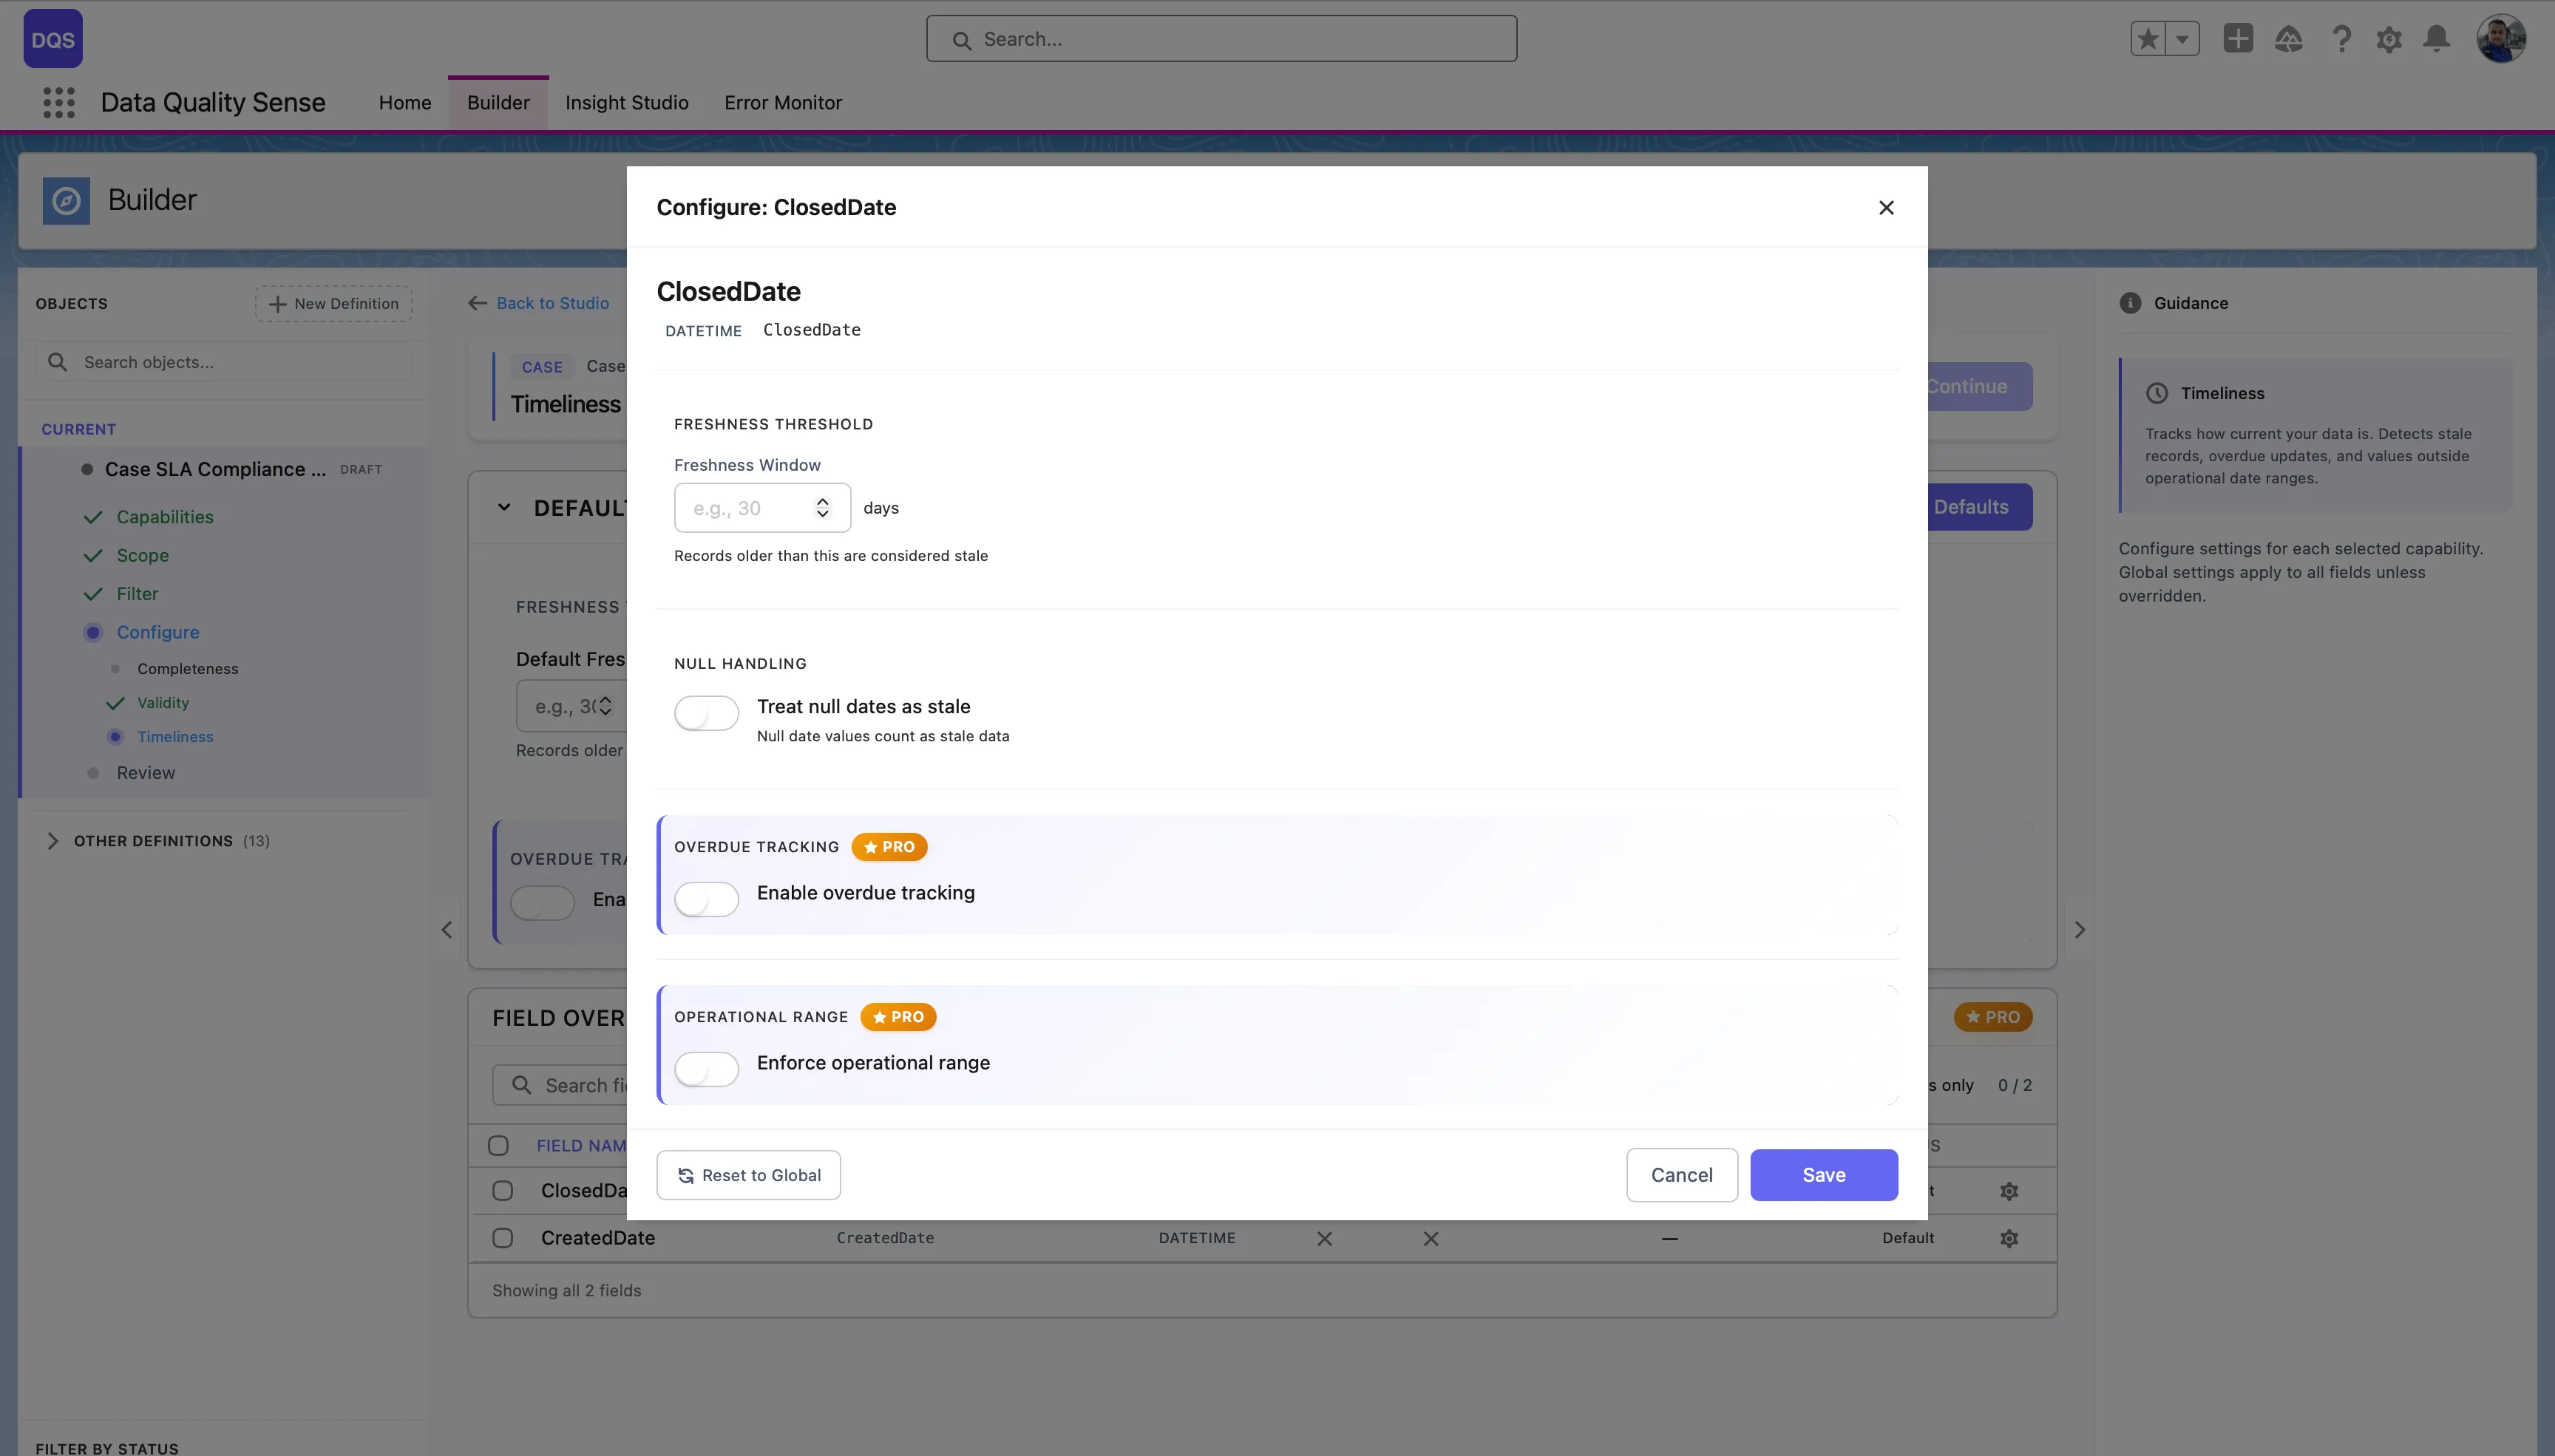
Click on a field in the Field Overrides table to open its configuration modal. You can set a custom Freshness Threshold (in days), toggle Null Handling, Overdue Tracking, and Operational Range independently from the global defaults. Use the Revert to Global link to reset the field back to global settings.
Different date fields may have different freshness requirements:
| Field Example | Recommended Window |
|---|---|
LastActivityDate | 7 days |
LastModifiedDate | 30 days |
Contract_End_Date__c | 90 days |
Annual_Review_Date__c | 365 days |
| Result | Score |
|---|---|
| All dates within window | 100 |
| Some stale dates | Proportional to fresh percentage |
| All dates stale | 0 |
| No data | 0 |
Consistency measures whether related fields contain logically compatible values. Data can be complete and valid individually, but still be inconsistent when fields contradict each other.
The Consistency strategy evaluates relationships between pairs or groups of fields:
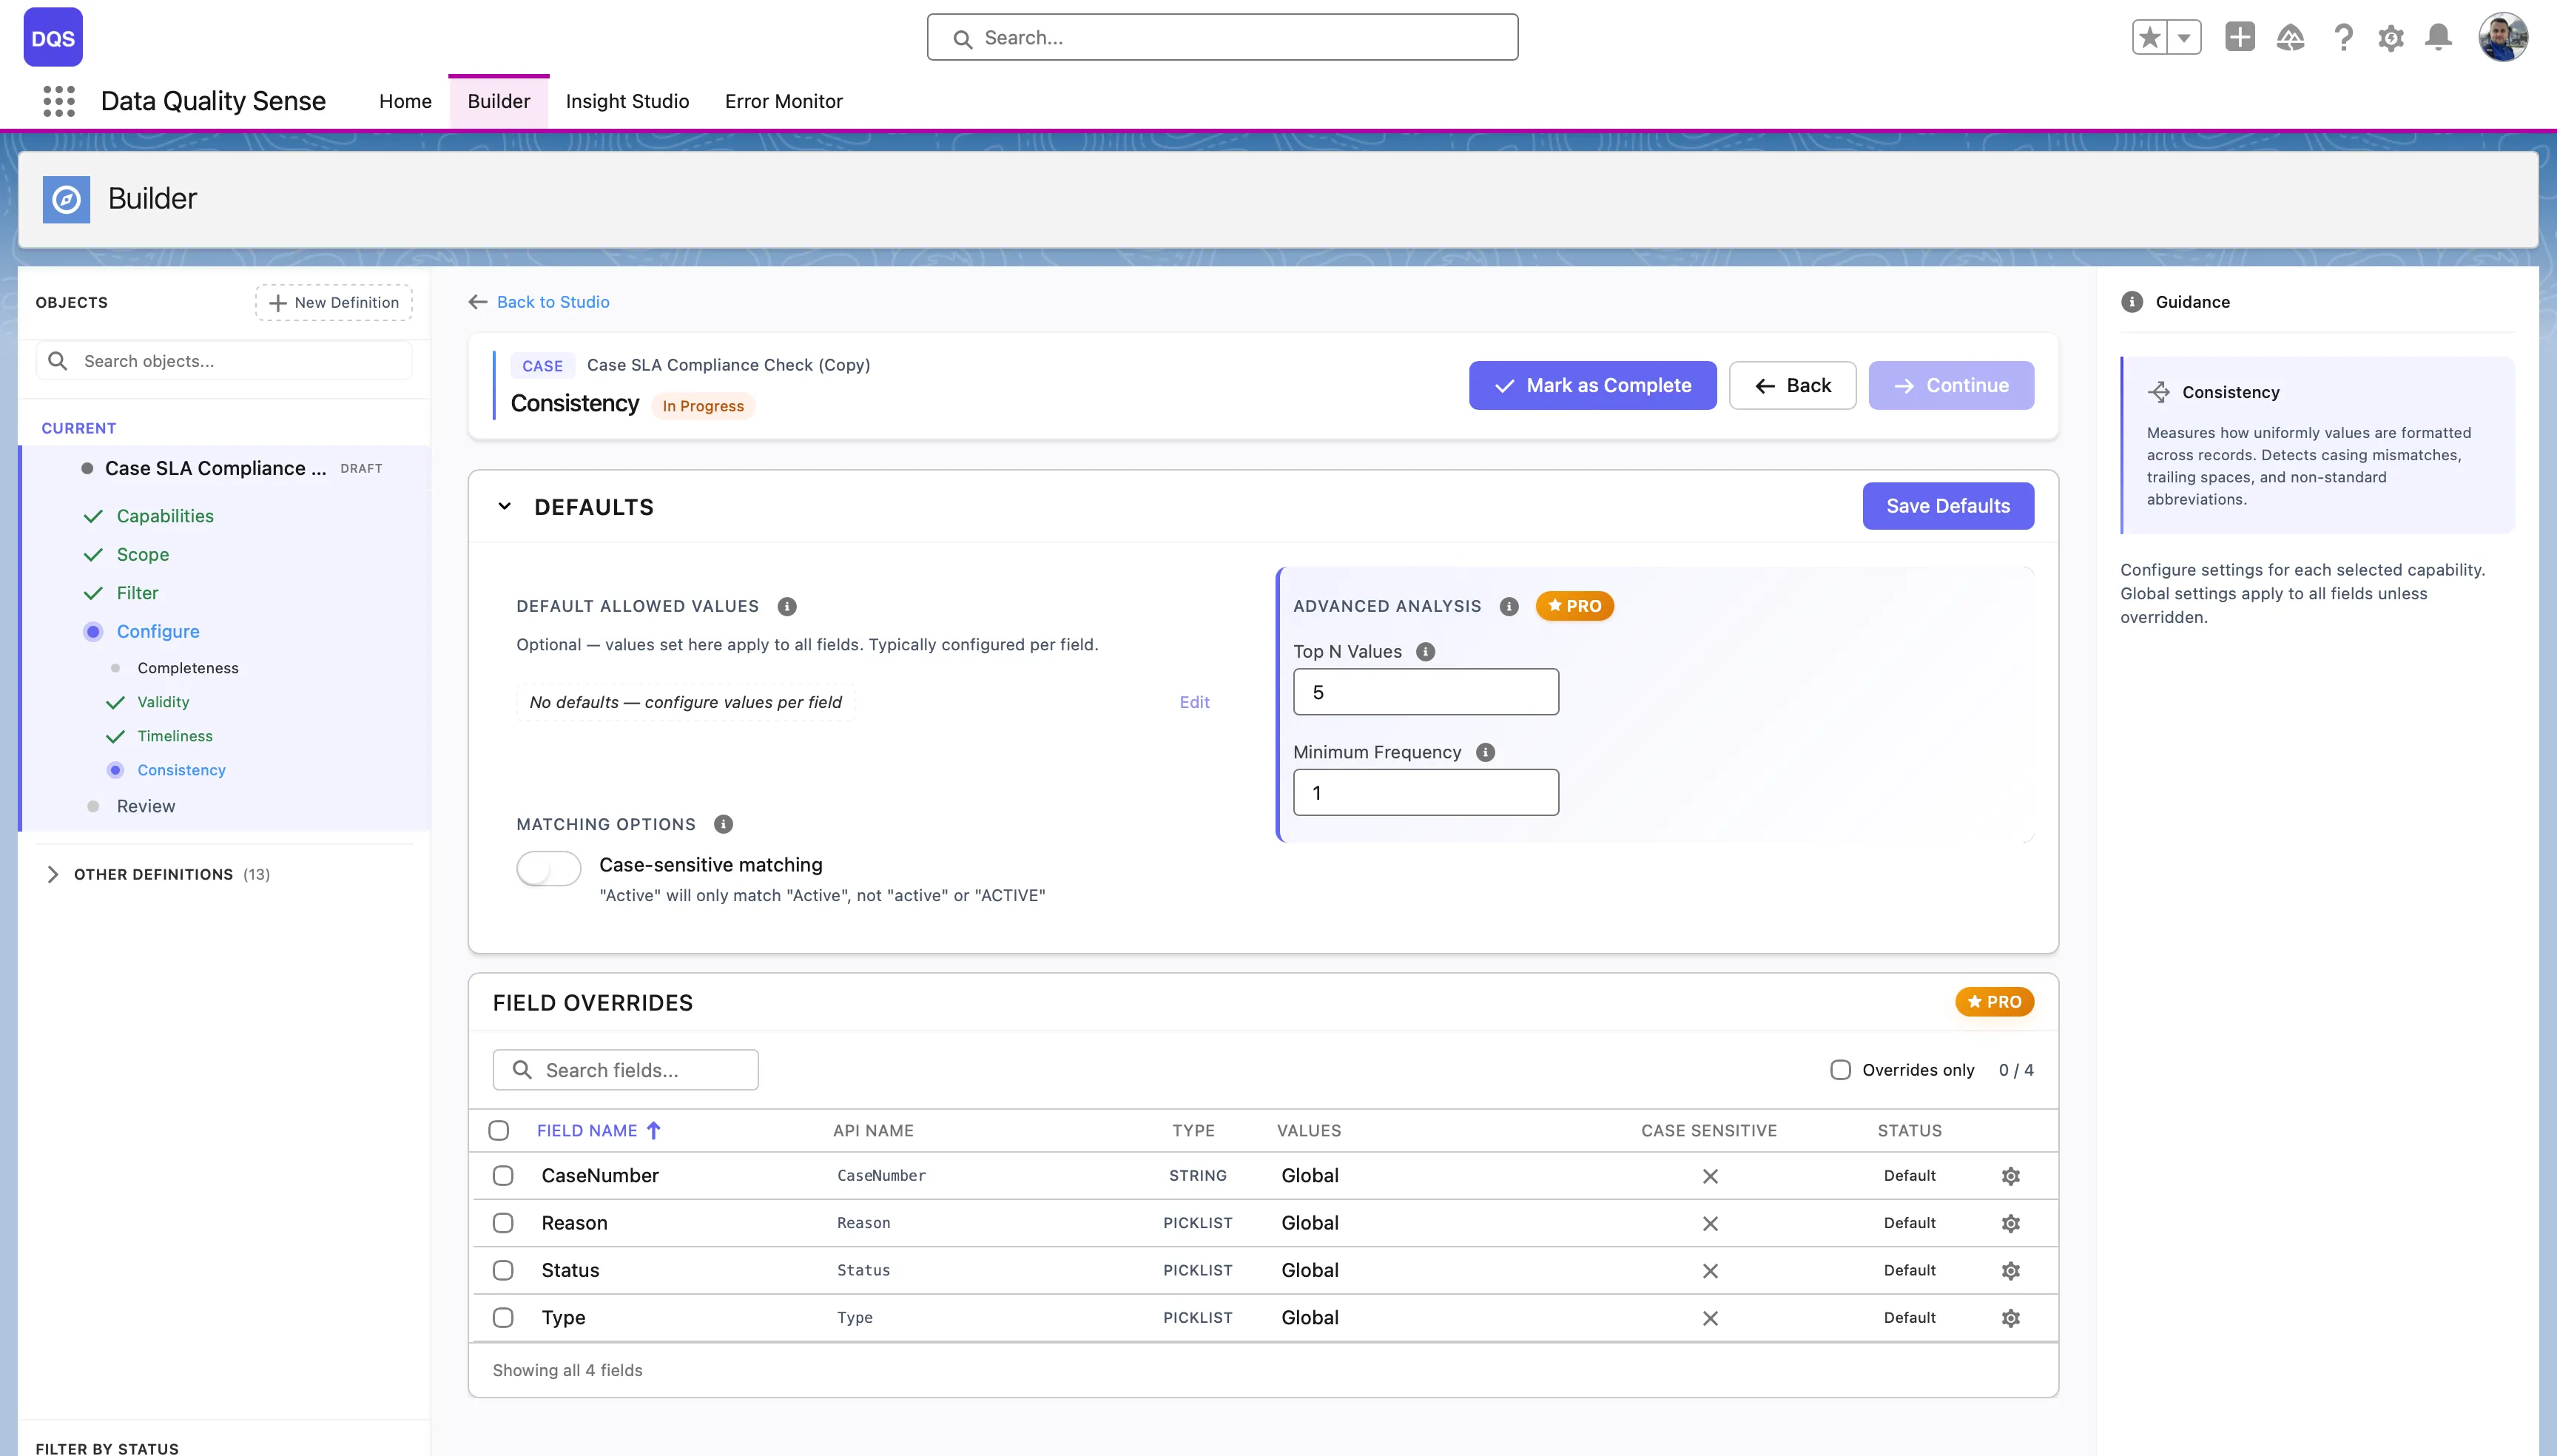
The Defaults section controls global consistency options:
| Setting | Description |
|---|---|
| Default Allowed Values | No defaults are set globally — configure allowed values per field to define what’s considered consistent. |
| Case-sensitive matching | When enabled, “Active” and “active” are treated as different values. Disabled by default. |
| Top N Values | (PRO) Analyze only the top N most frequent values for consistency checks. |
| Minimum Frequency | (PRO) Ignore values that appear fewer times than this threshold. |
The Field Overrides table lists each field with its current allowed values source, case sensitivity setting, and status.
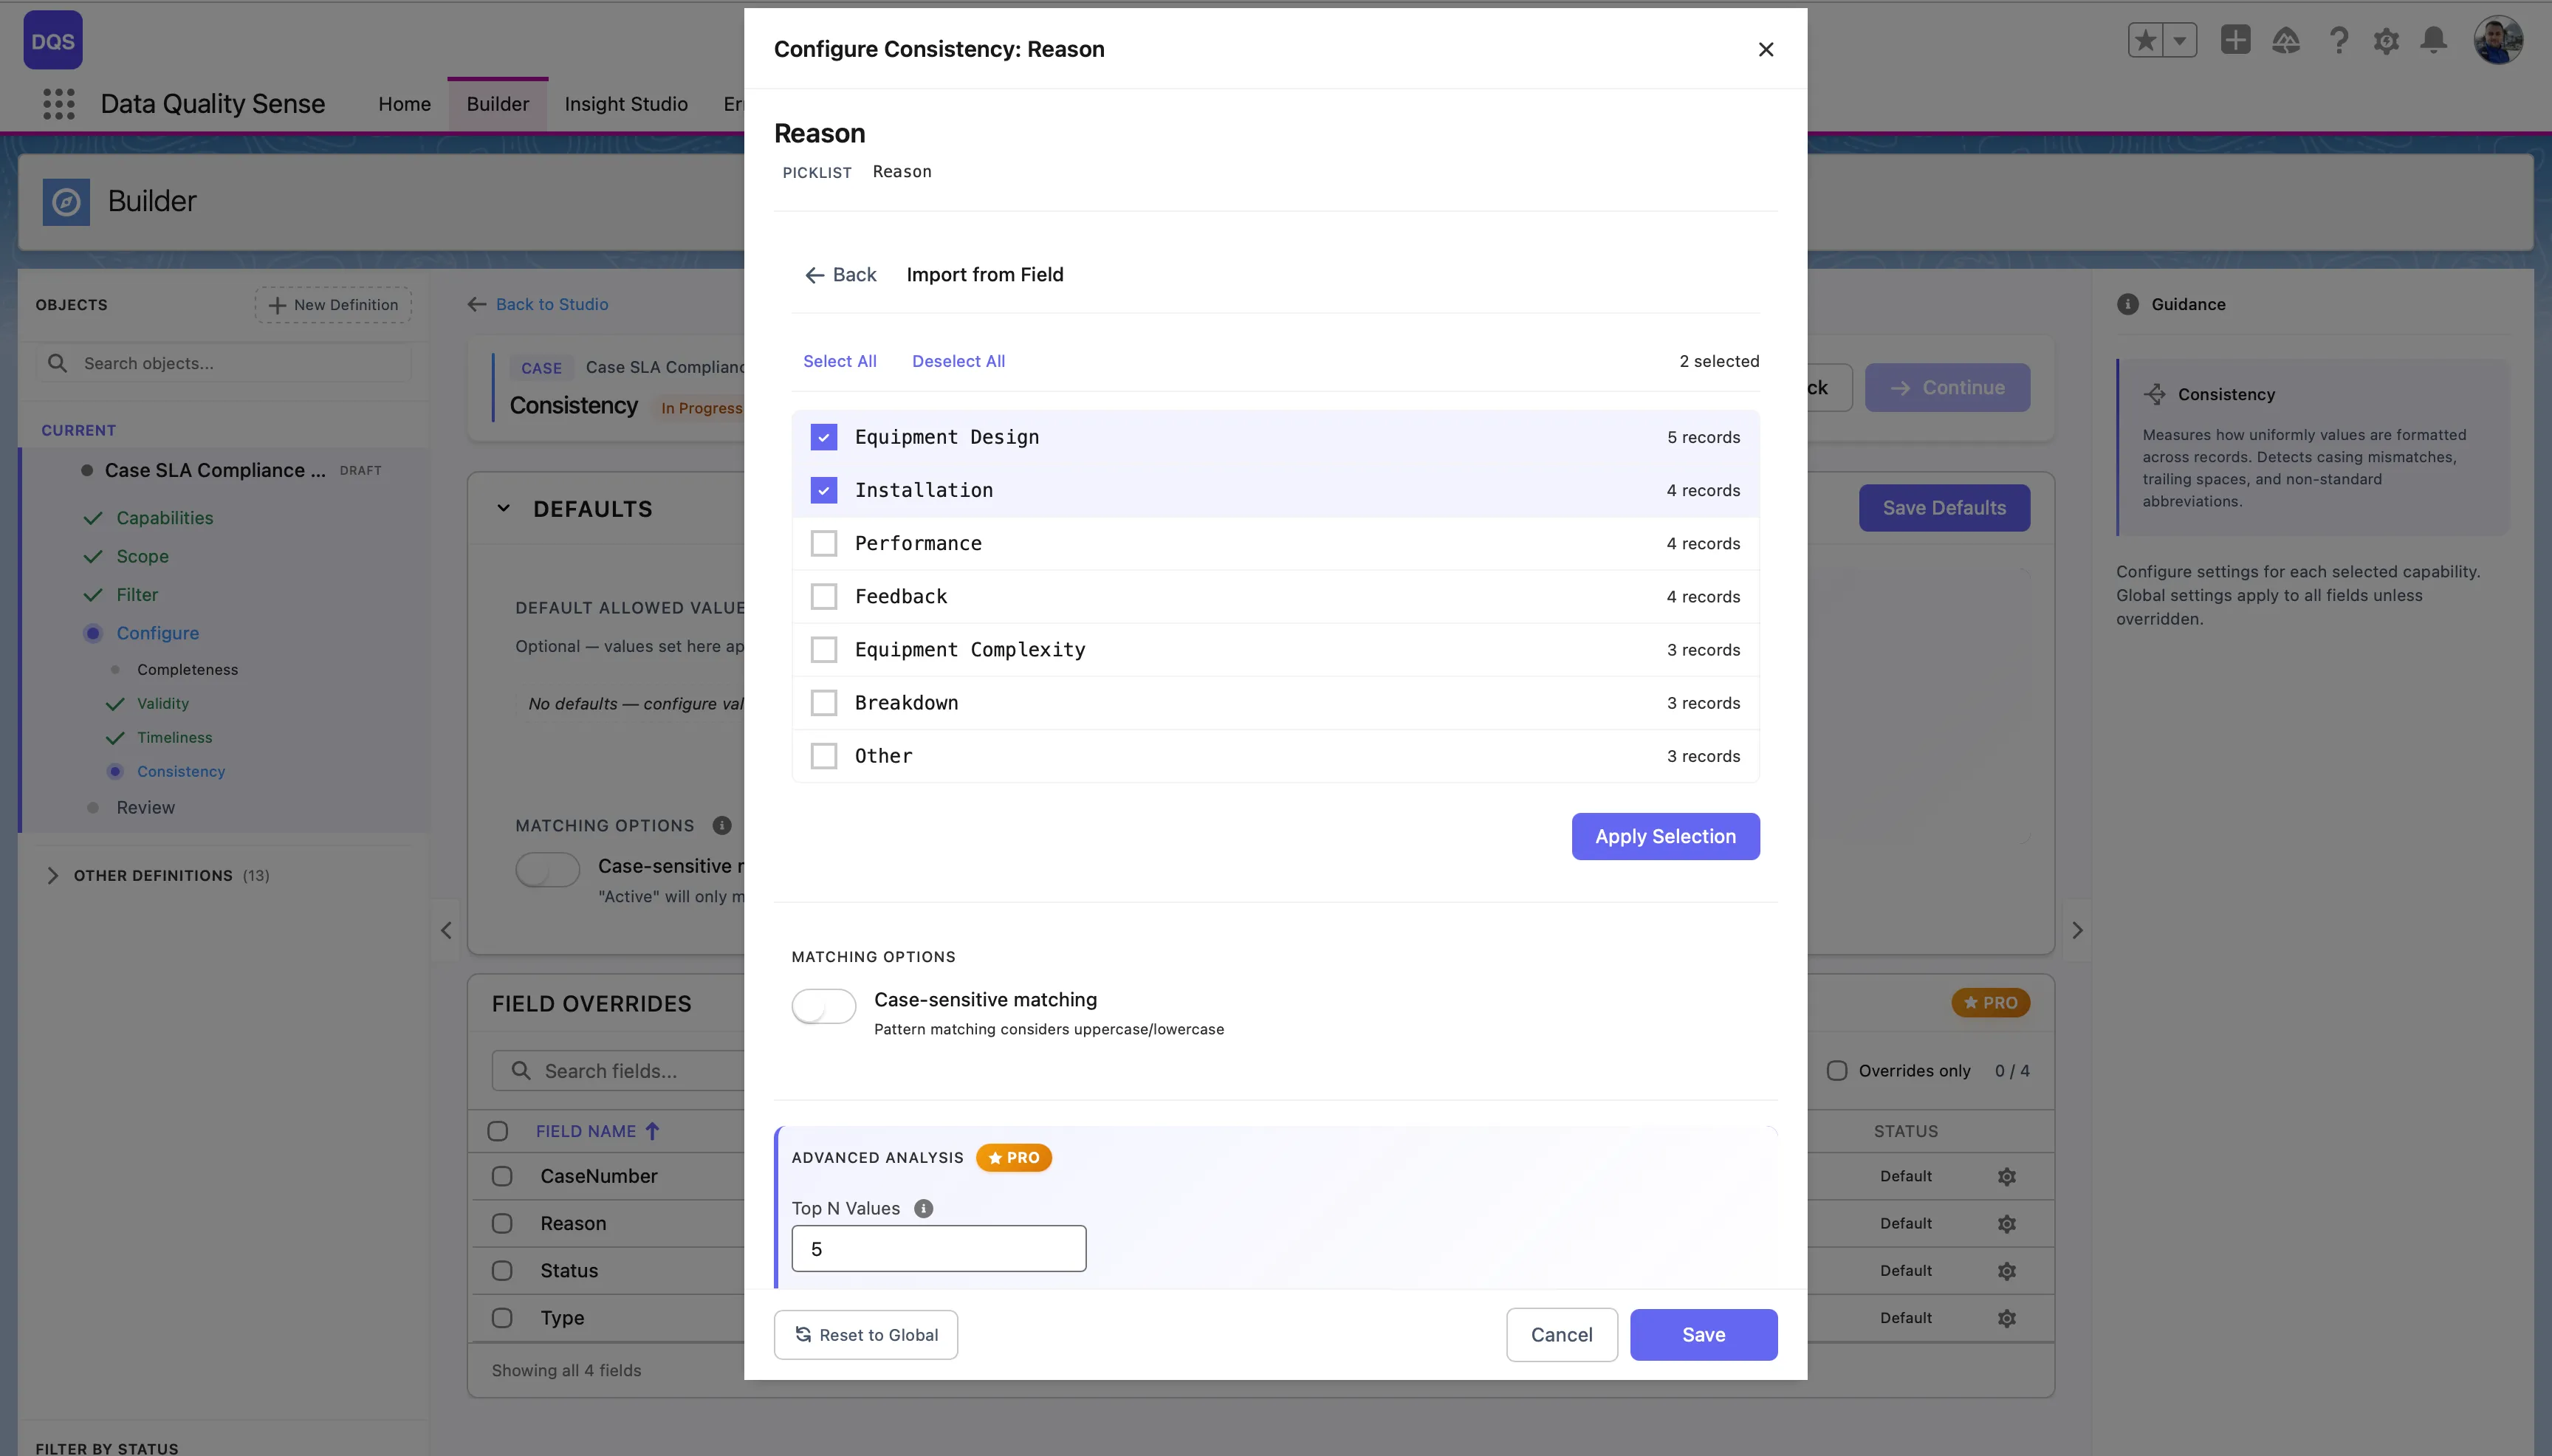
Click on a field in the Field Overrides table to open its configuration modal. You can define allowed values for that field by adding them manually or importing from field metadata. Toggle Case-sensitive matching and configure Advanced Analysis settings (Top N Values, Min Frequency) independently from the global defaults. Use the Revert to Global link to reset.
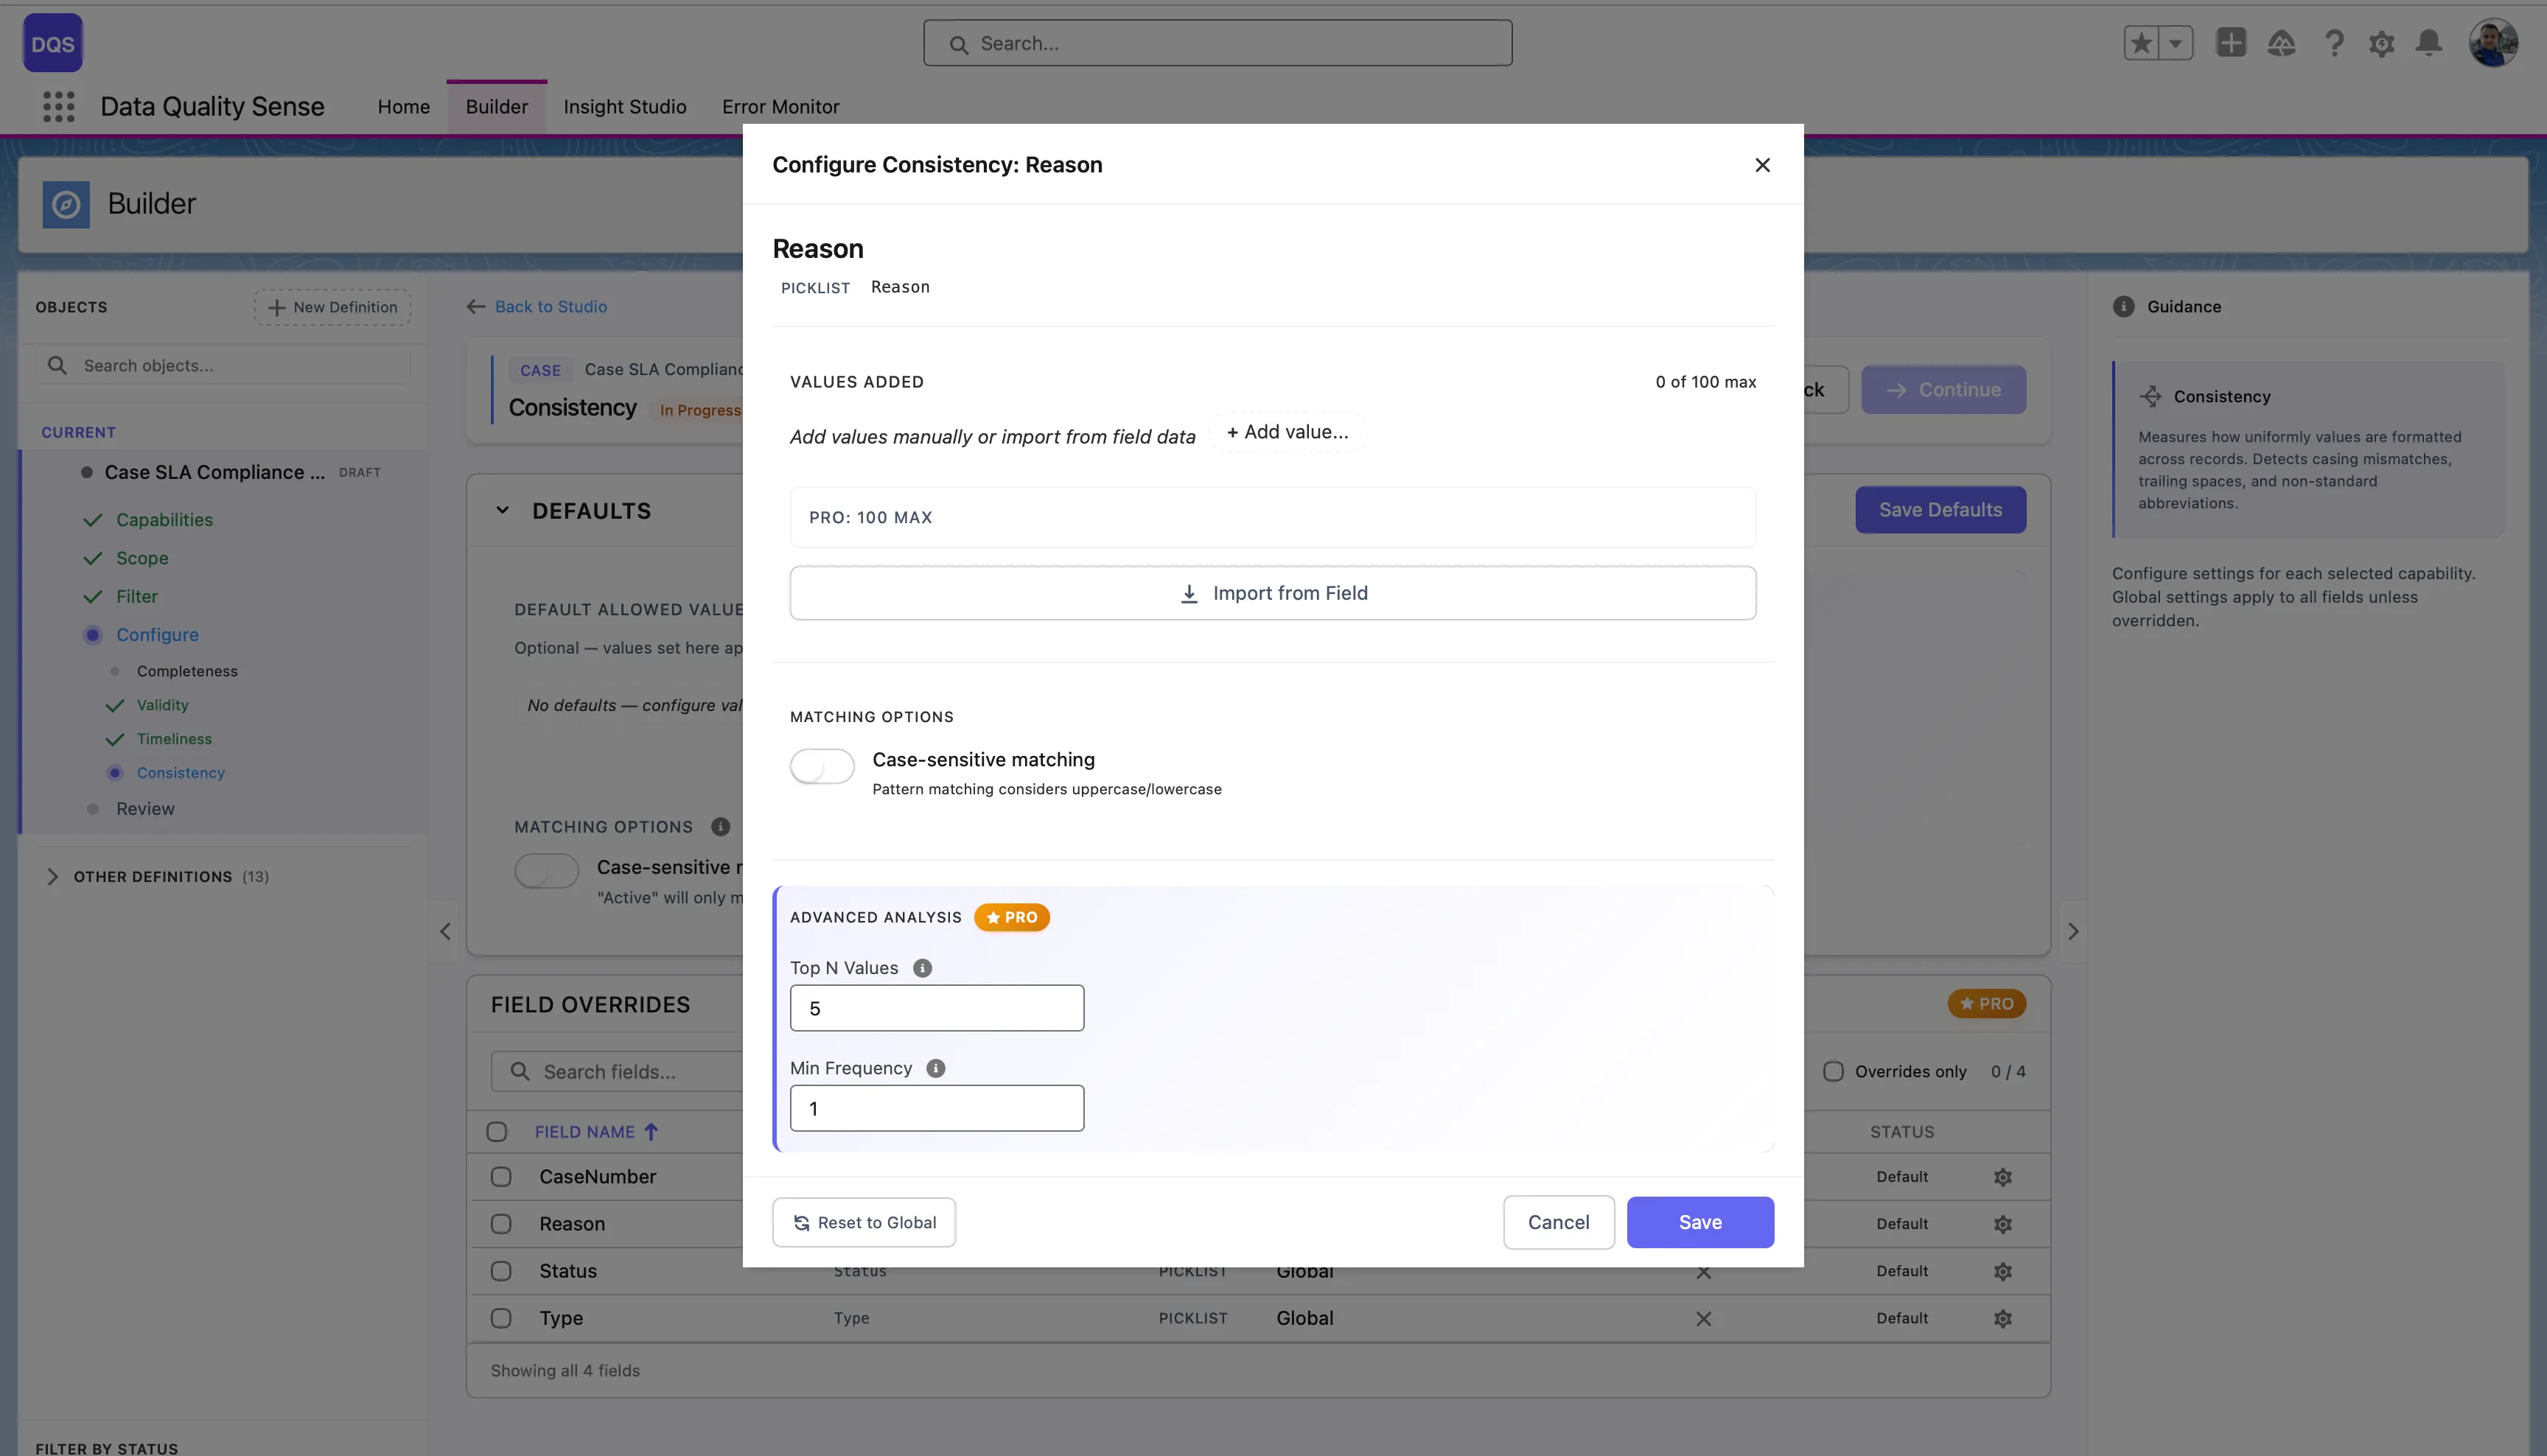
For picklist fields, click Import from Field to load all existing values directly from the field metadata. The import dialog shows each value with a checkbox and the number of records using it, so you can select which values to treat as valid. Click Apply Selection to confirm.
| Result | Score |
|---|---|
| All records consistent | 100 |
| Some inconsistencies | Proportional to consistent percentage |
| All records inconsistent | 0 |
| No data | 0 |
PII Detection scans free-text fields for personally identifiable information that shouldn’t be stored in those fields. It helps organizations comply with data privacy regulations like GDPR, CCPA, and HIPAA.
The PII Detection strategy analyzes text content for patterns that match:
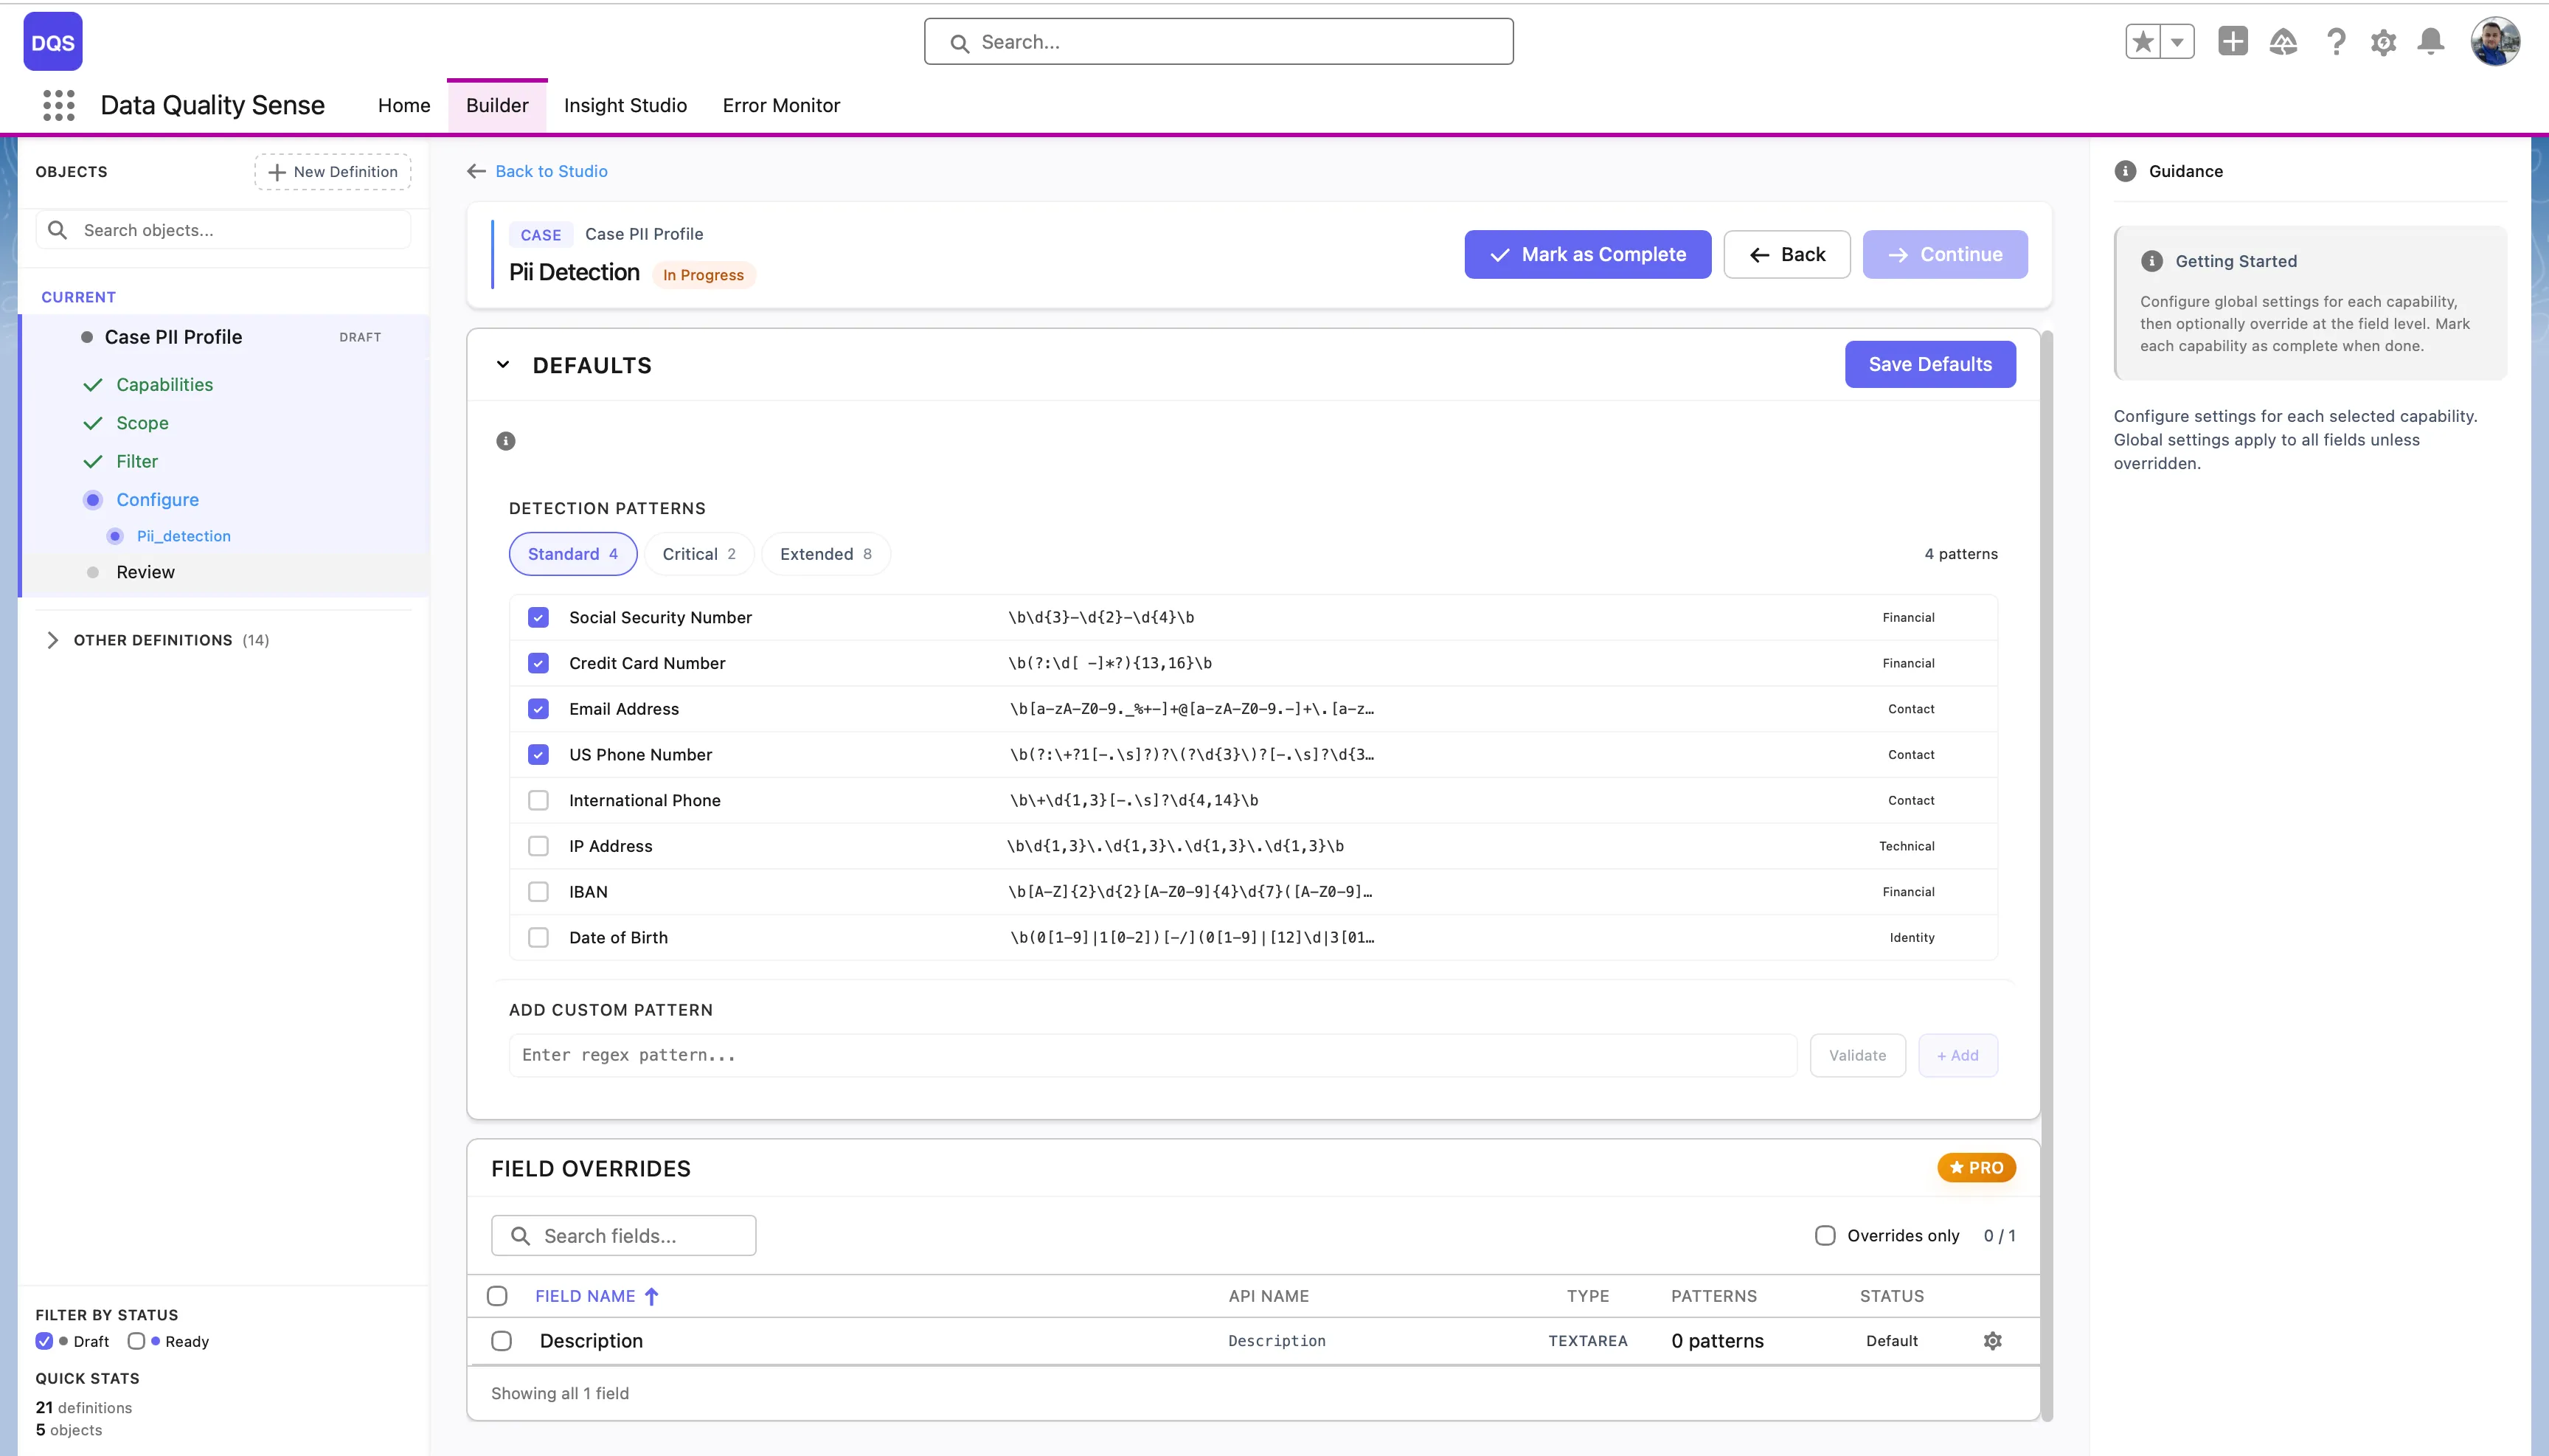
The Defaults section provides three preset groups of detection patterns:
| Preset | Description |
|---|---|
| Standard | Core PII patterns — Social Security Number, Credit Card Number, Email Address, US Phone Number |
| Critical | High-risk financial and identity patterns |
| Extended | Full set including IP Address, IBAN, Date of Birth, International Phone, and more |
Each pattern shows its regex expression and can be individually enabled or disabled. You can also add your own patterns in the Add Custom Pattern section by entering a regex and a label.
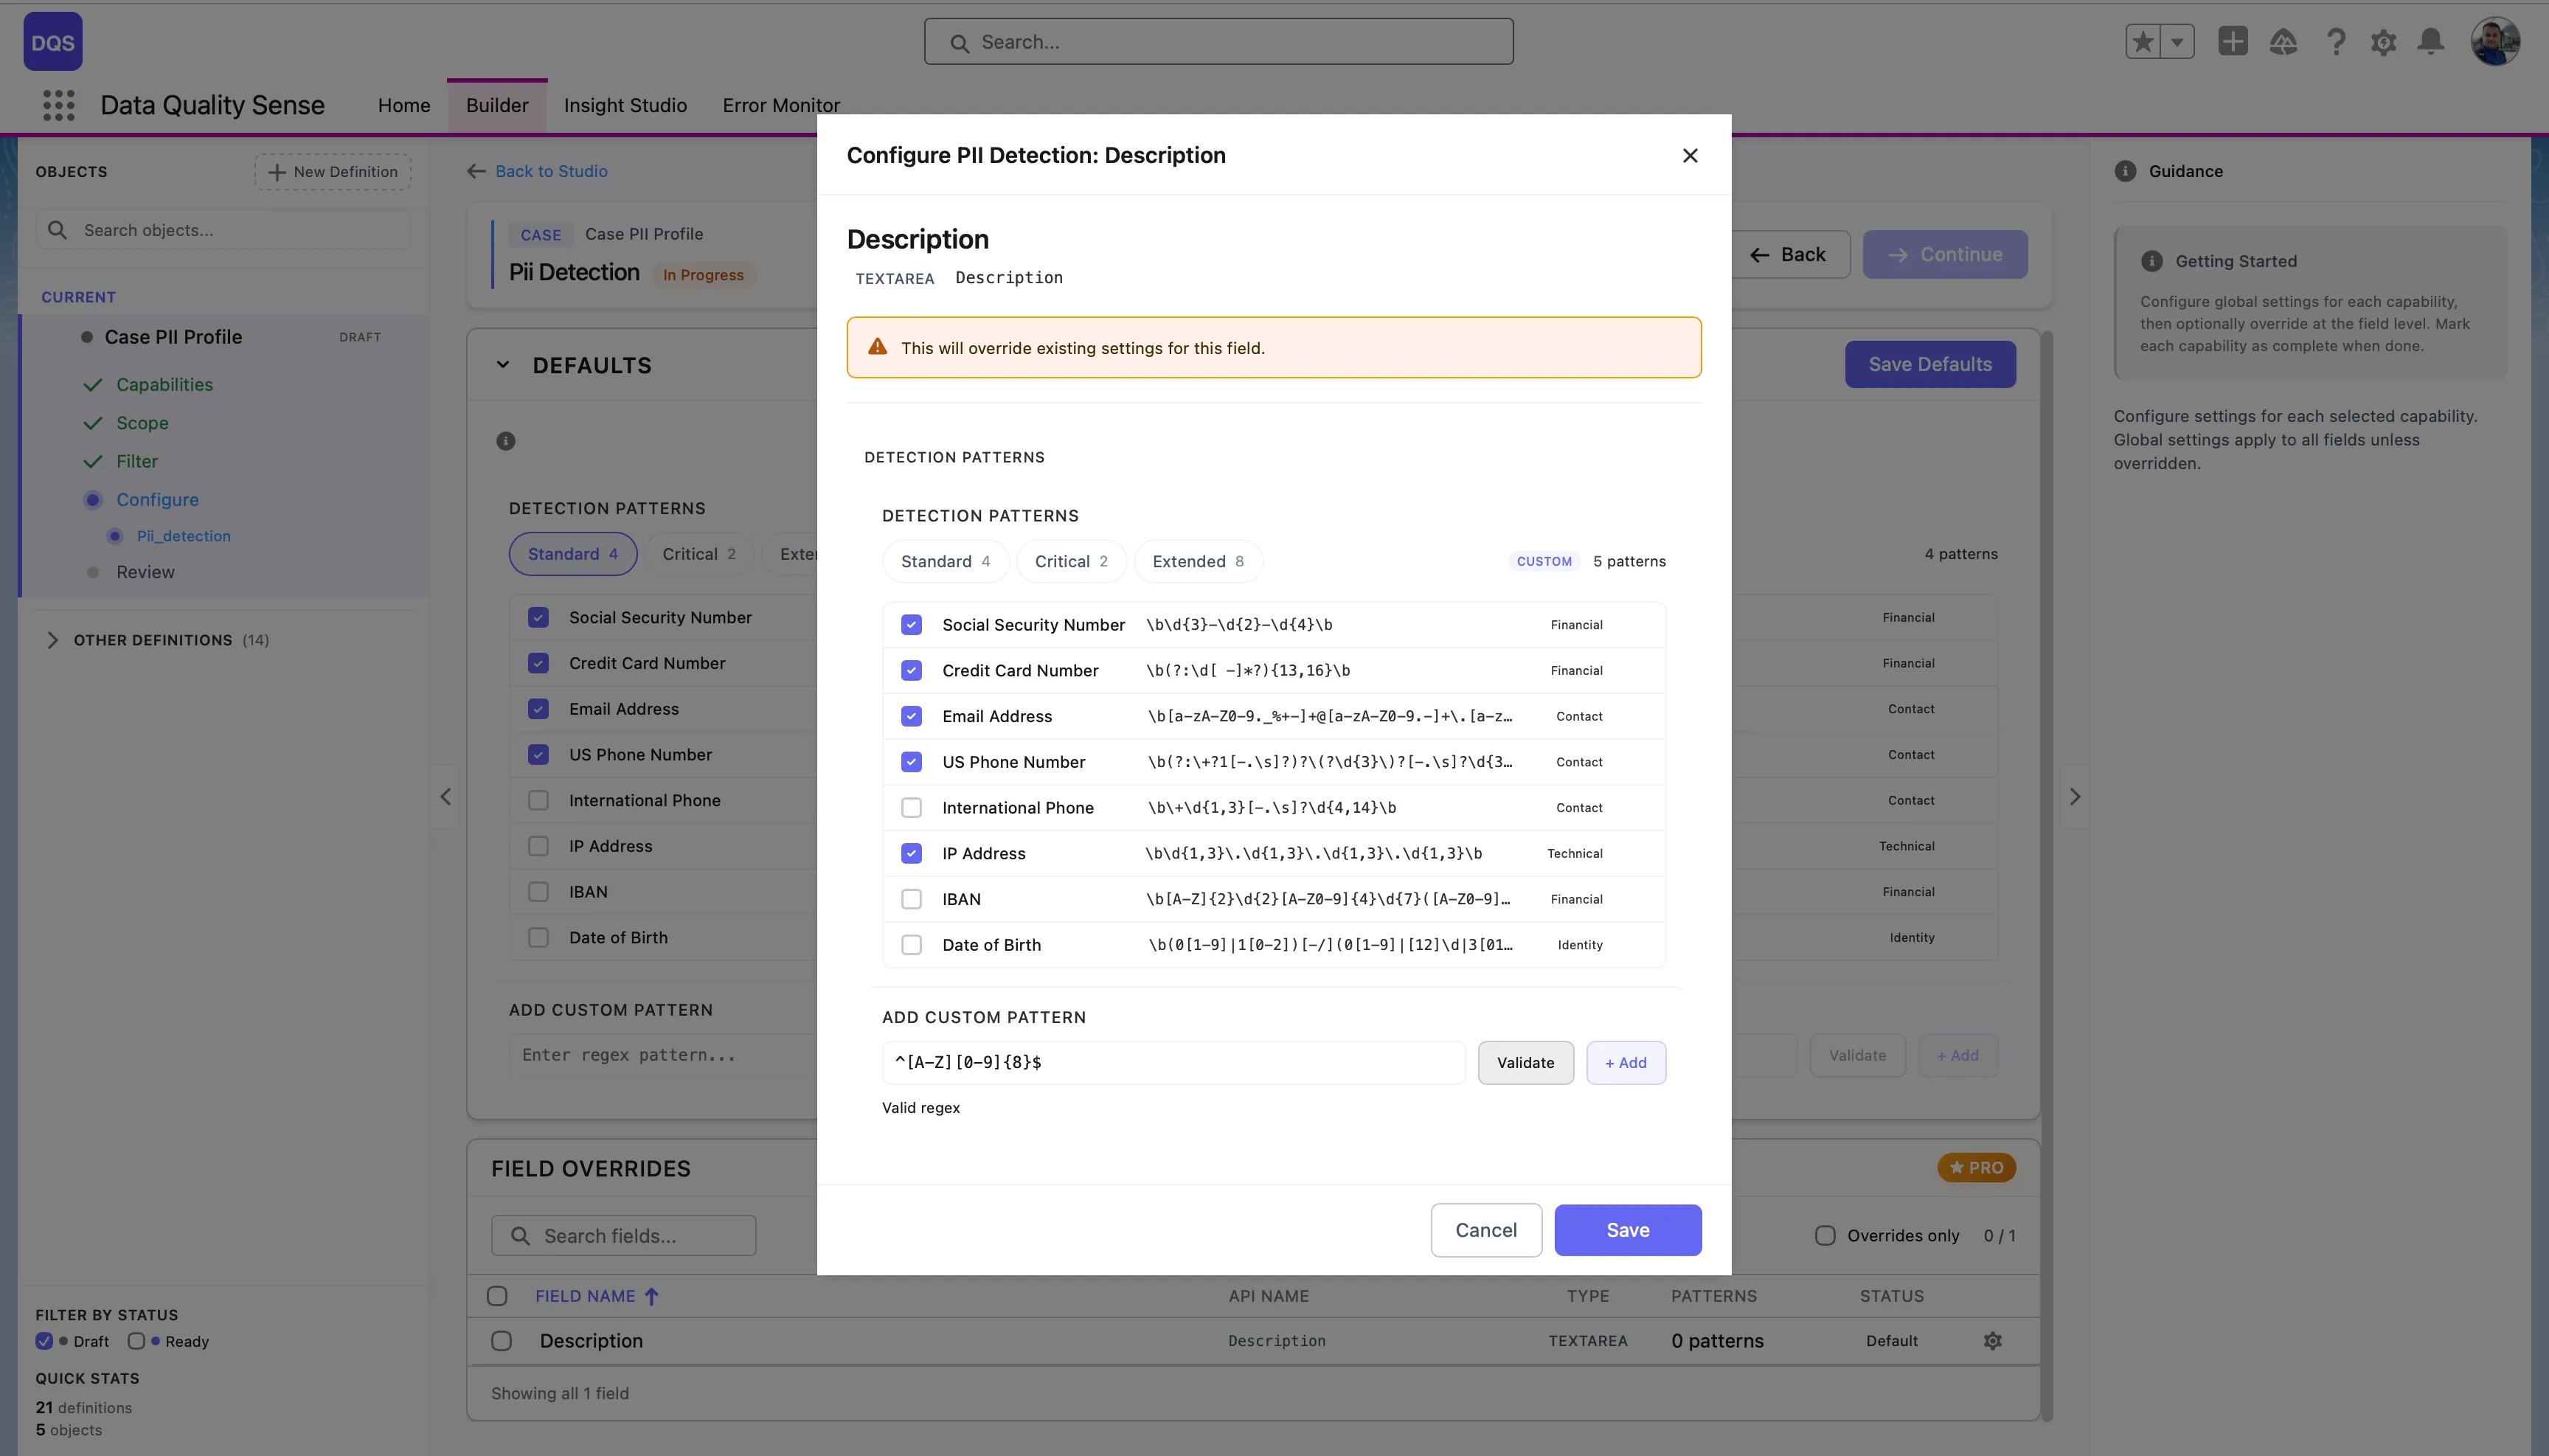
Click on a field in the Field Overrides table to open its configuration modal. You can select which detection patterns apply to that field — choose a preset or enable/disable individual patterns. The modal also lets you add custom patterns specific to that field. Use the Revert to Global link to reset.
| Result | Score |
|---|---|
| No PII detected | 100 |
| Some PII found | Proportional to clean percentage |
| PII in all records | 0 |
| No data | 0 |
DQS uses Java-compatible regular expressions to detect PII in free-text fields. See the Regex Tester for an interactive tester and a full library of PII patterns — including SSN, credit cards (Visa, Mastercard, Amex), IBAN, passport numbers, PESEL, NIP, and more.
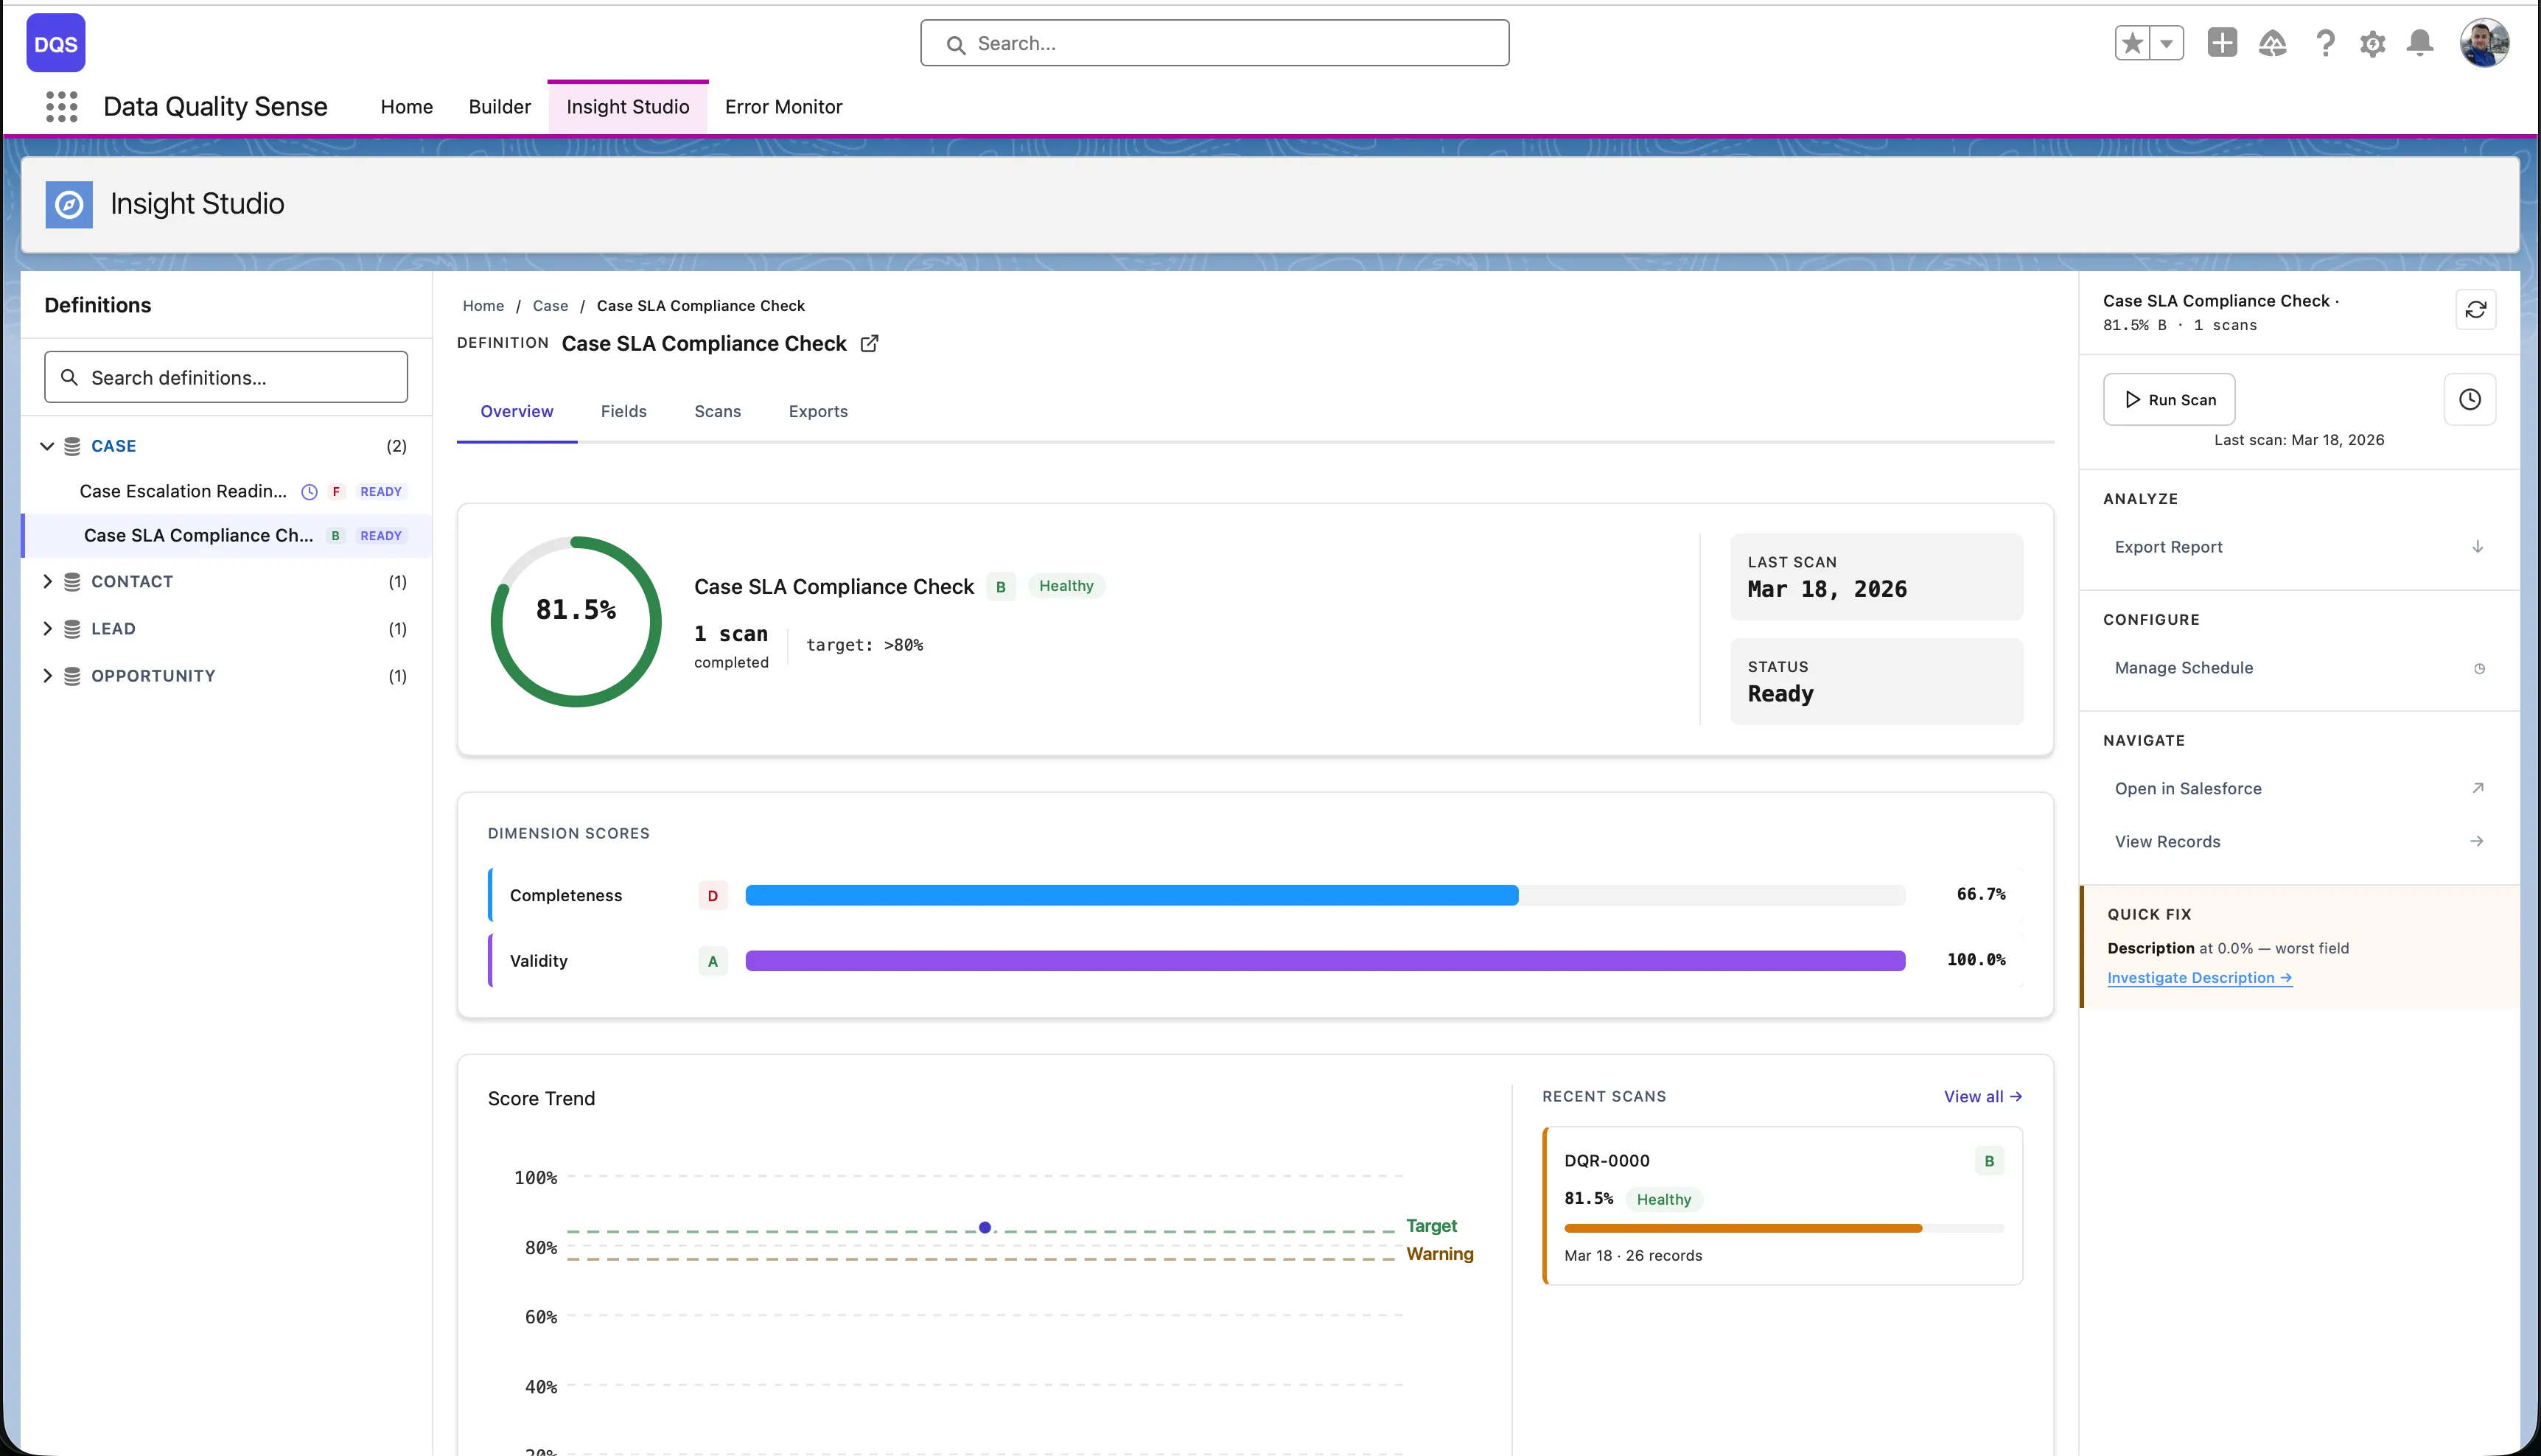
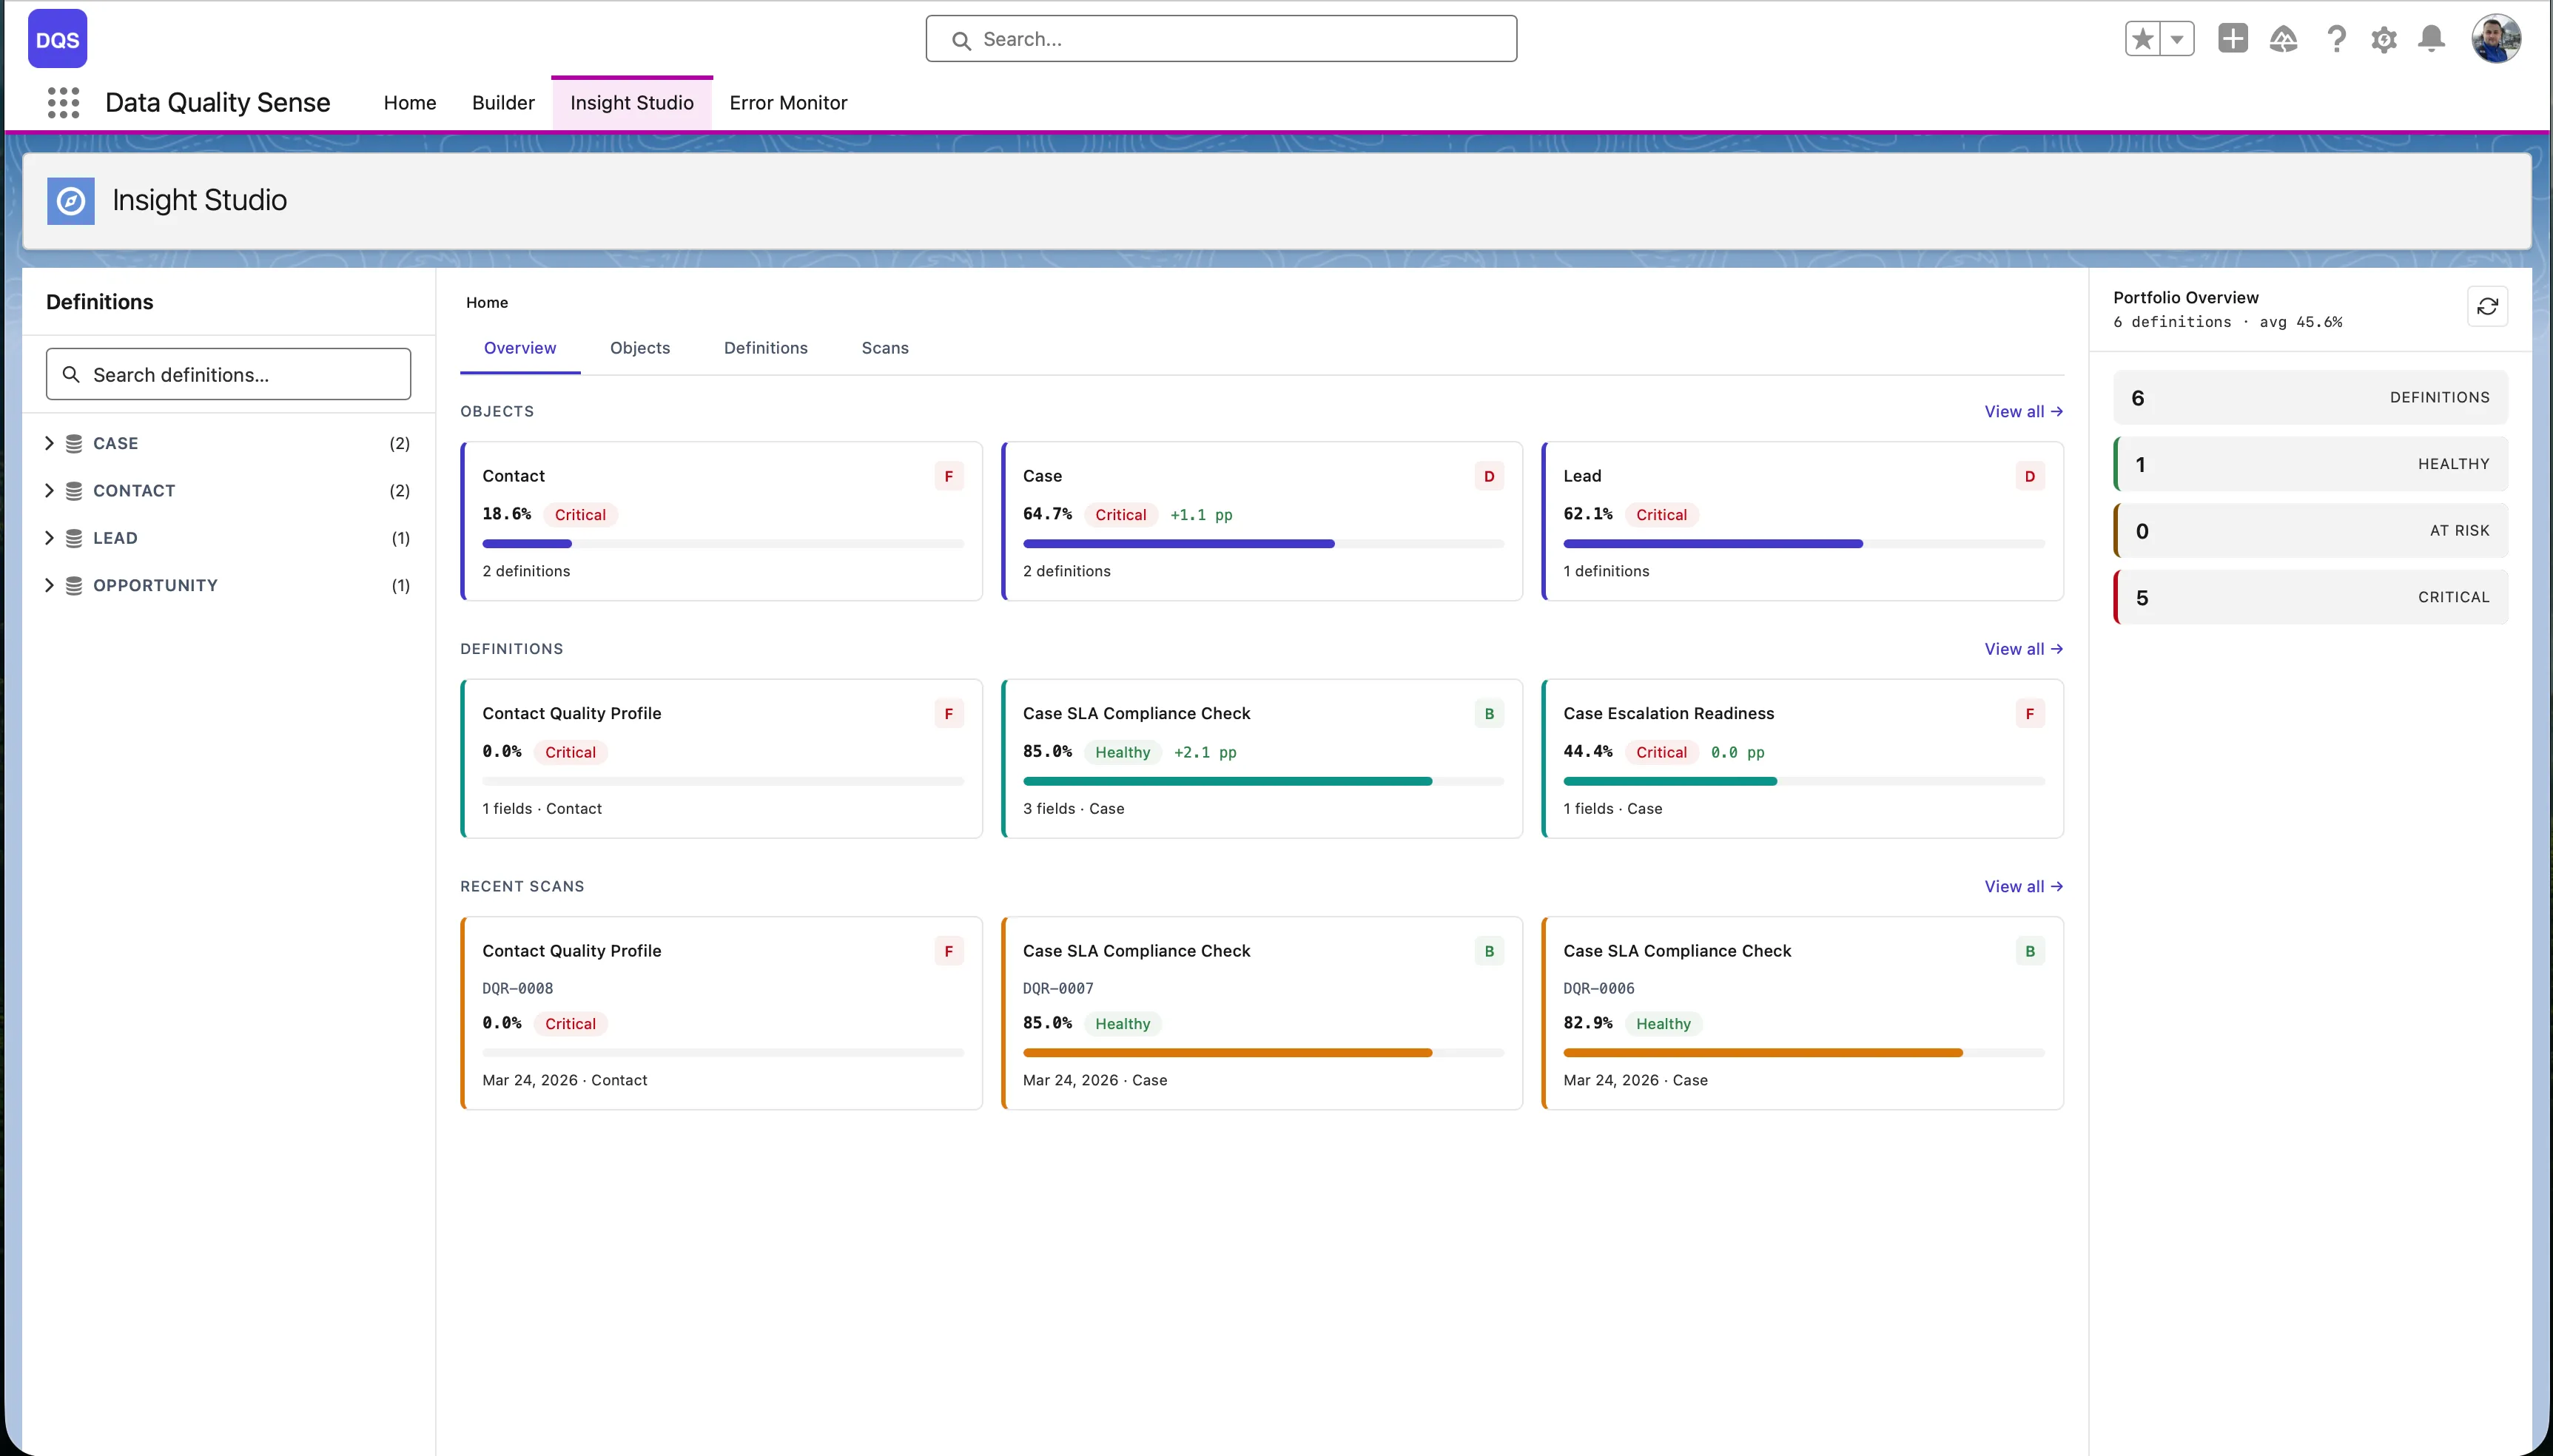
Insight Studio (DIS) is the visualization and analytics layer of Data Quality Sense. It consumes scan results and presents them as interactive dashboards, charts, and recommendations.
Insight Studio uses a 3-zone layout:
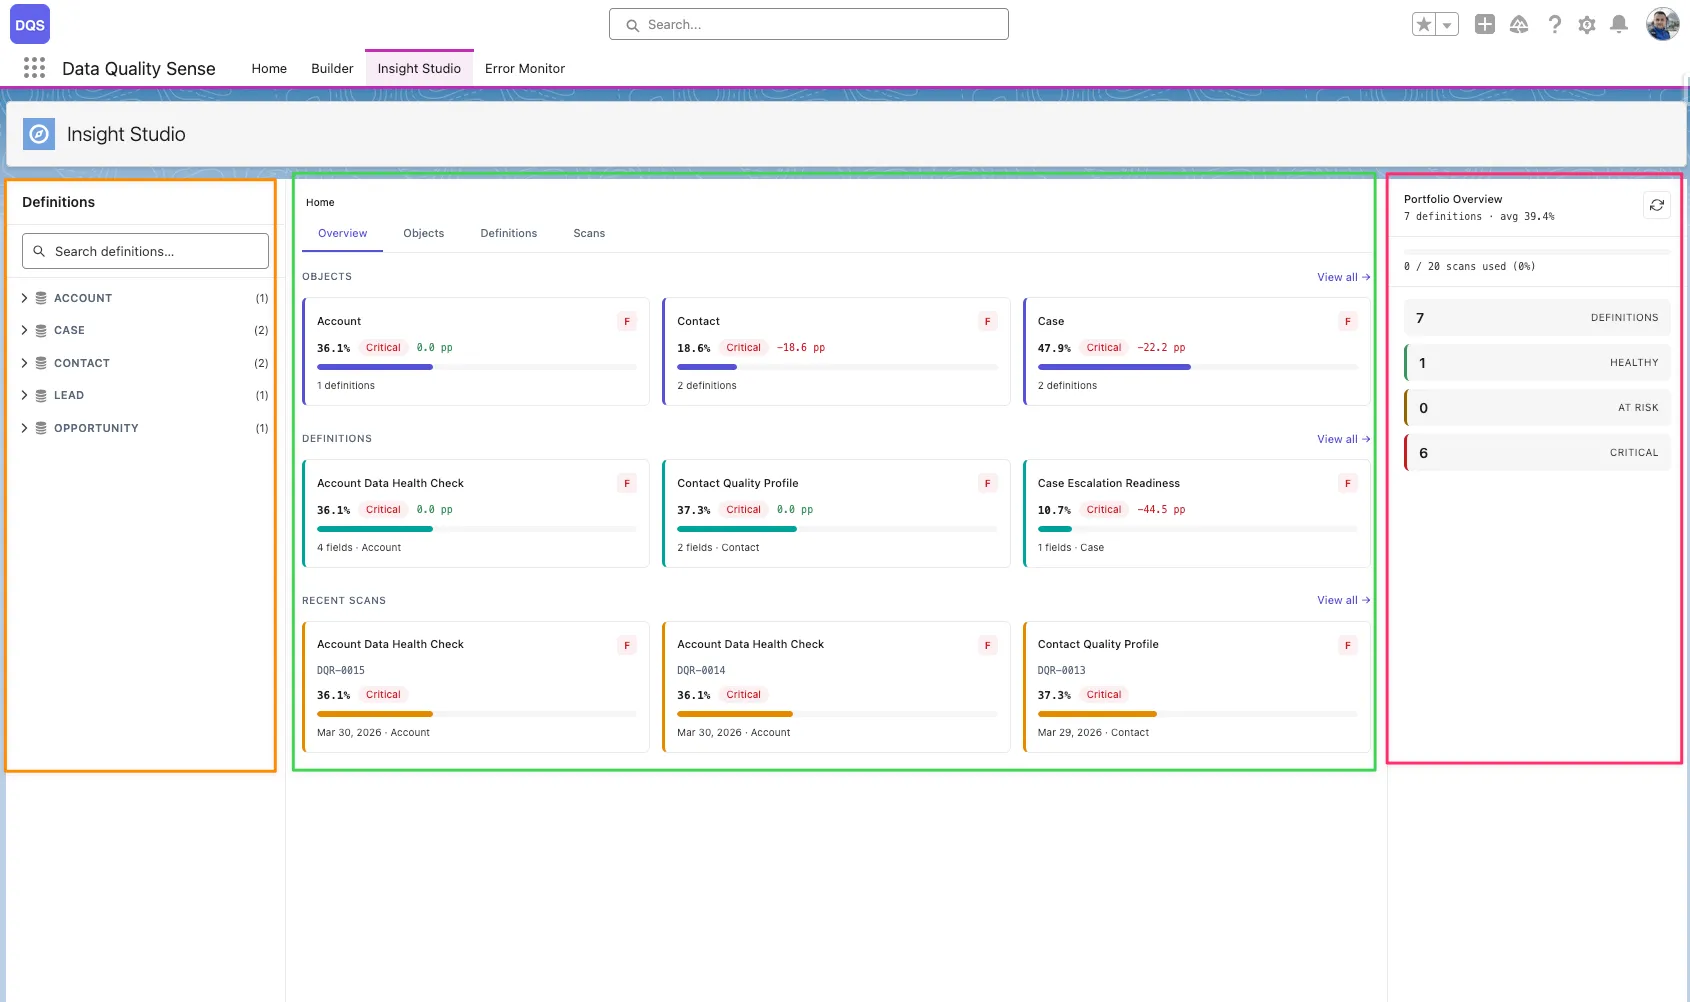
Score Overview
At-a-glance quality scores for each dimension, with overall ratings and grade indicators.
Trend Analysis
Sparklines and trend charts showing how data quality changes over time across scans.
Field Health
Matrix view of every field’s quality score per dimension. Quickly spot the weakest fields.
AI Mentor
Contextual recommendations based on scan results. Suggests actions to improve data quality.
| Feature | Description |
|---|---|
| Multi-level navigation | Drill from Home → Object → Definition → Scan → Field → Dimension |
| Score comparison | Compare results between two scans to see improvement or regression |
| Actions menu | Create Tasks, Post Chatter, or Export CSV for impacted records |
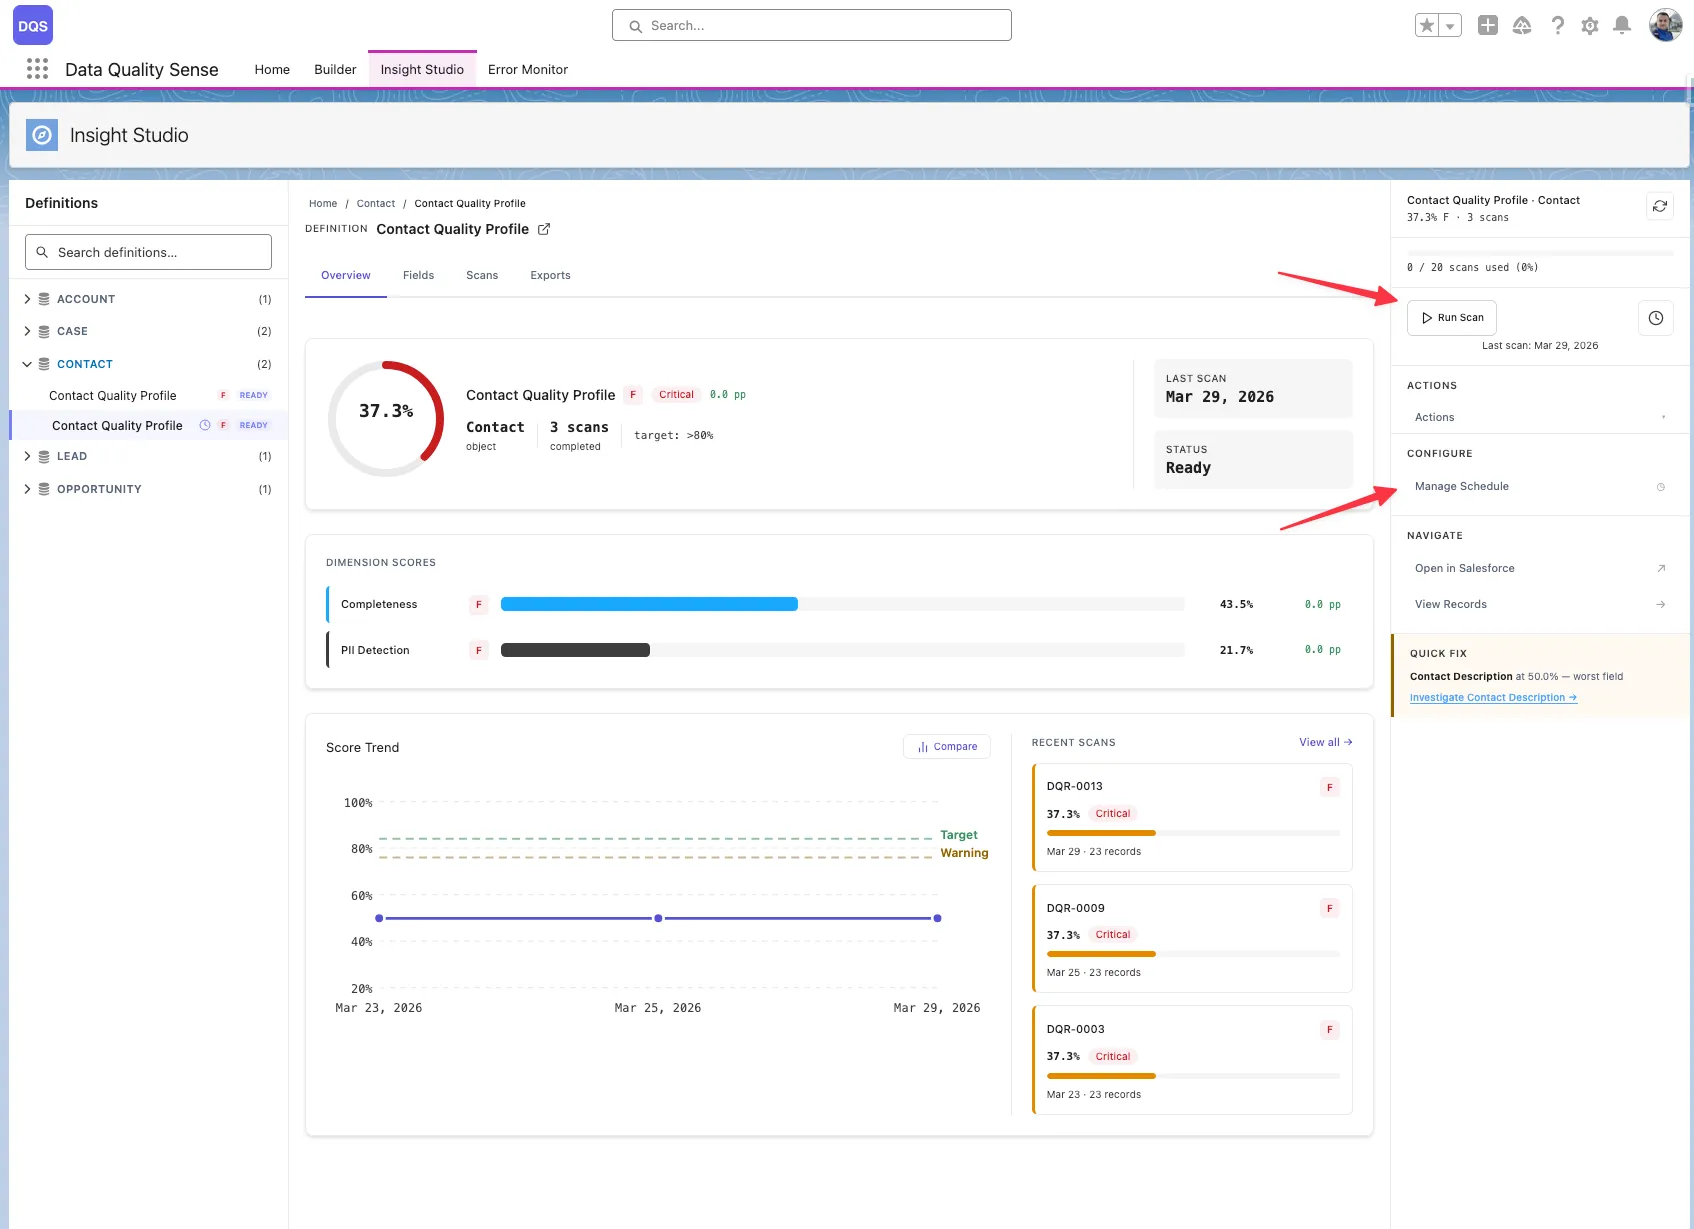
| Scan trigger | Manually trigger a scan from the dashboard |
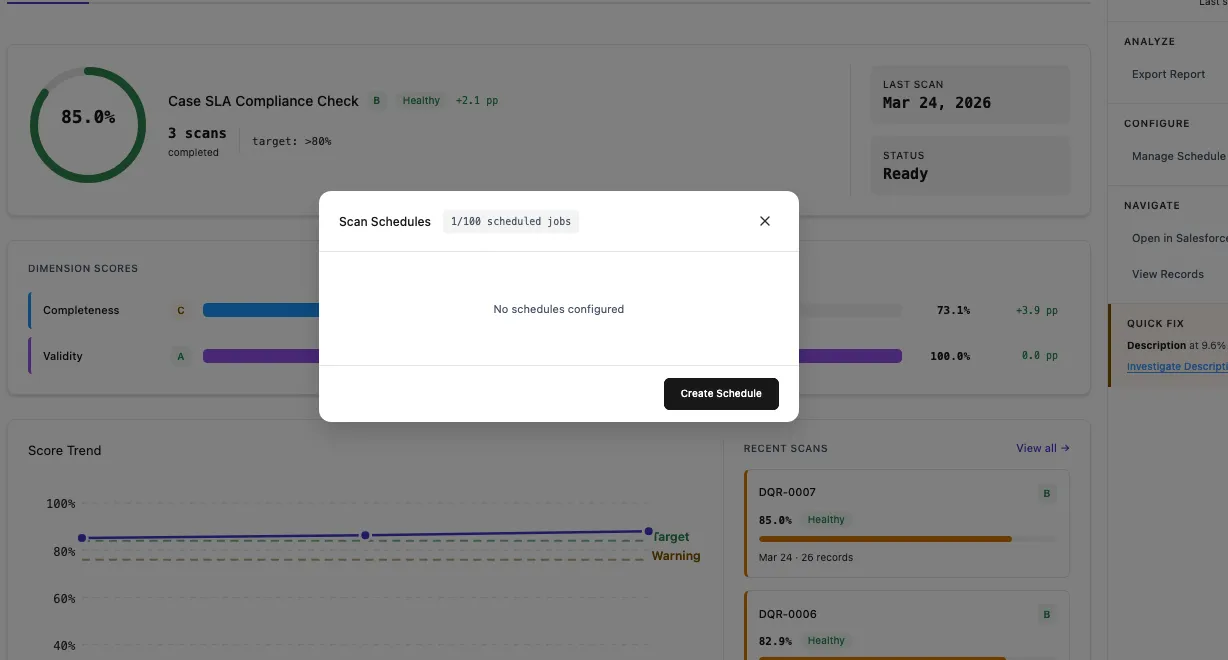
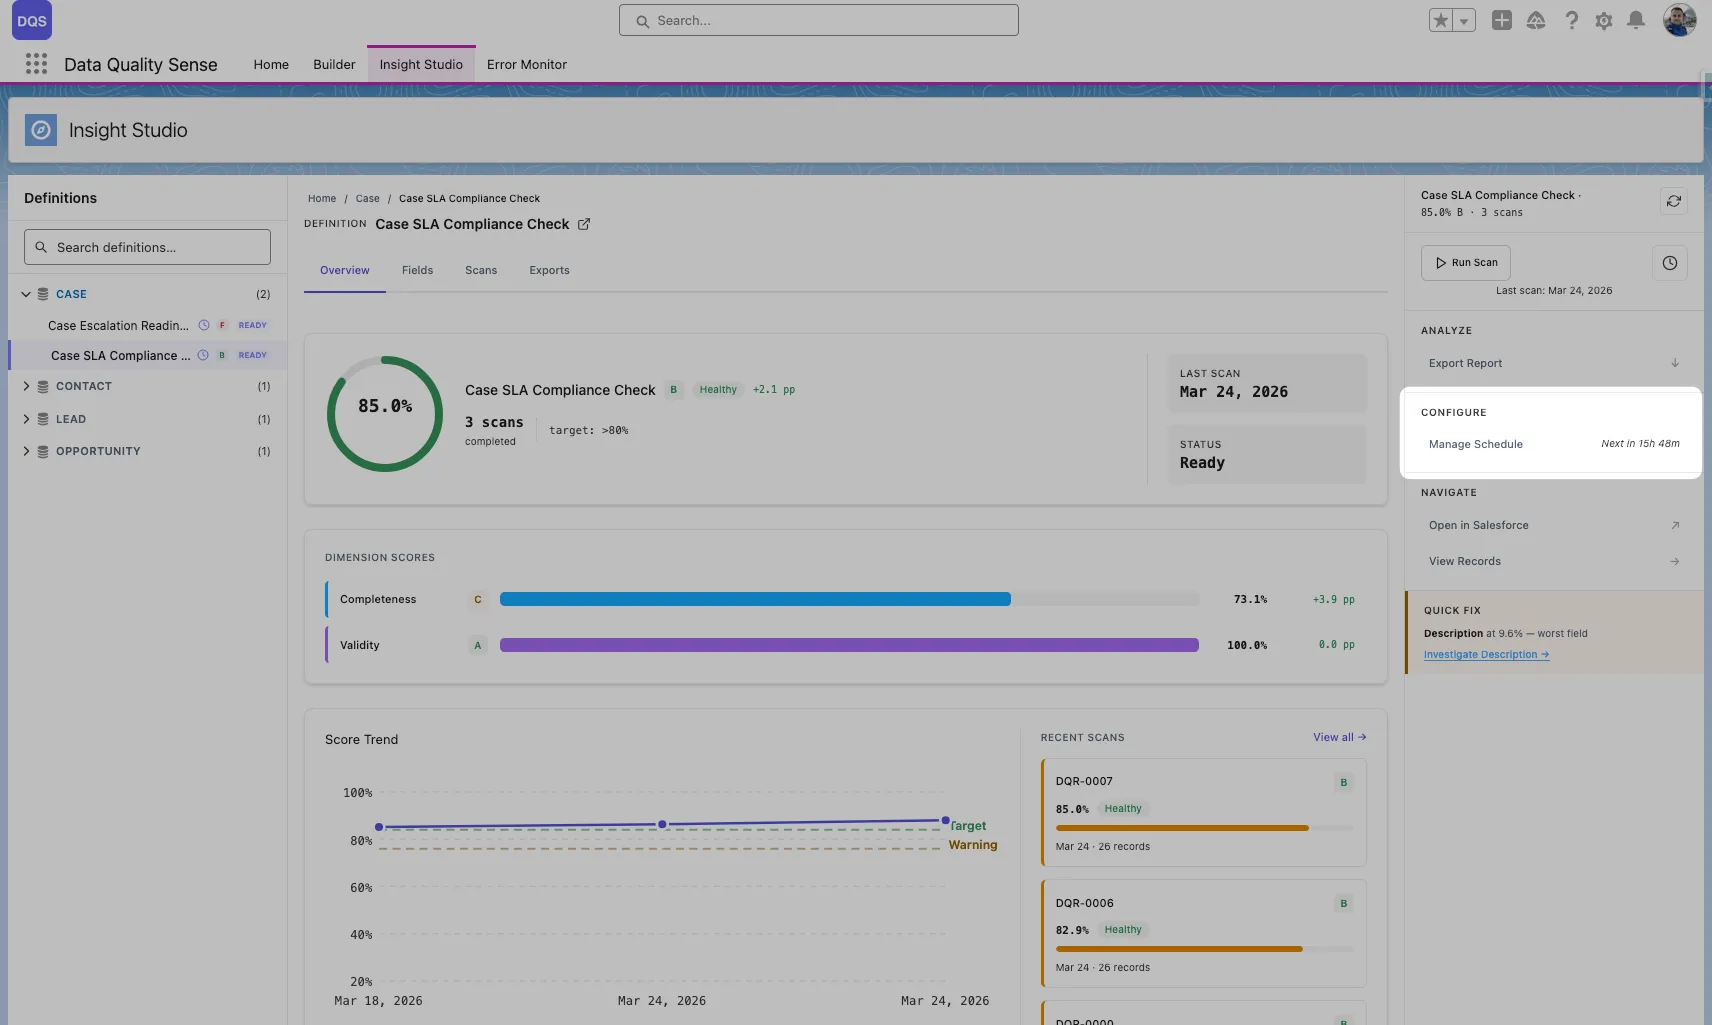
| Schedule management | Create and manage scan schedules |
Insight Studio provides a 6-level drill-down hierarchy:
Home → Object → Definition → Scan → Field → DimensionThe top-level view showing all scanned objects with their latest quality scores. Use this to identify which objects need attention.
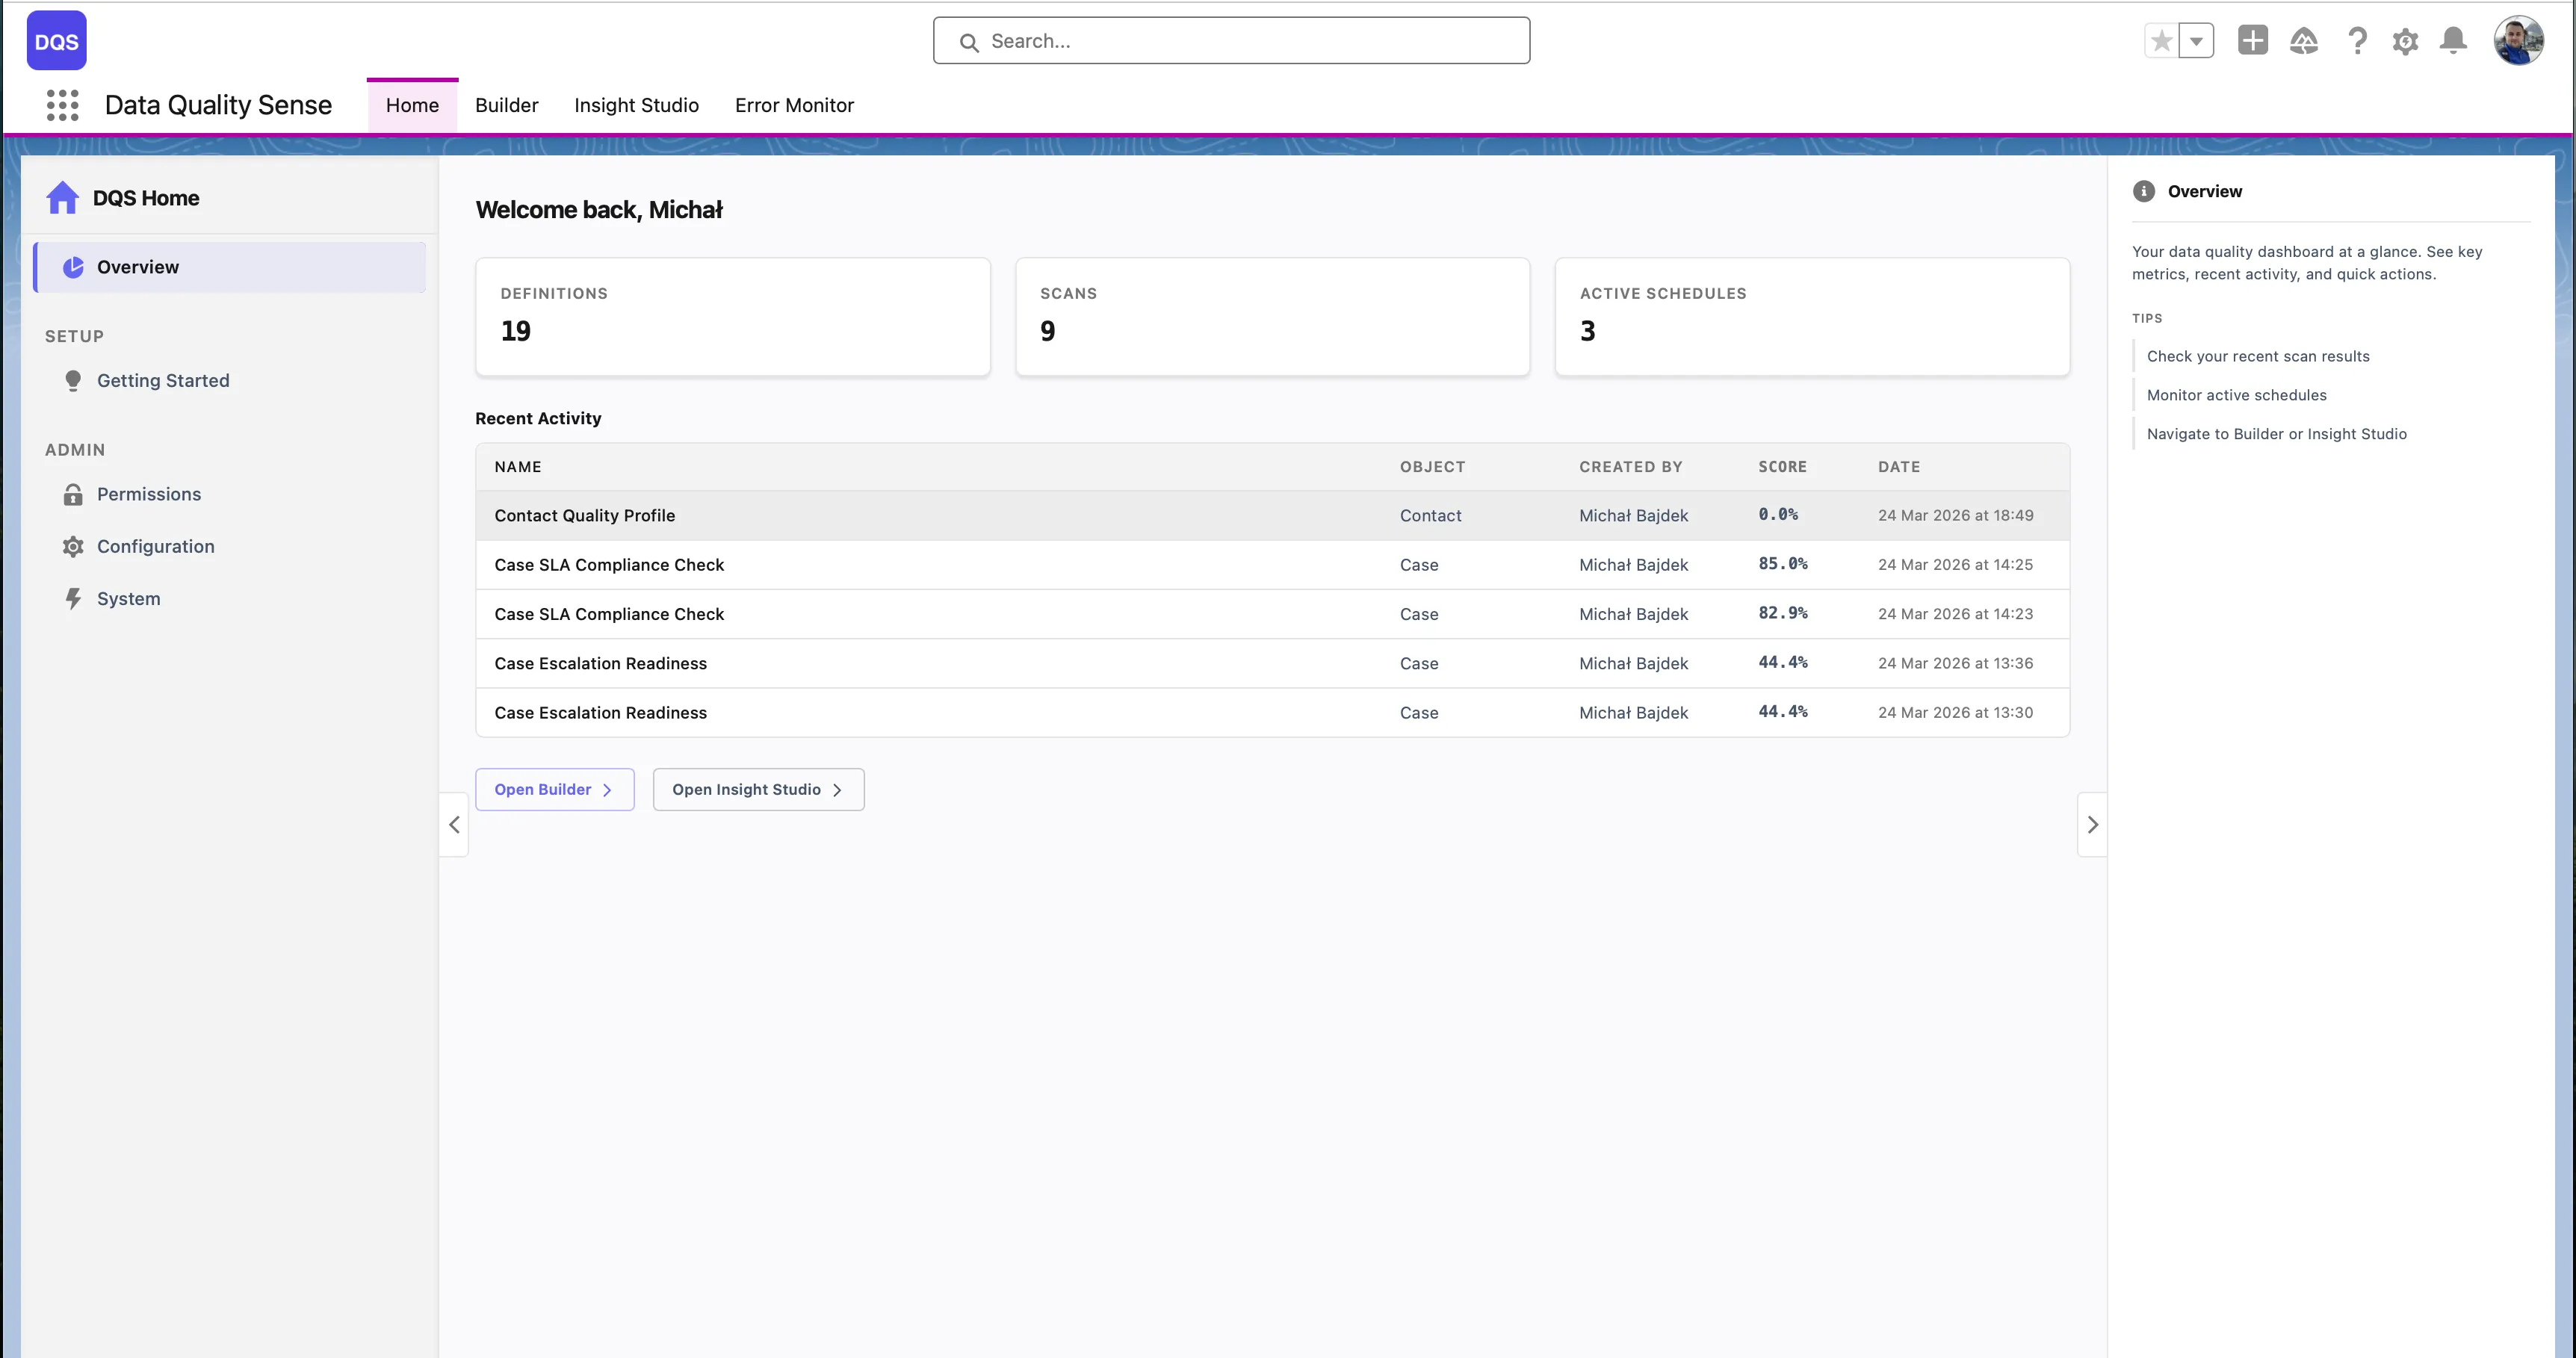
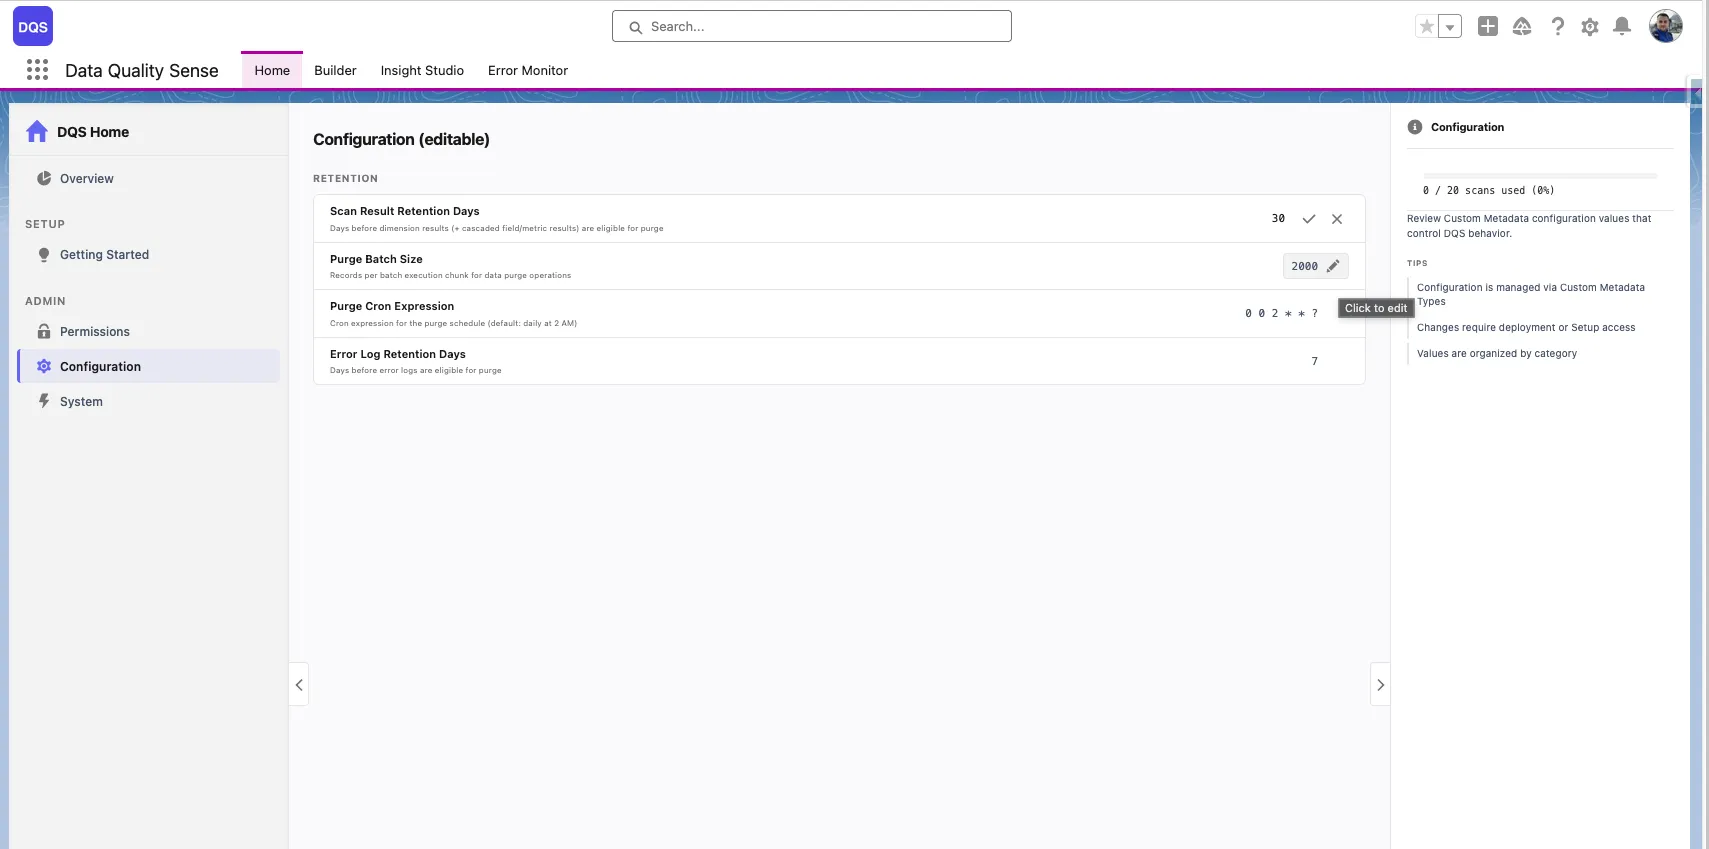
The Home page also includes a Configuration panel where administrators can edit default parameters such as Scan Result Retention Days, Purge Batch Size, Purge CRON Expression, and Error Log Retention Days directly from the UI.
Shows all definitions for a selected object with the overall quality score, last scan date, status, and definition cards. Compare different scan configurations and their results side by side.
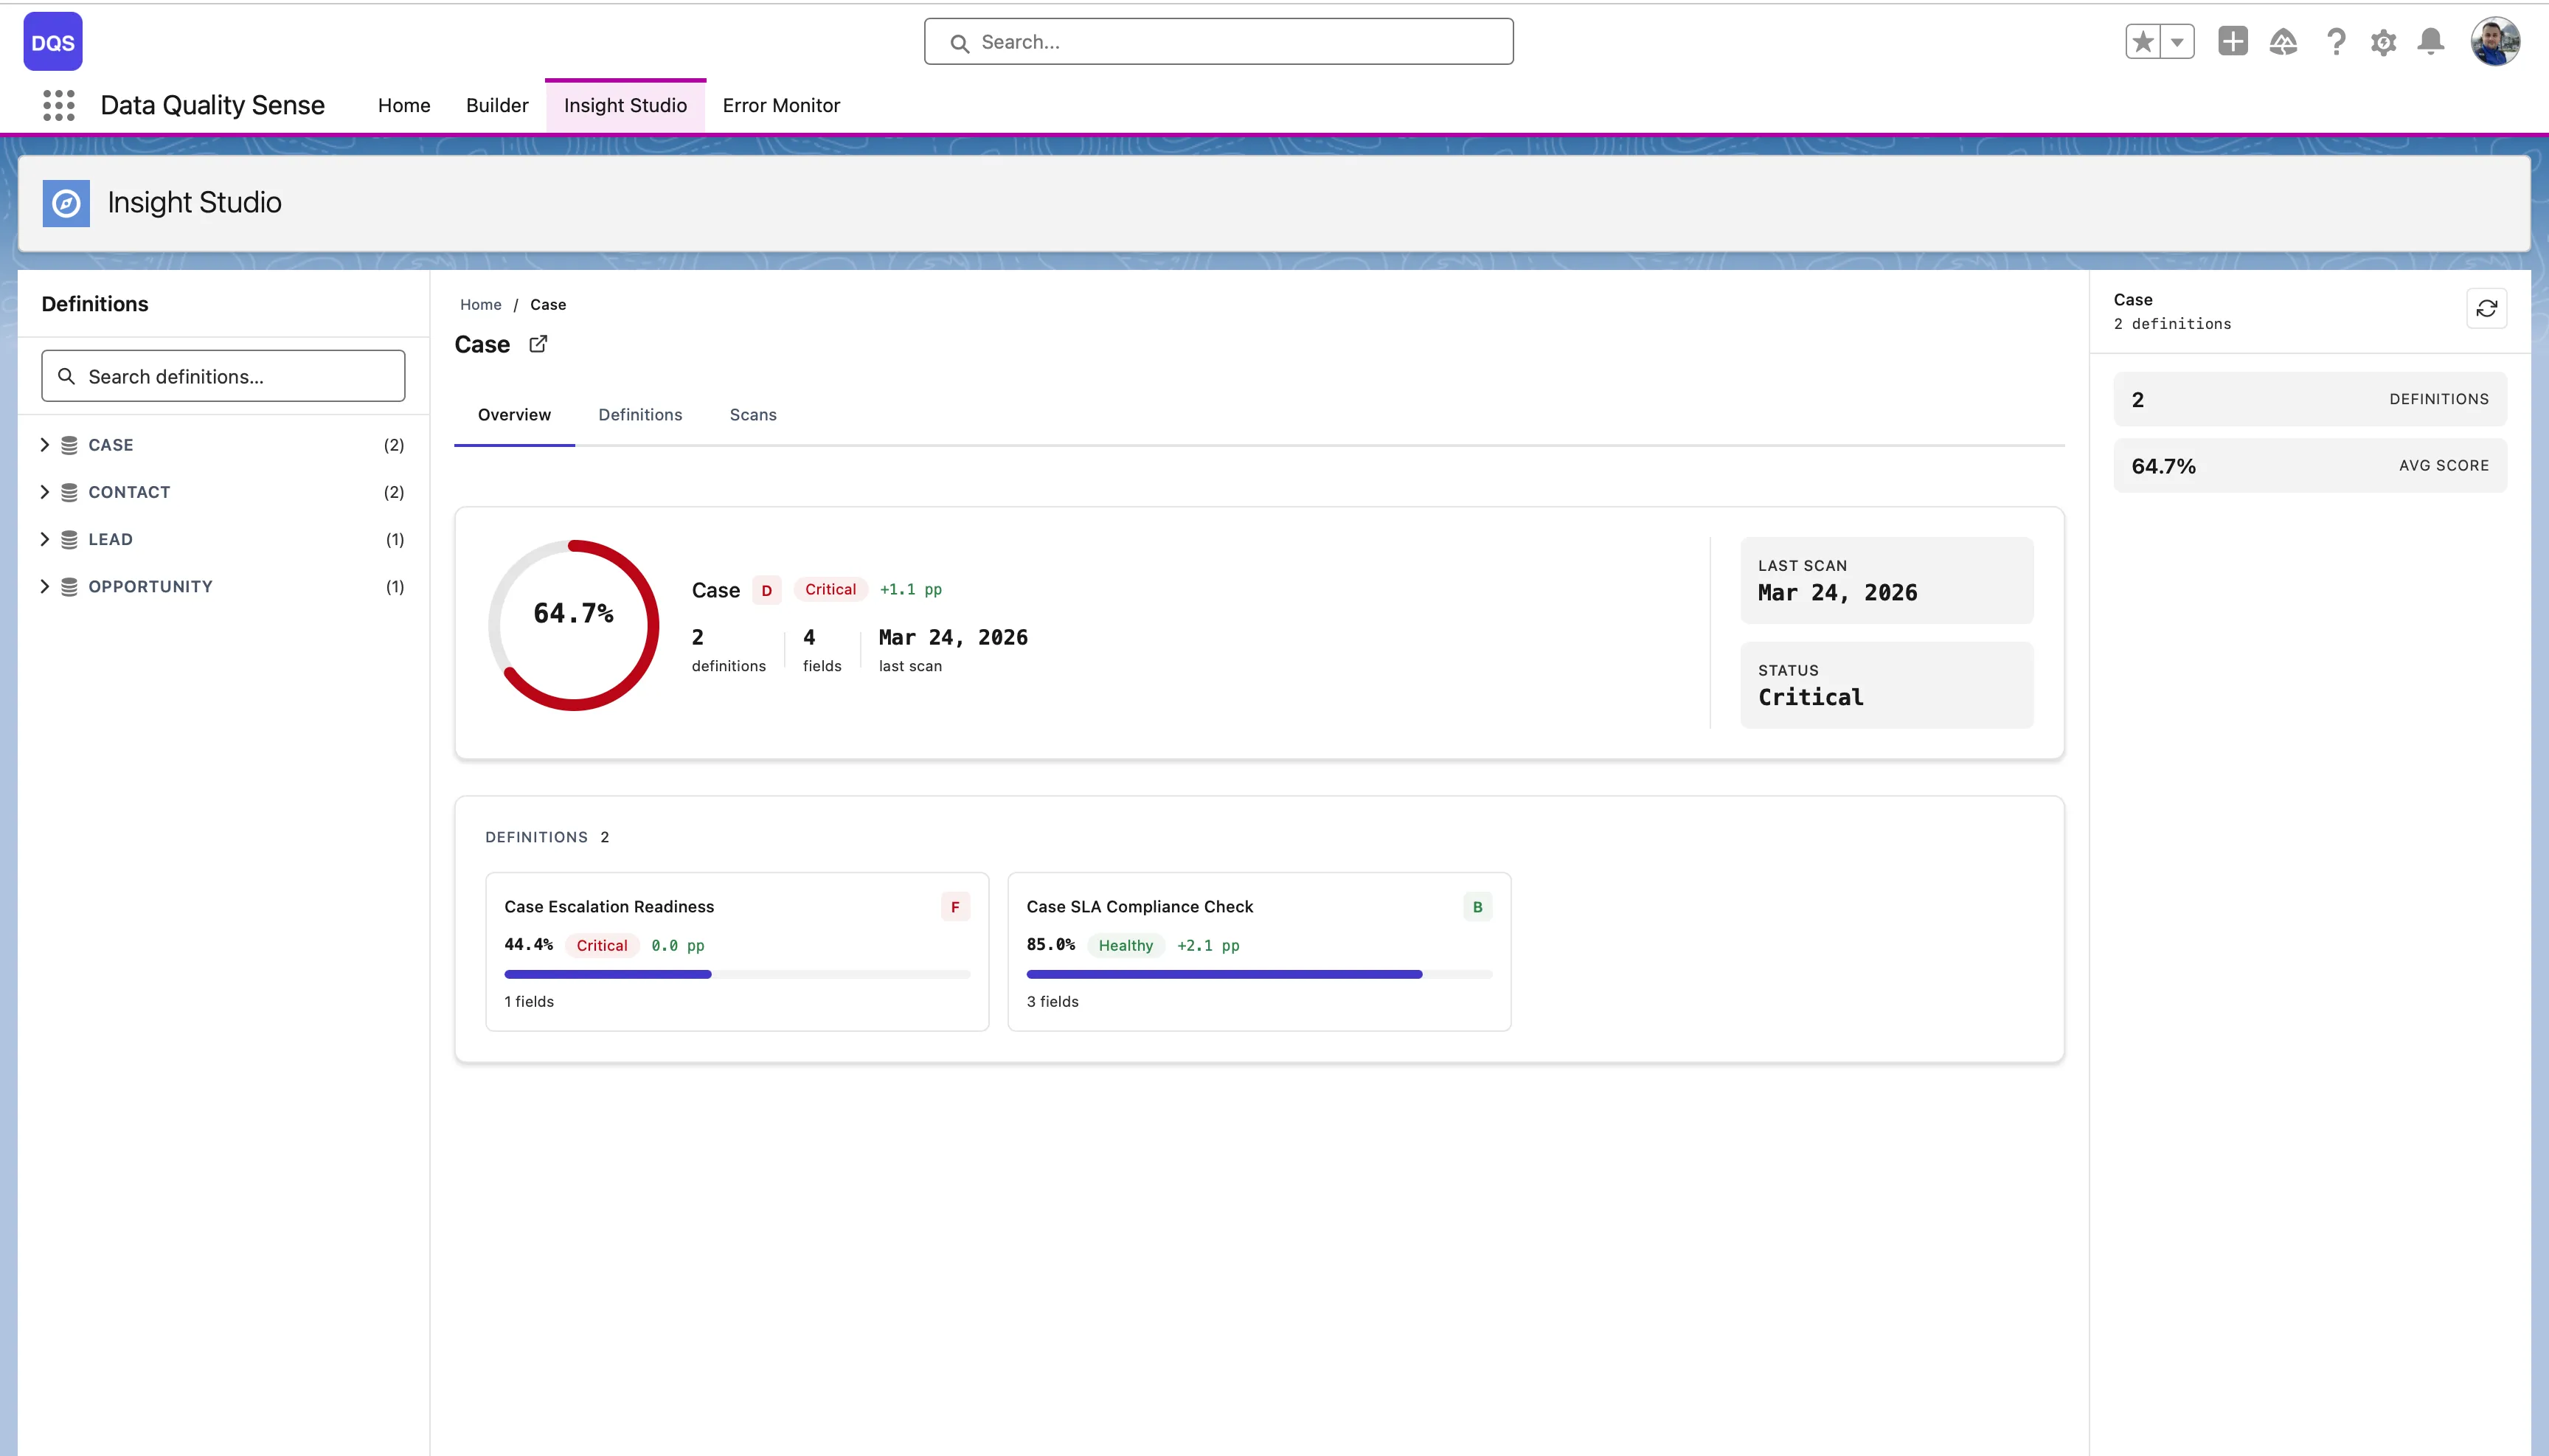
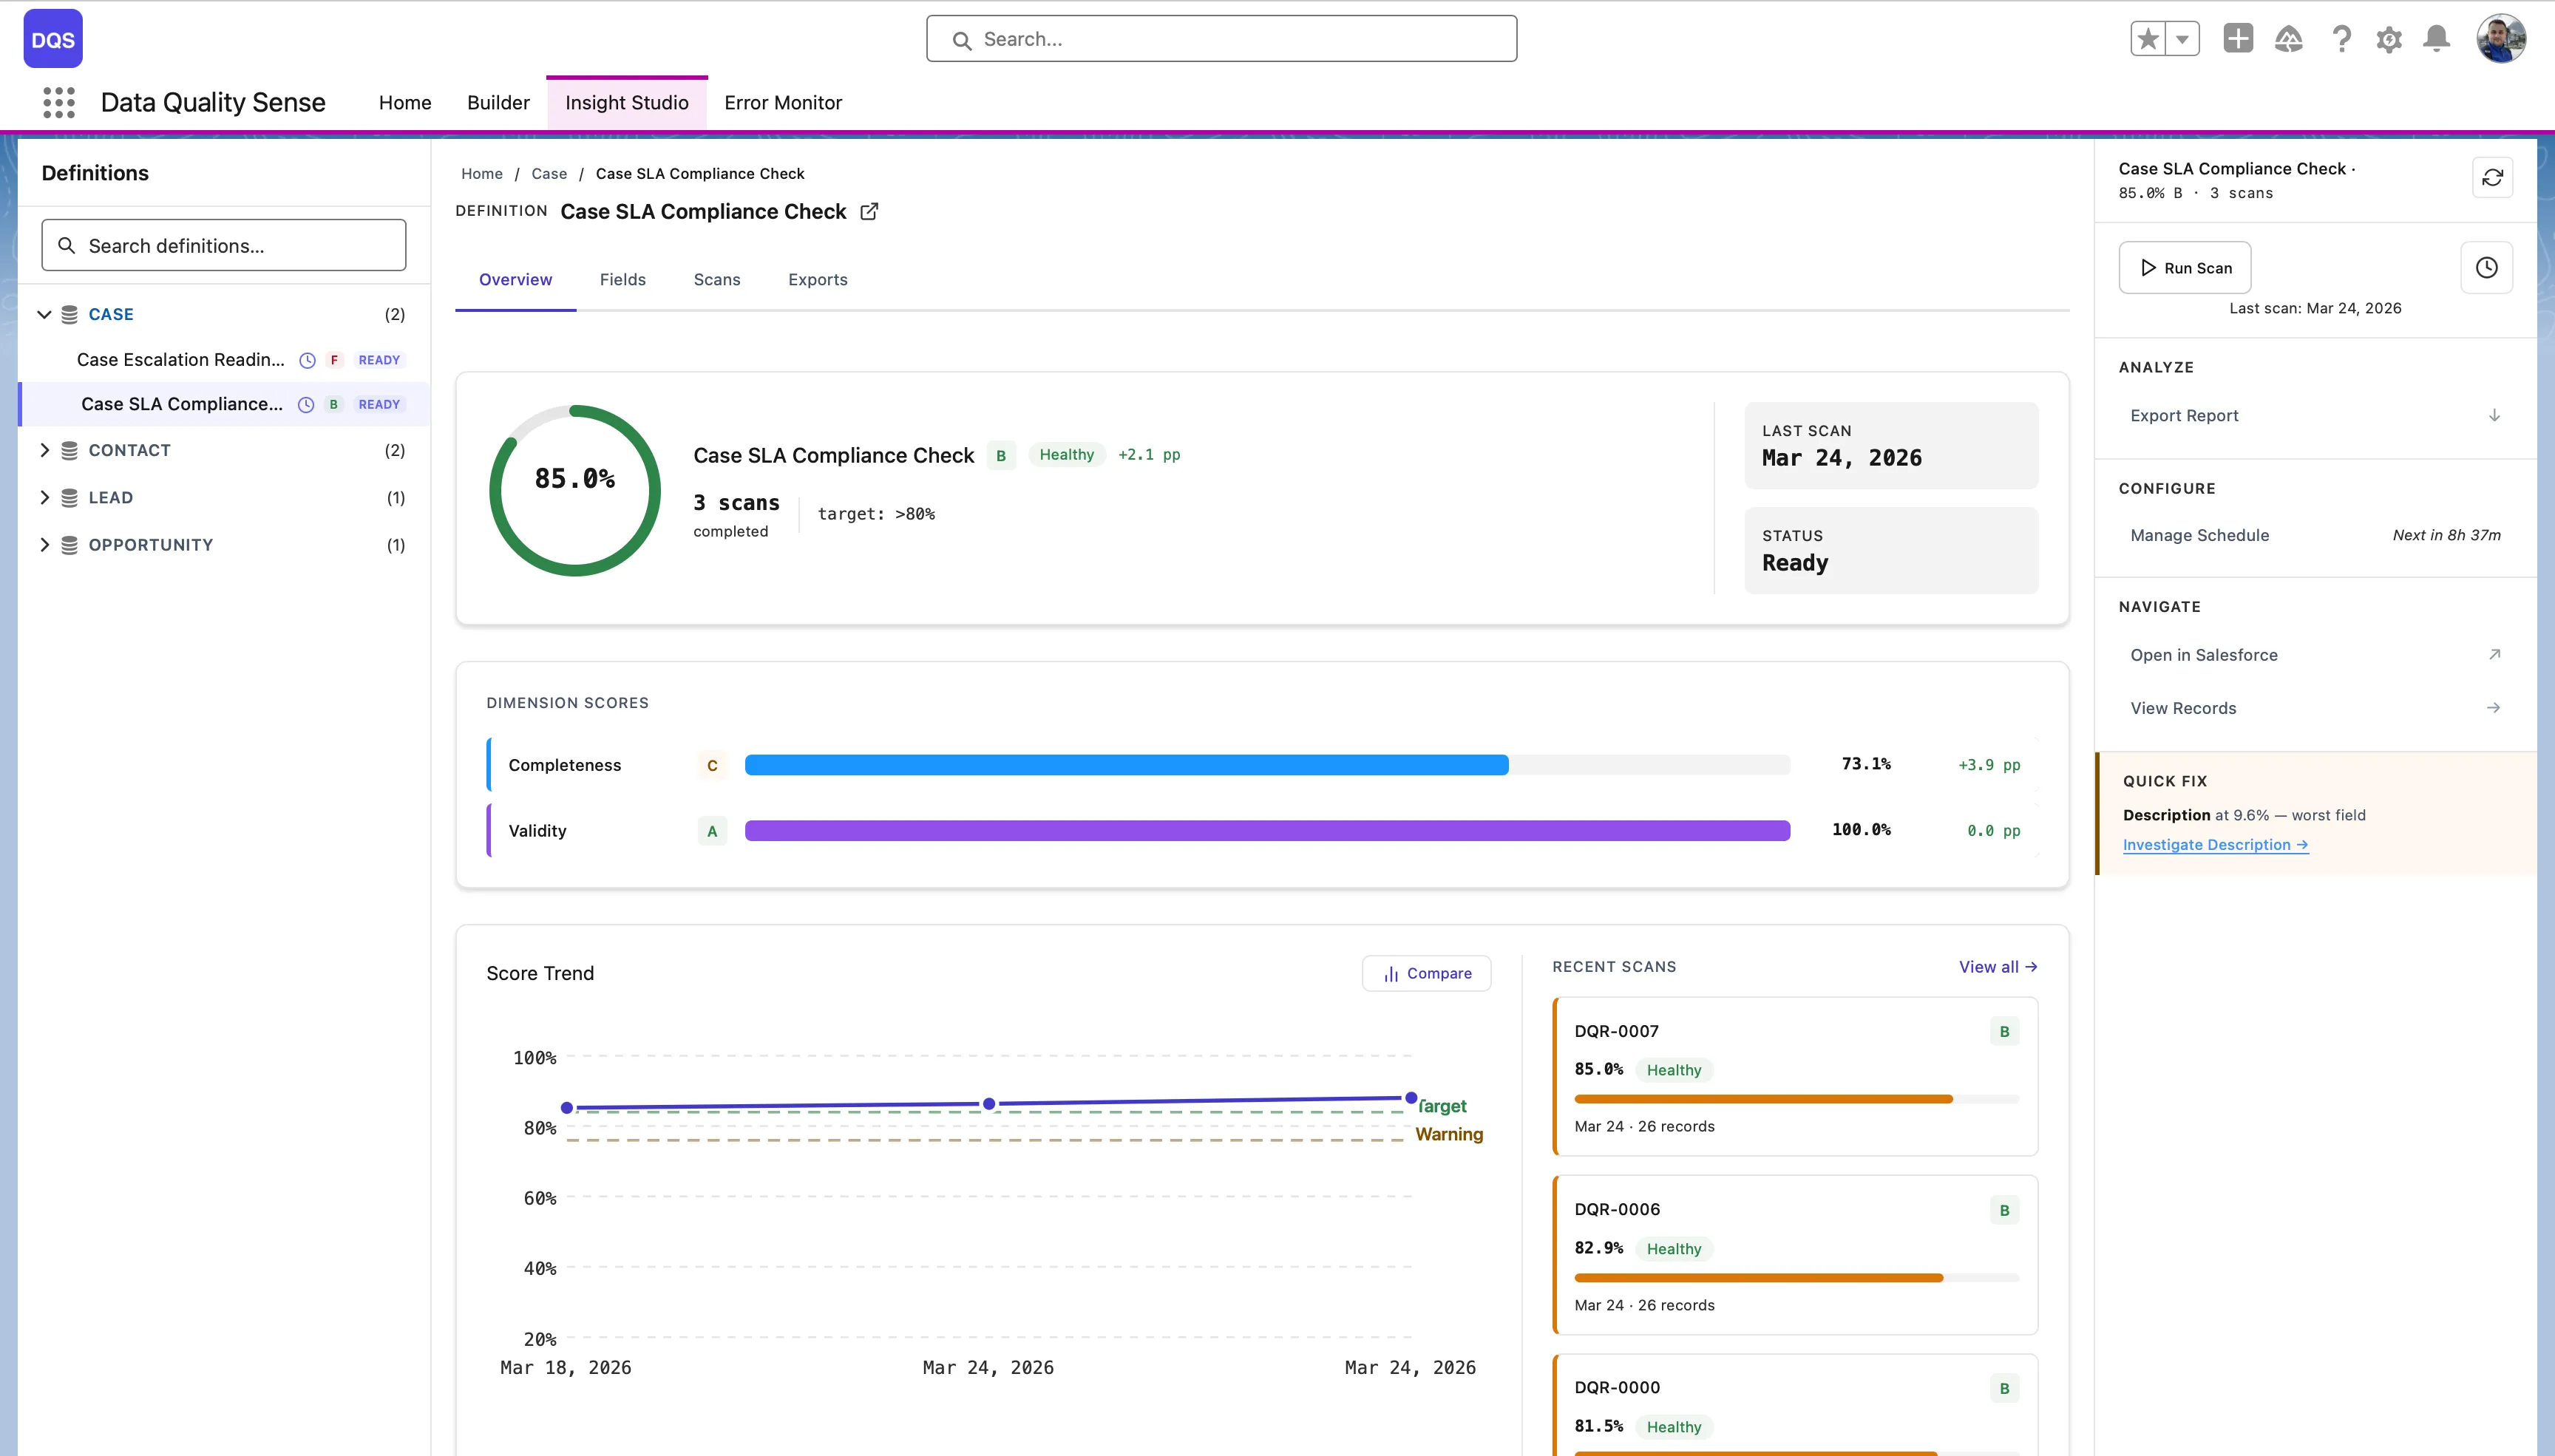
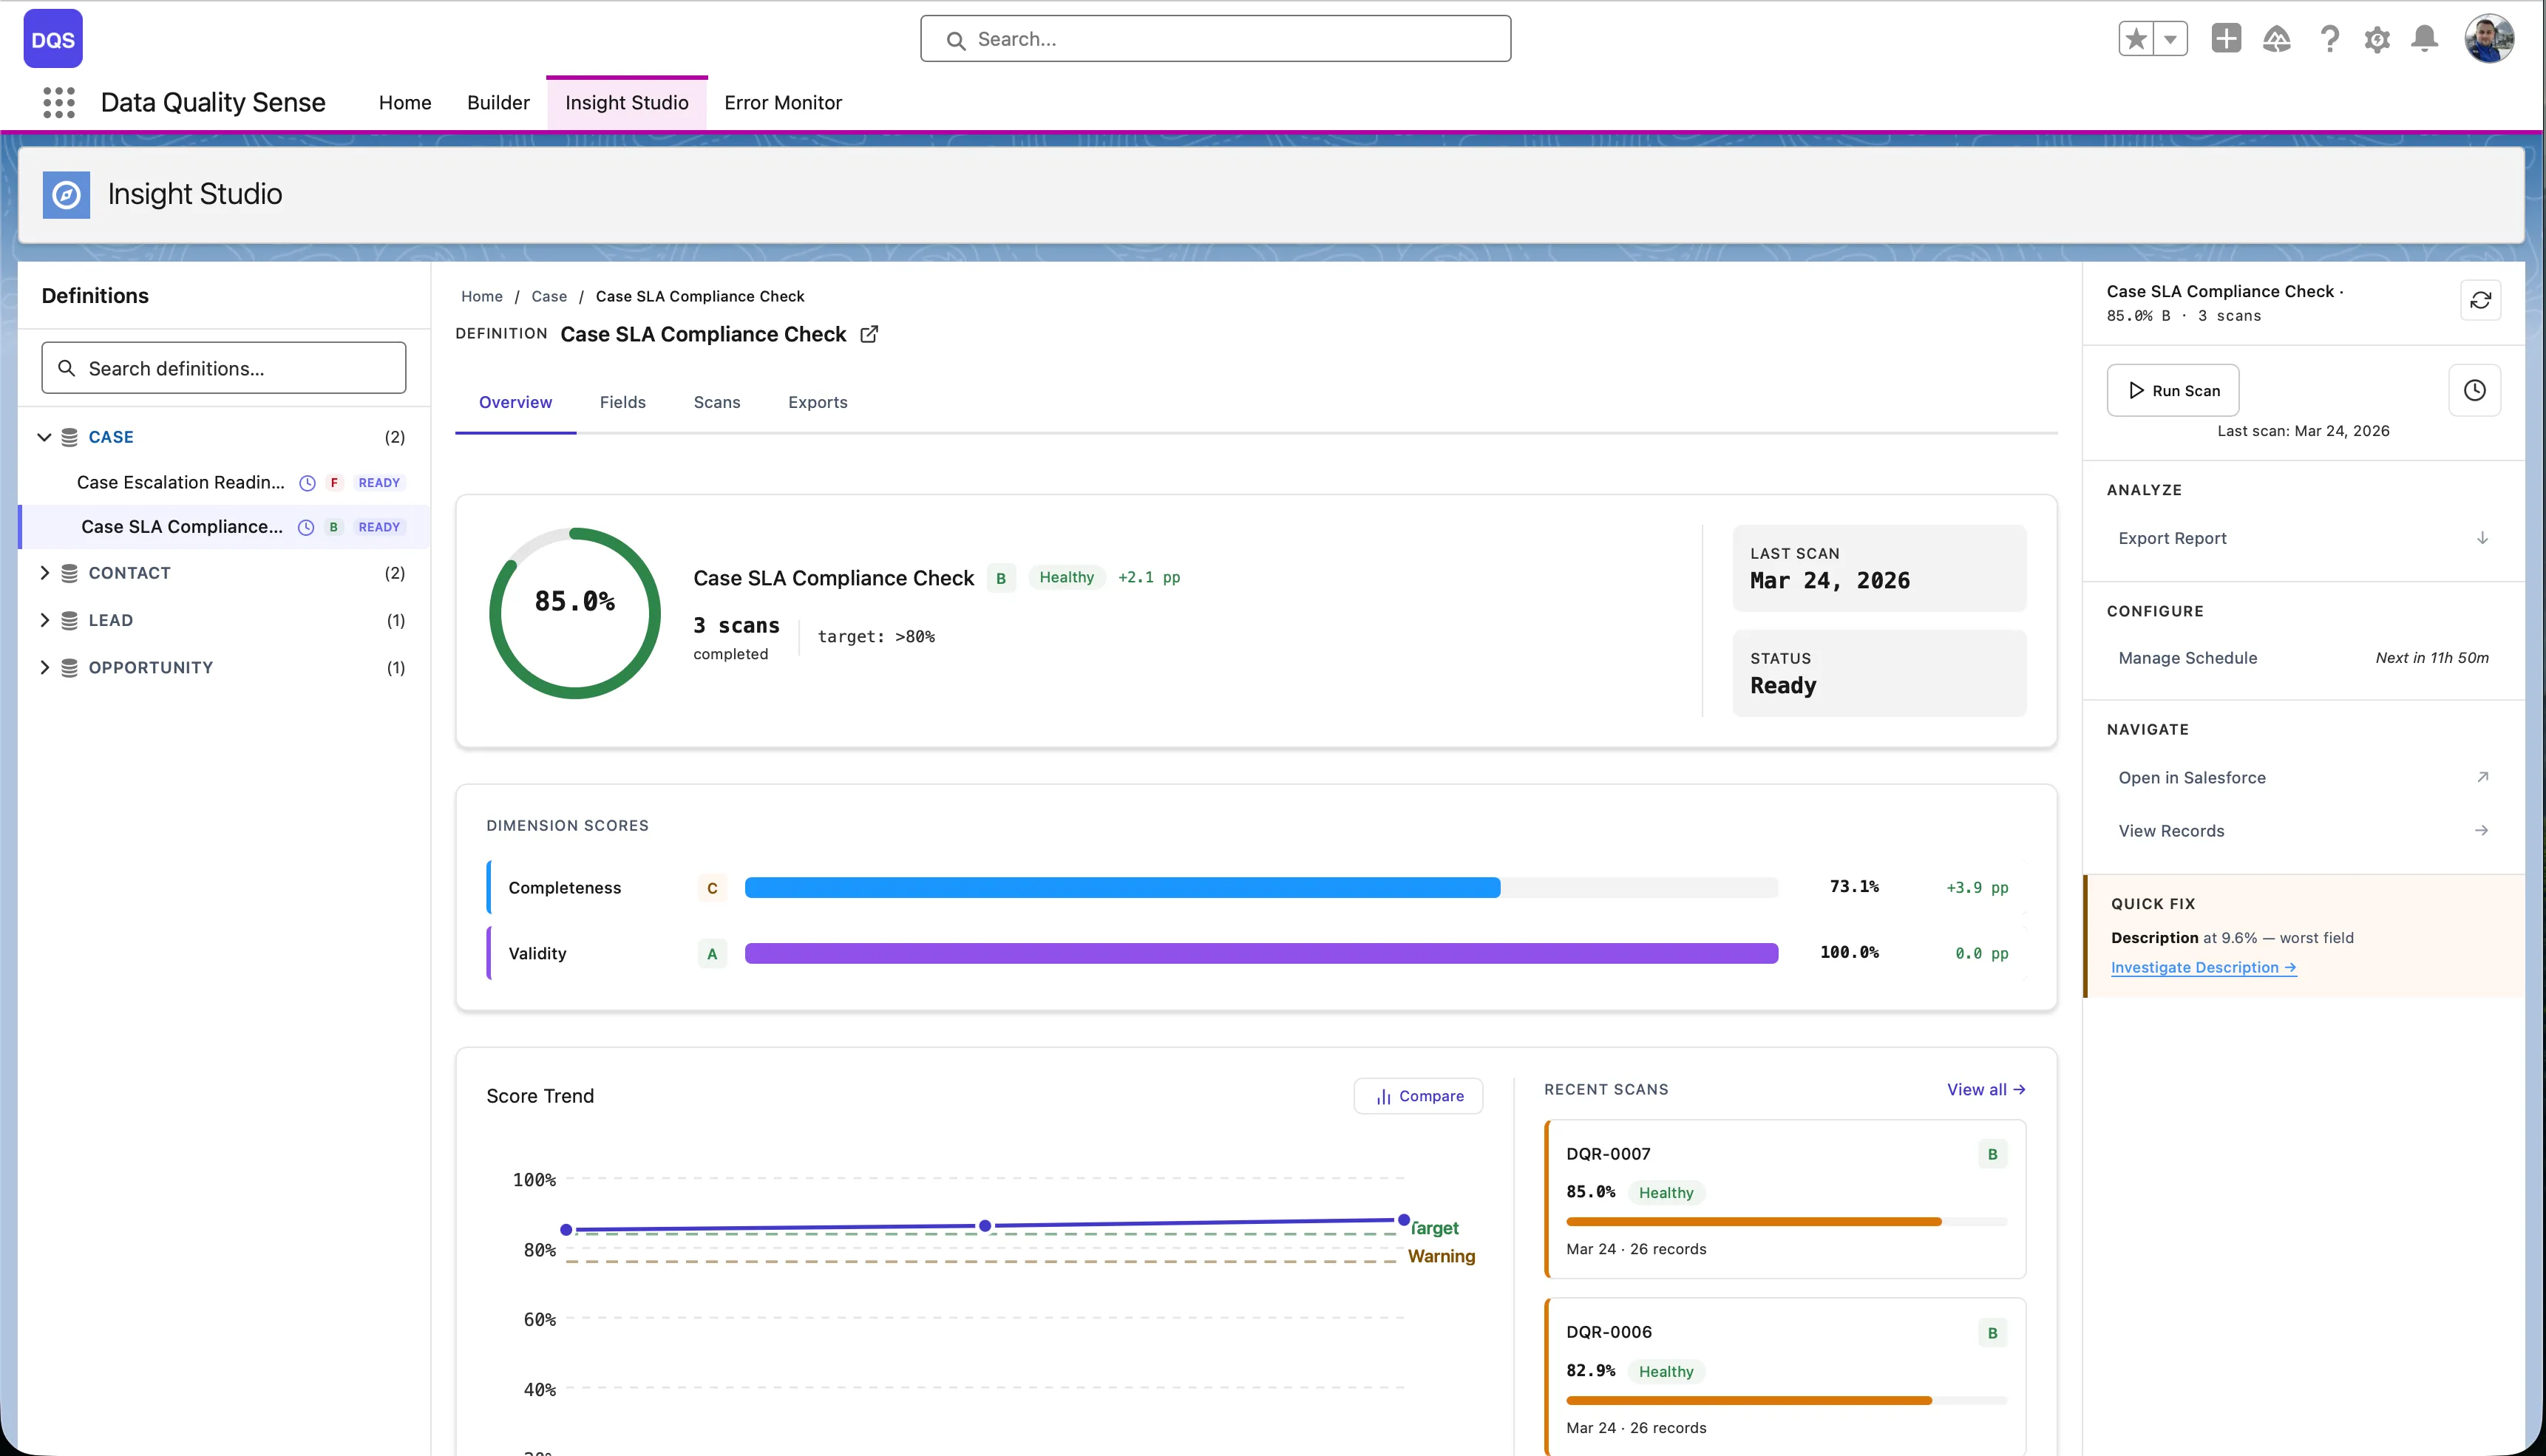
The main dashboard for a single definition. It has four tabs:
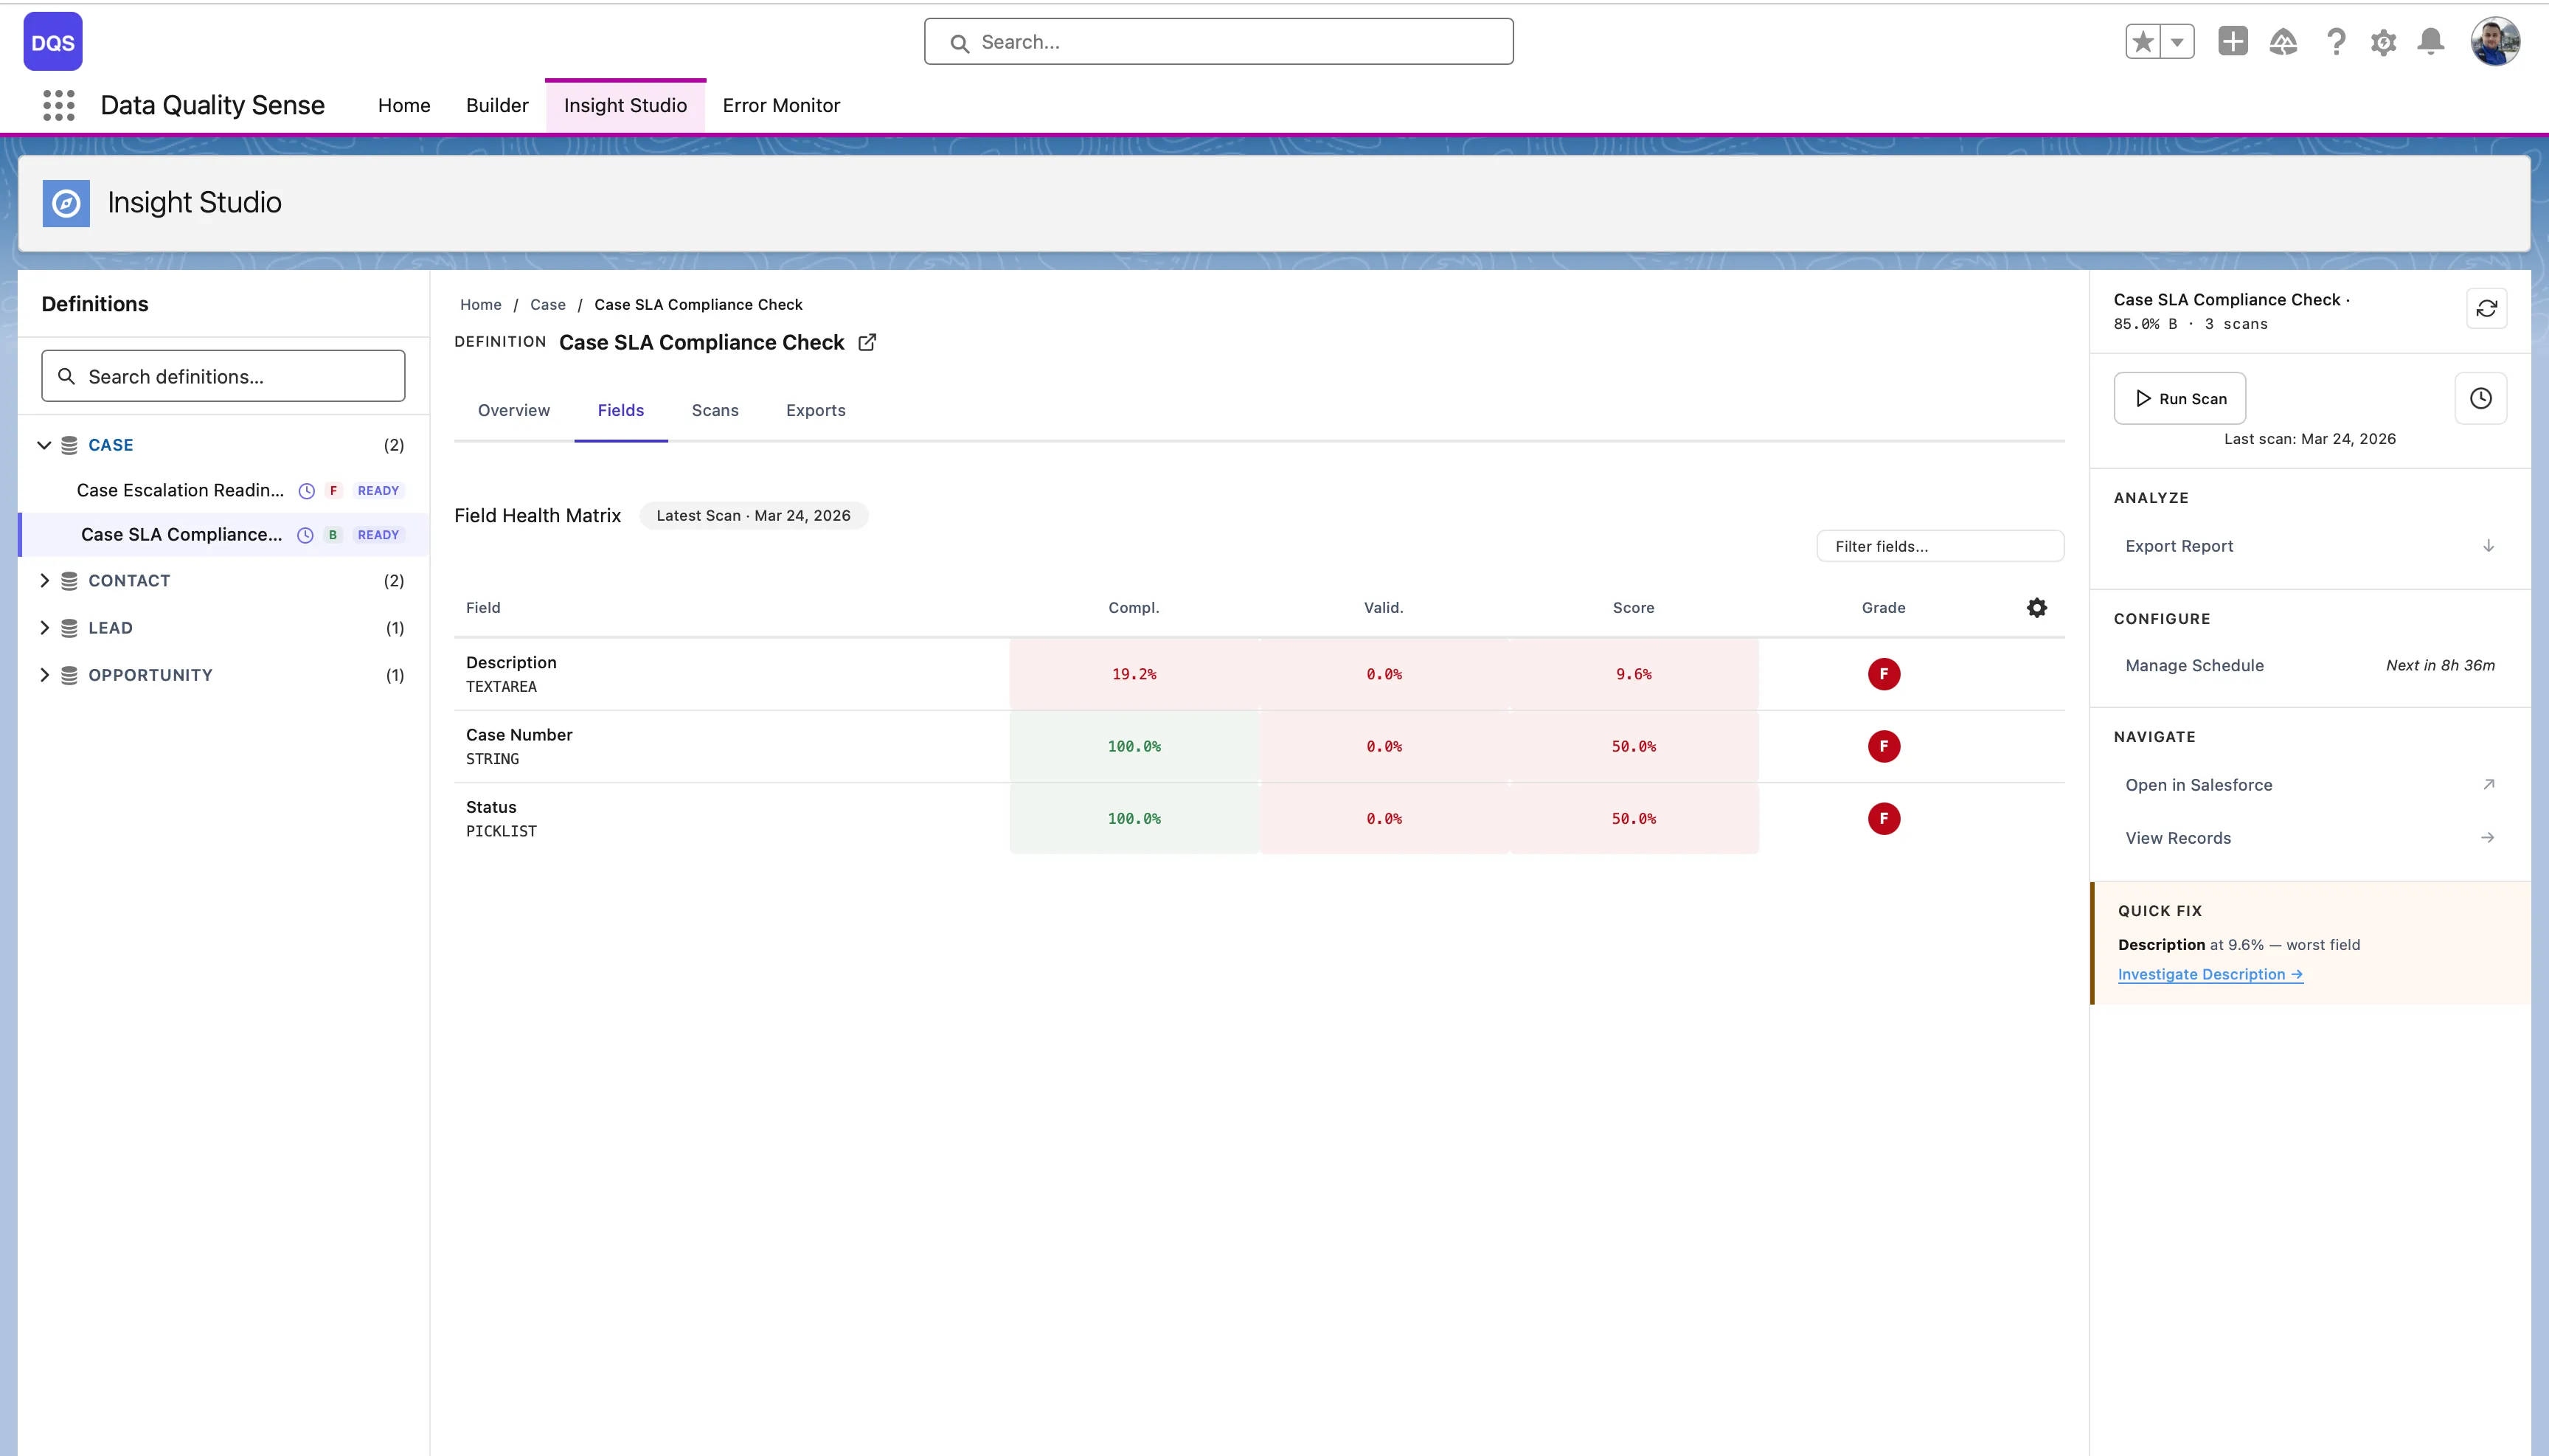
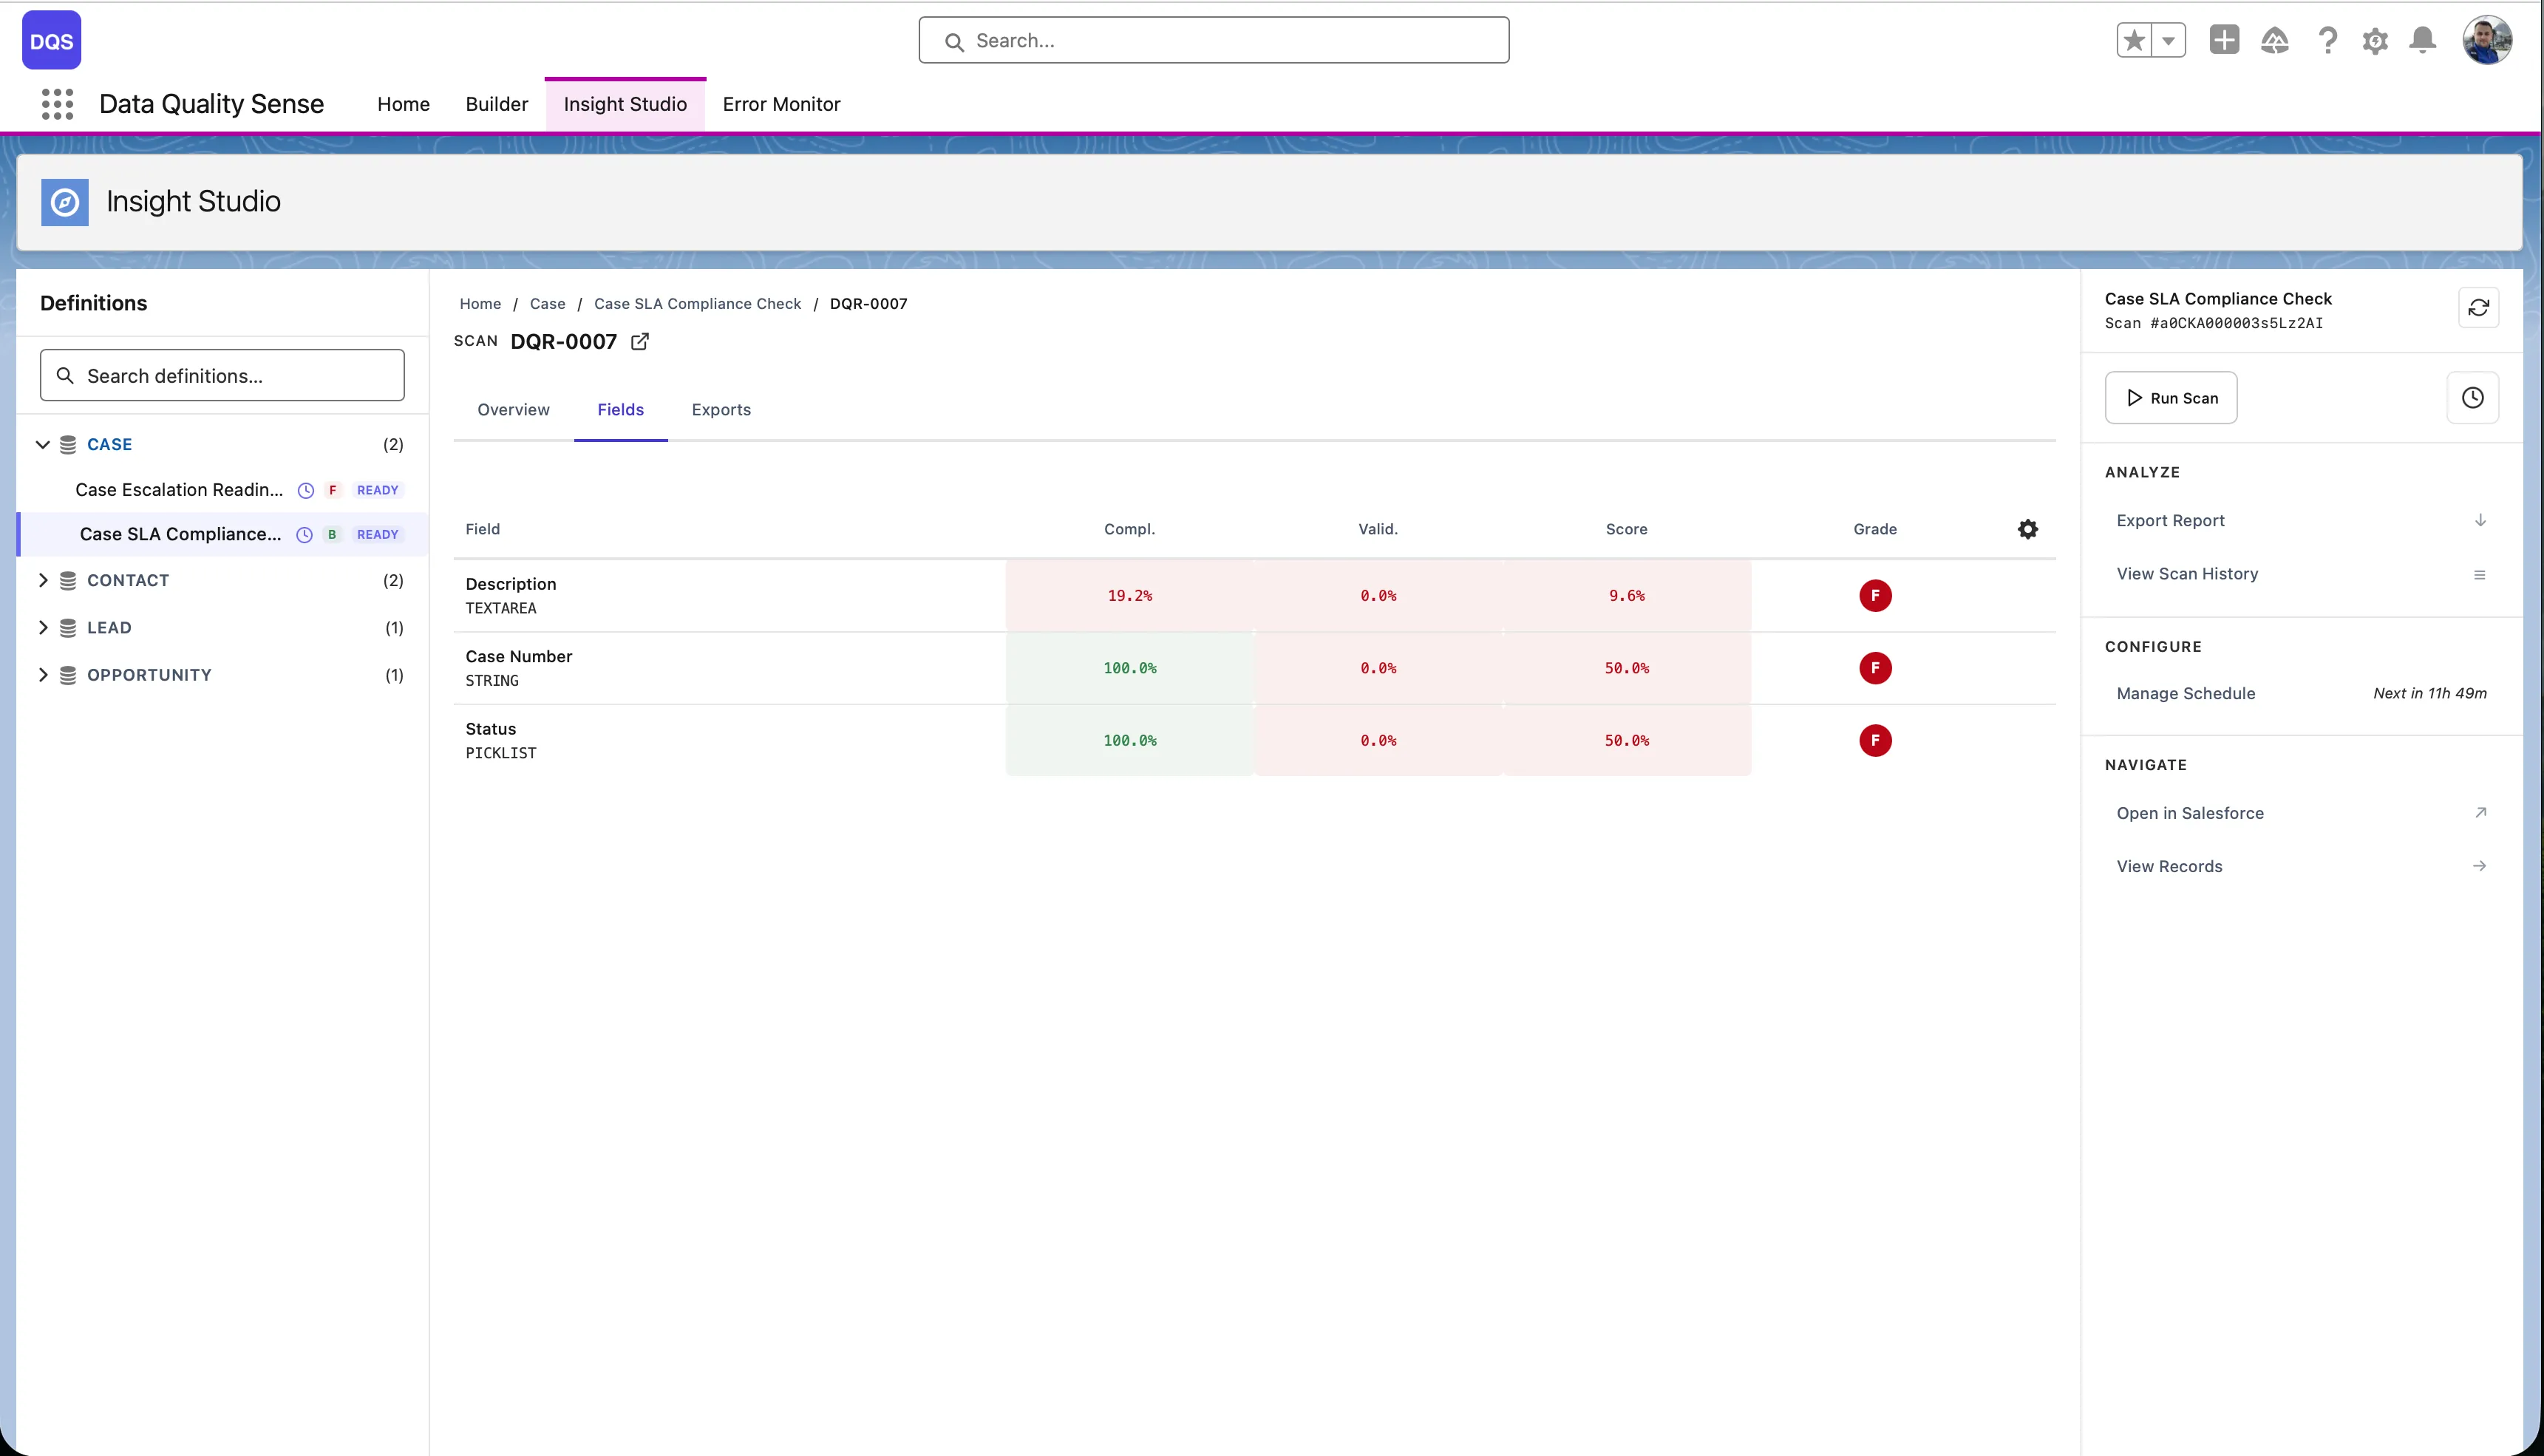
The Fields tab shows each field’s score per dimension in a color-coded matrix — red for poor, green for good. Use it to quickly spot the weakest fields.
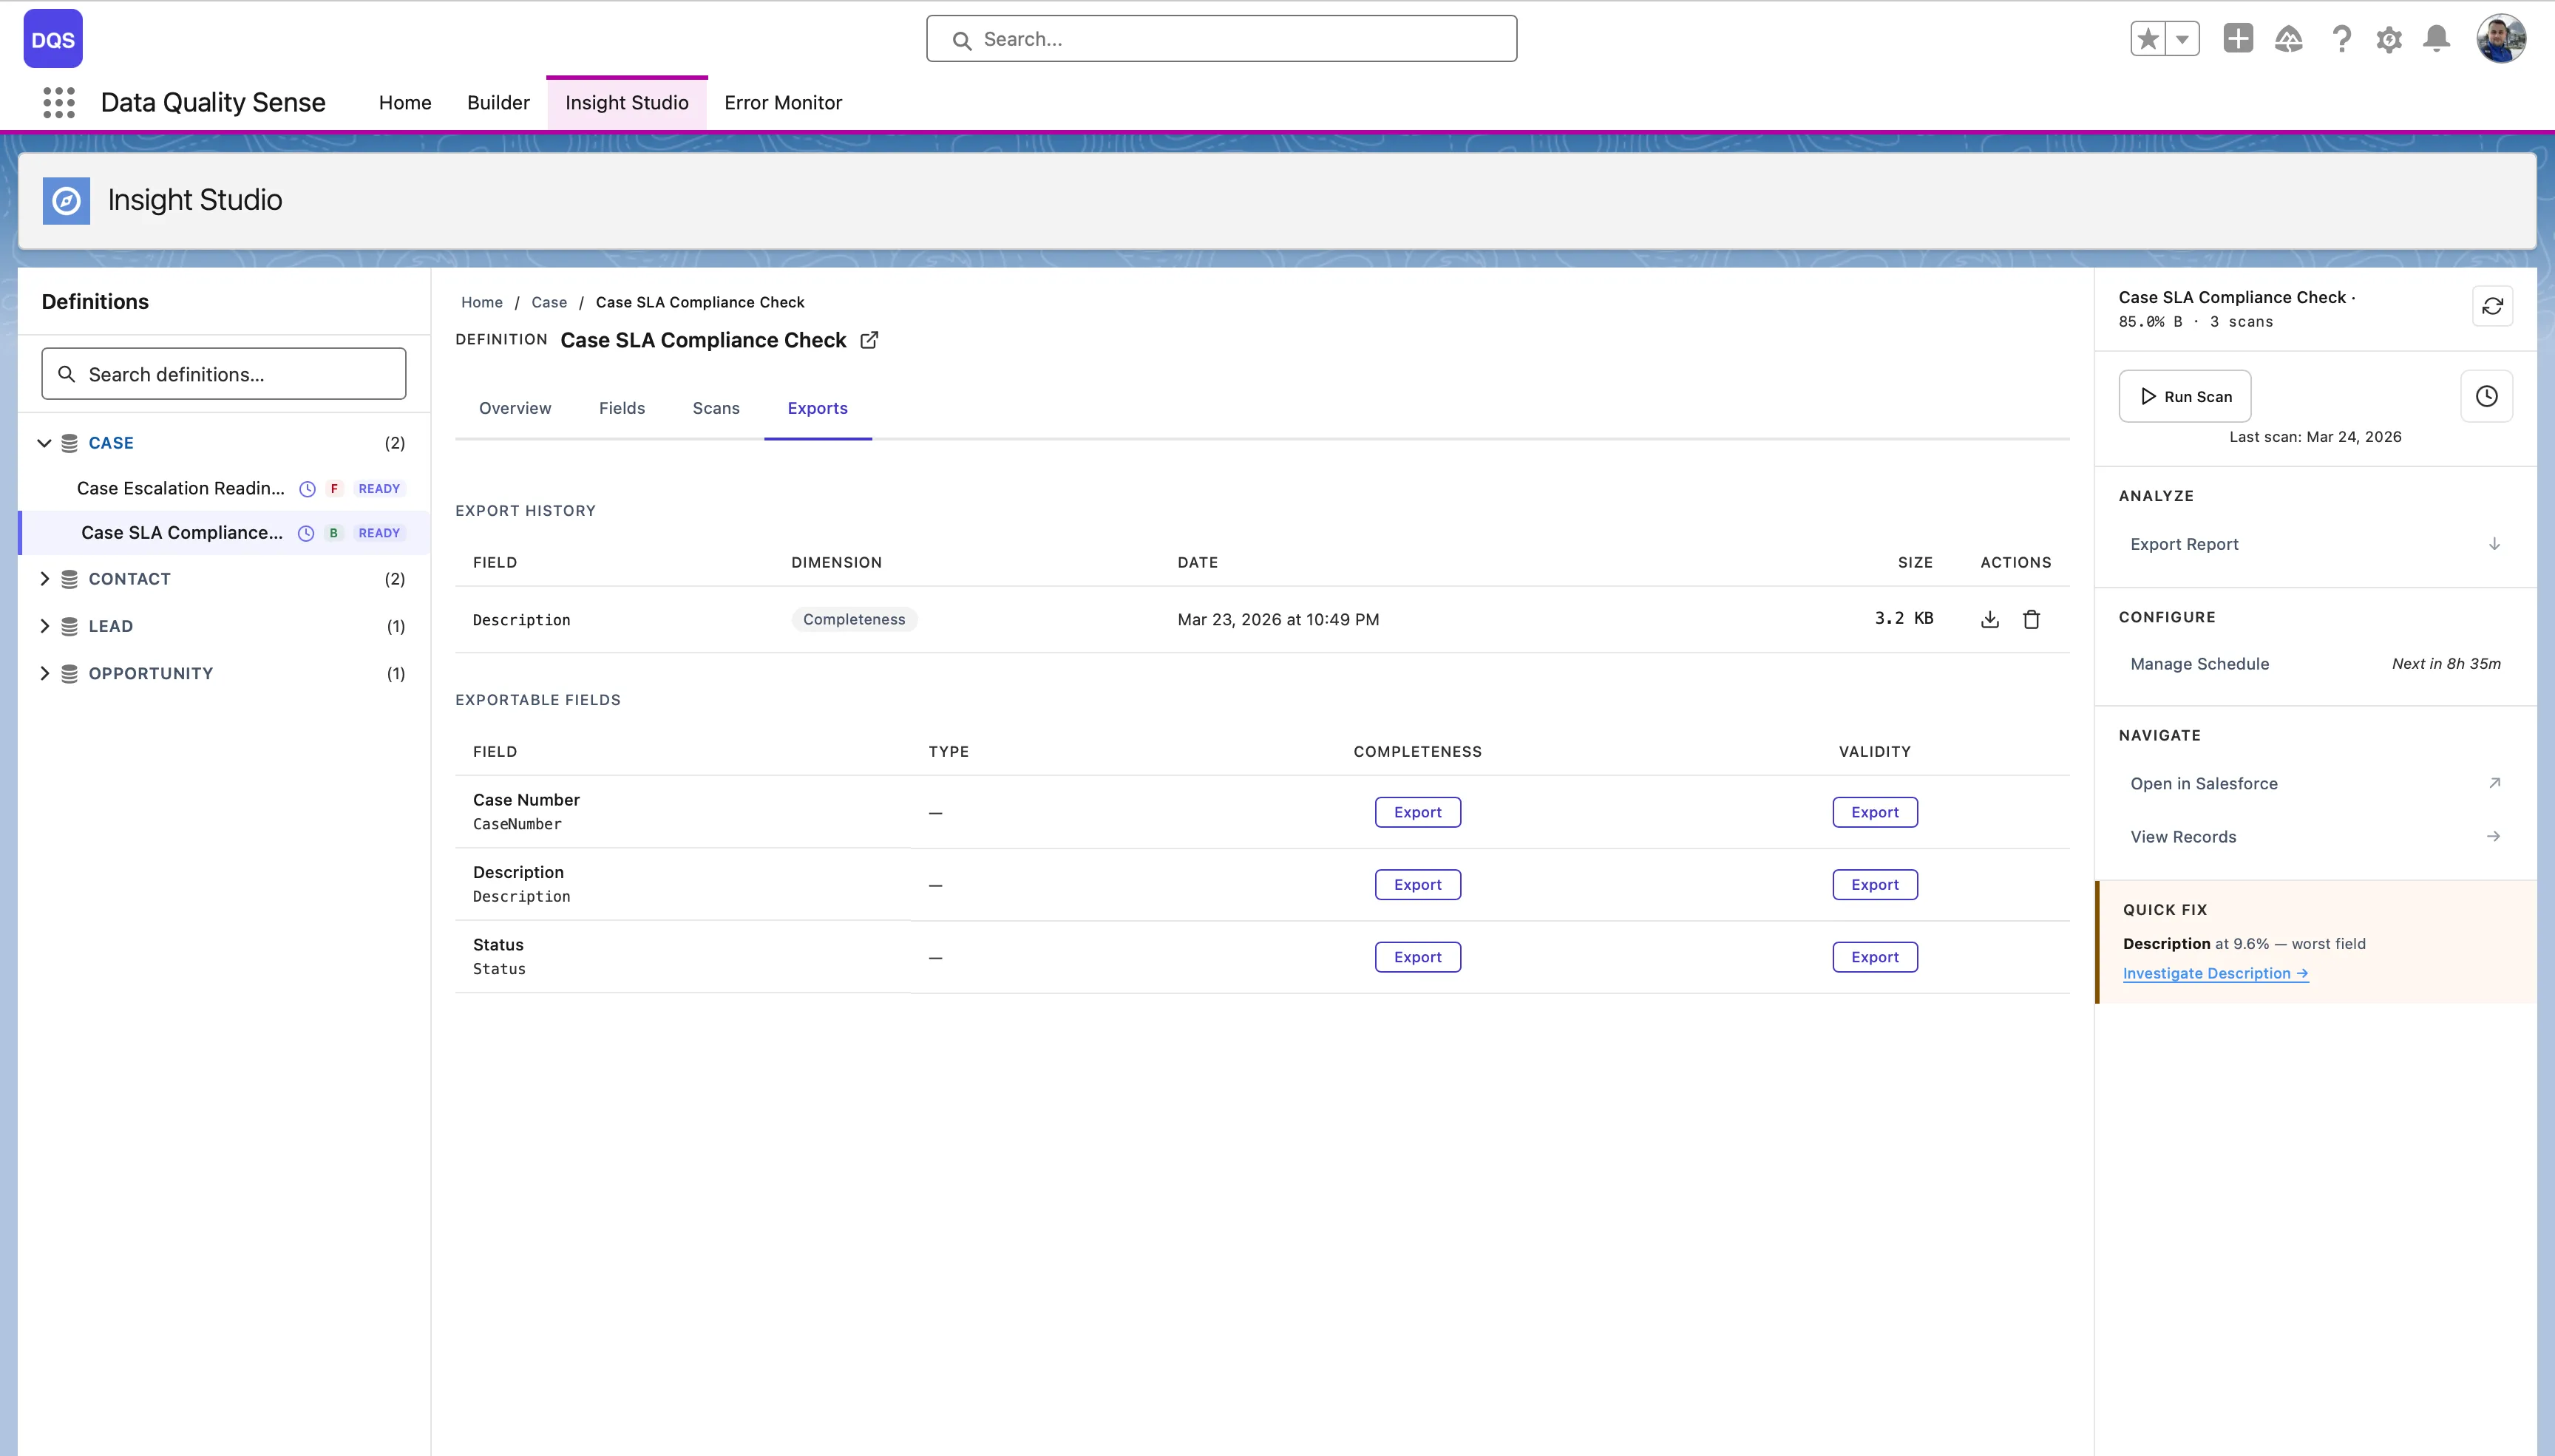
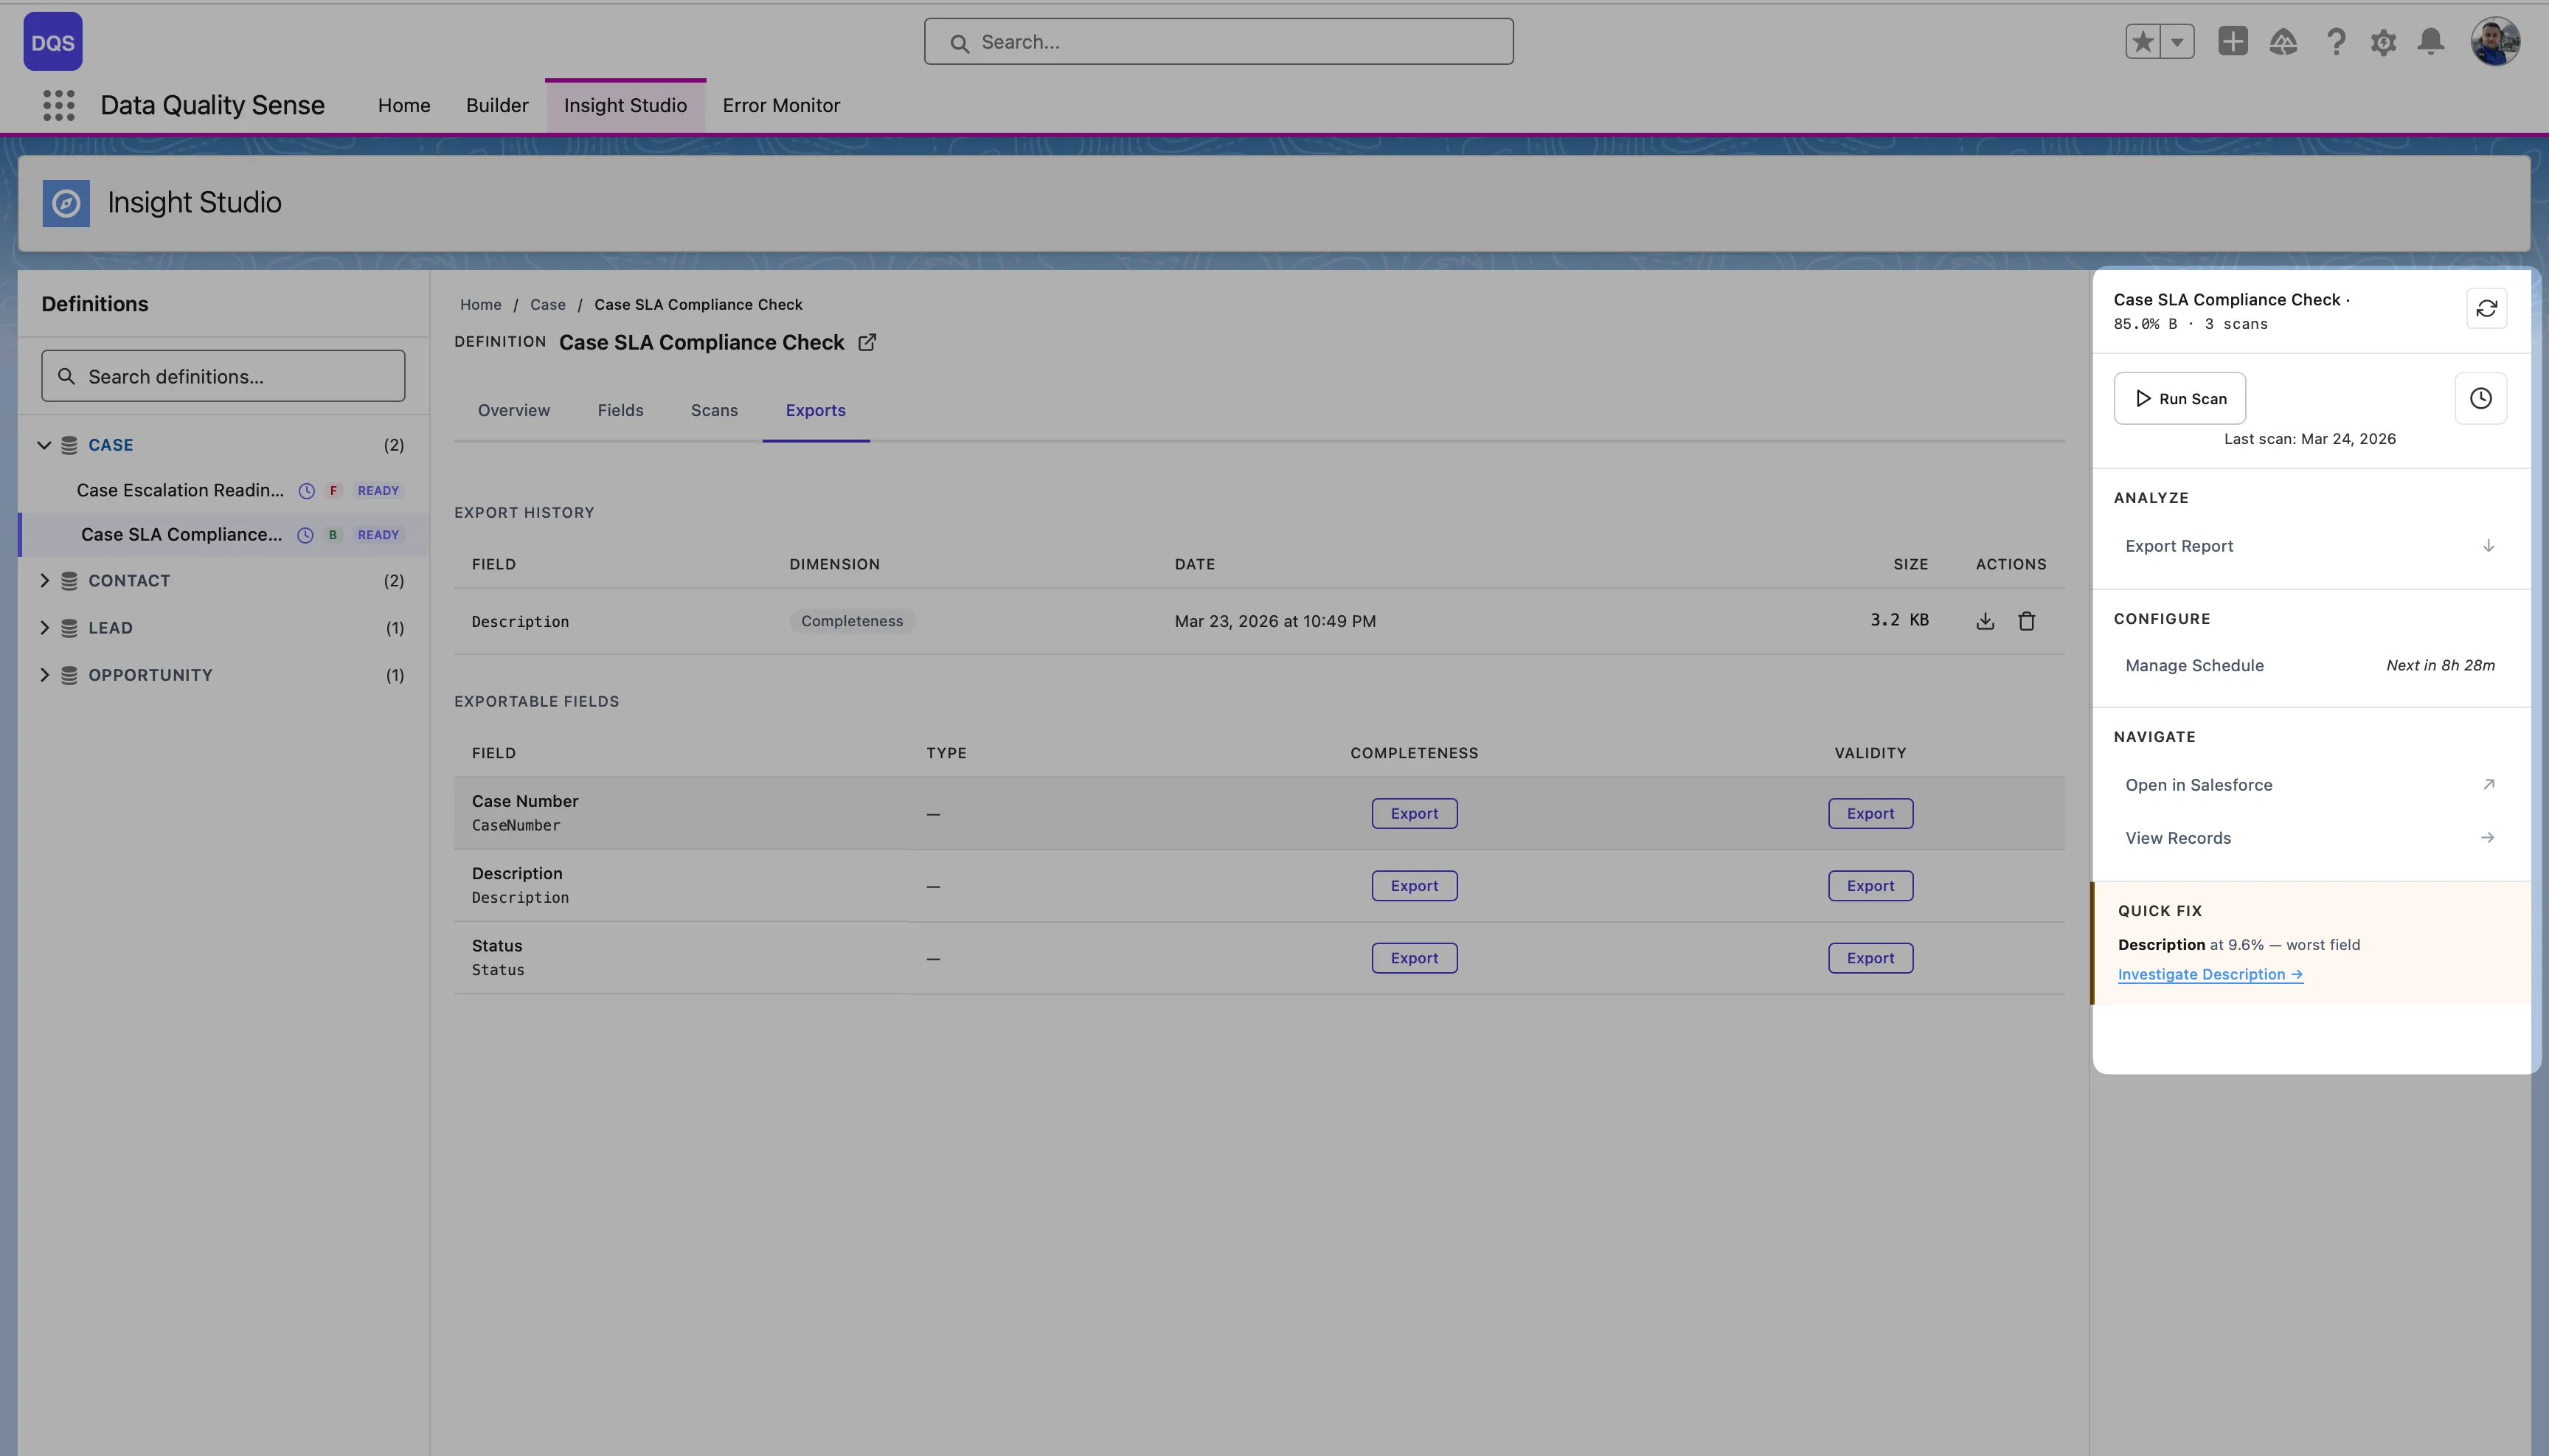
The Exports tab lists available exports per dimension and field, with download buttons and export history.
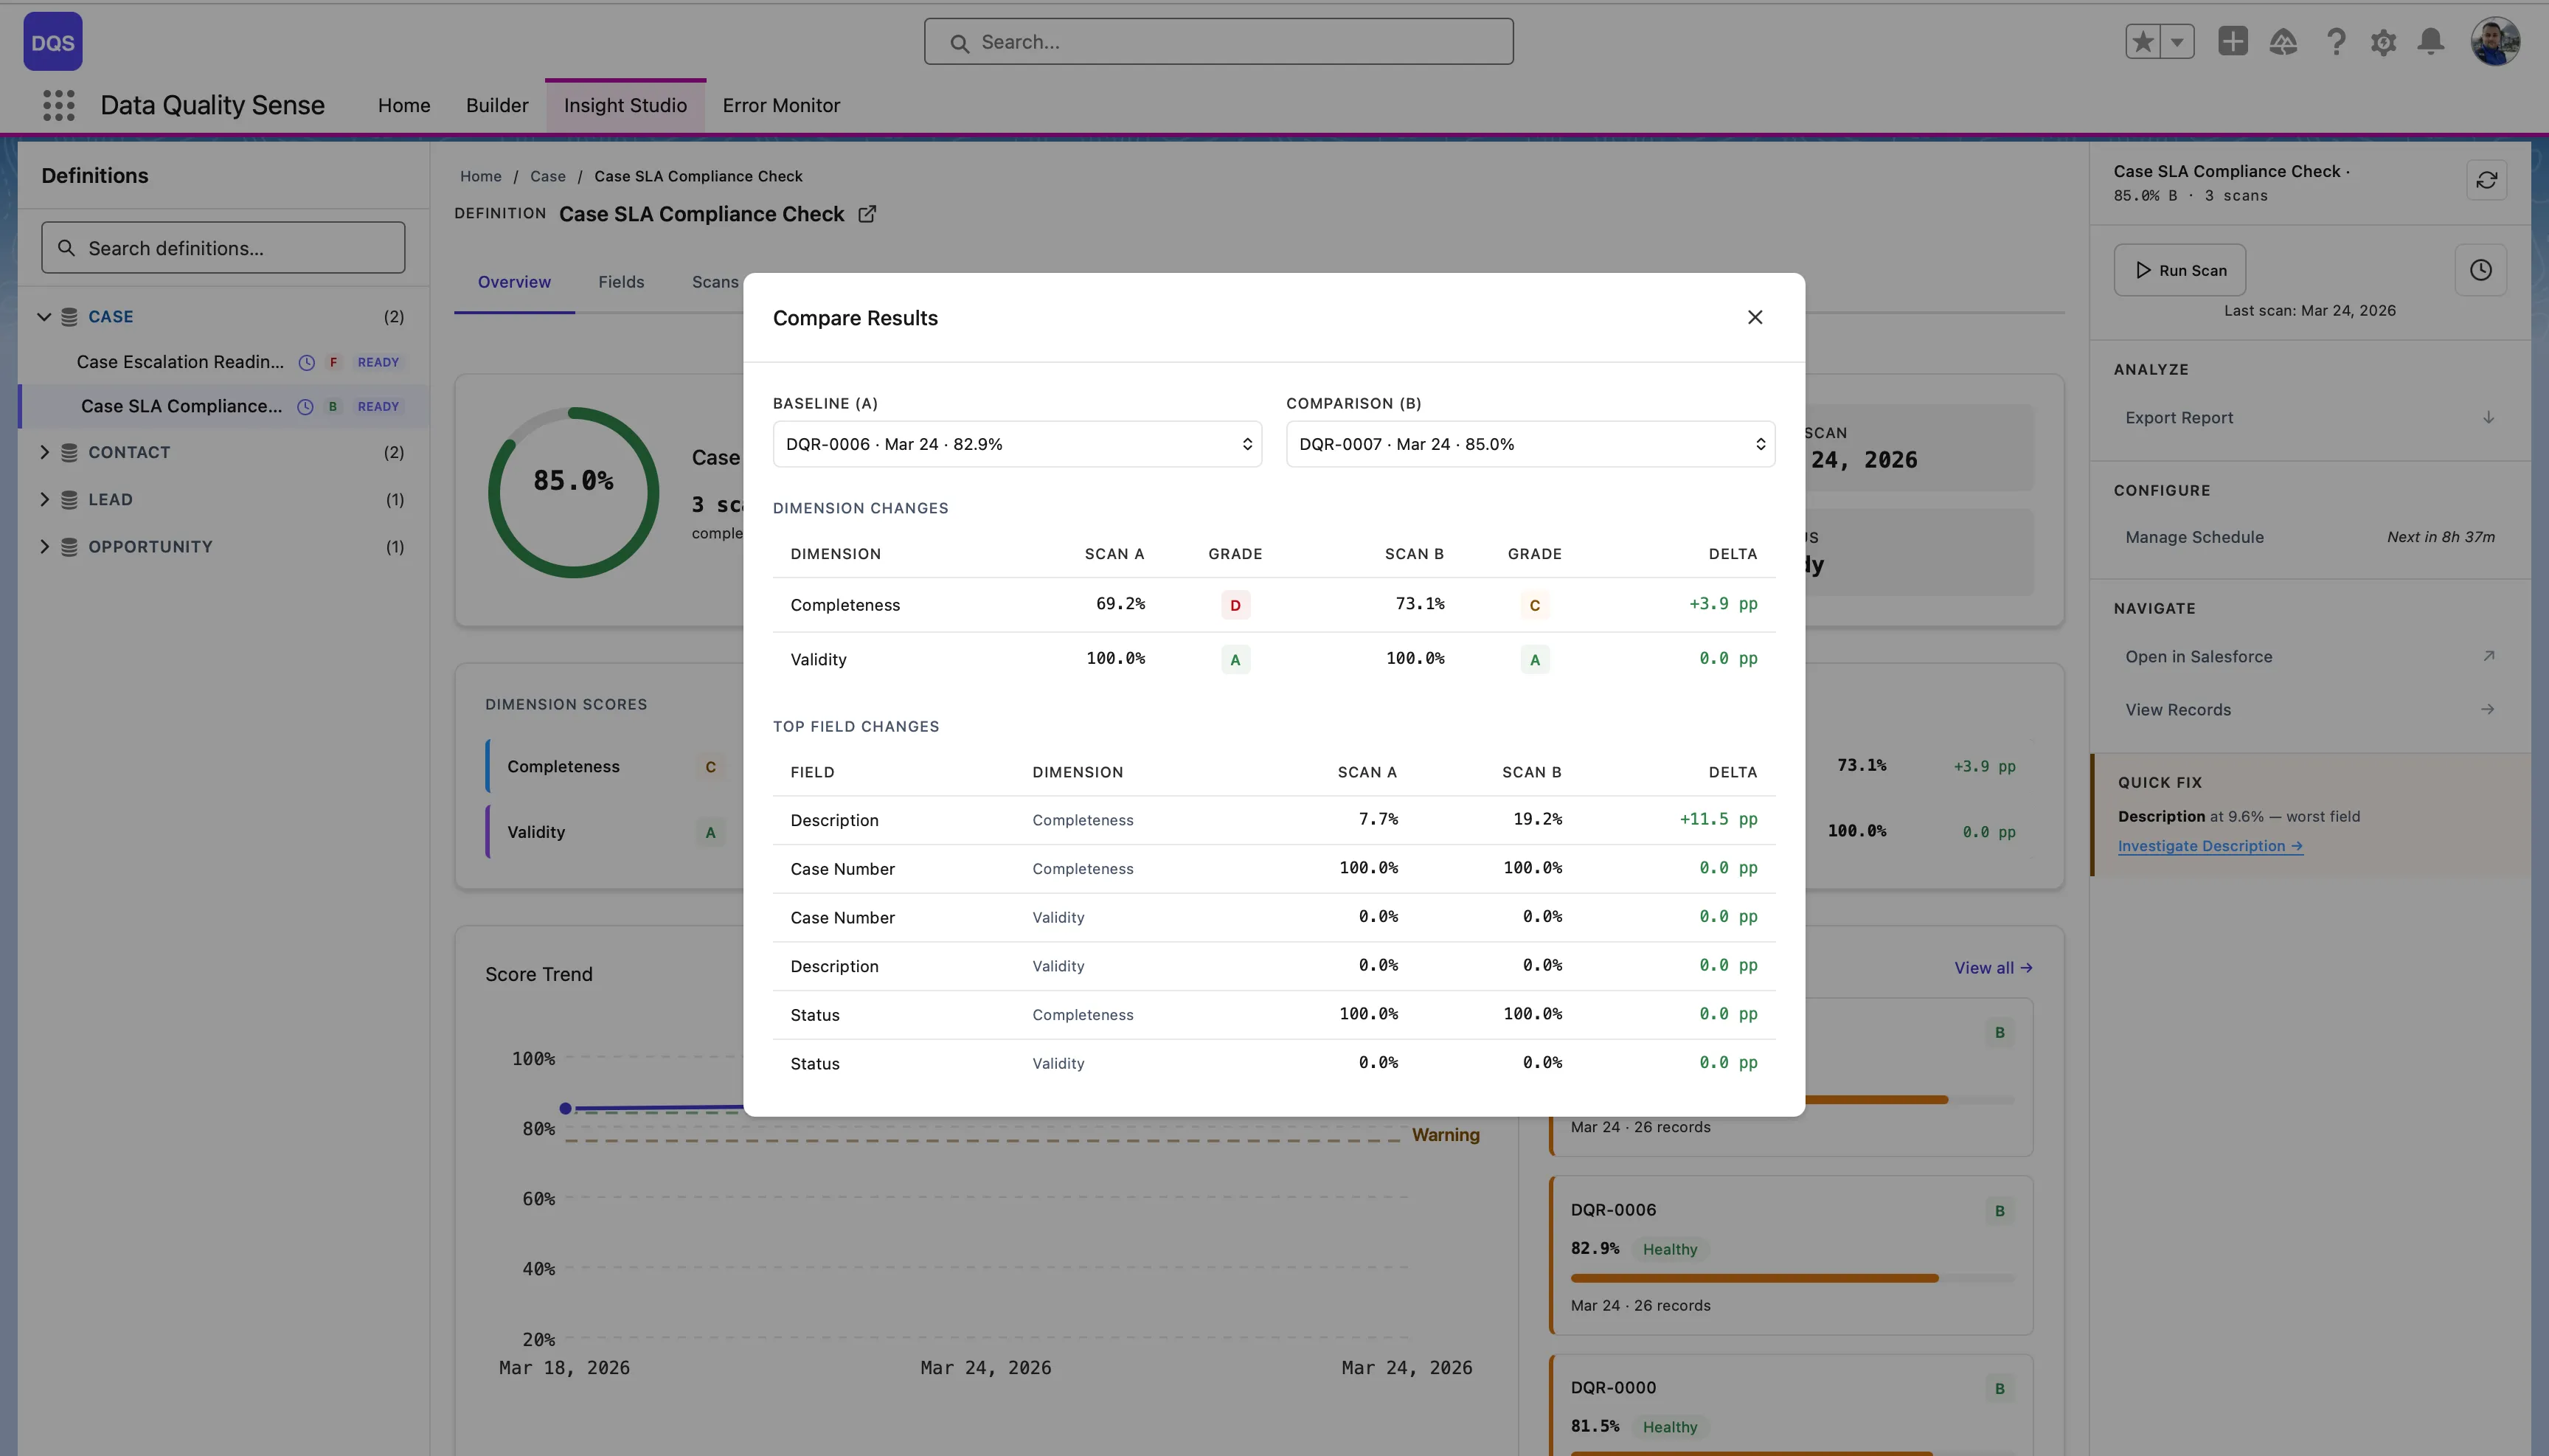
From the Overview tab, click Compare on the Score Trend chart to compare two scans side by side — see dimension-level and field-level deltas between a baseline and comparison scan.
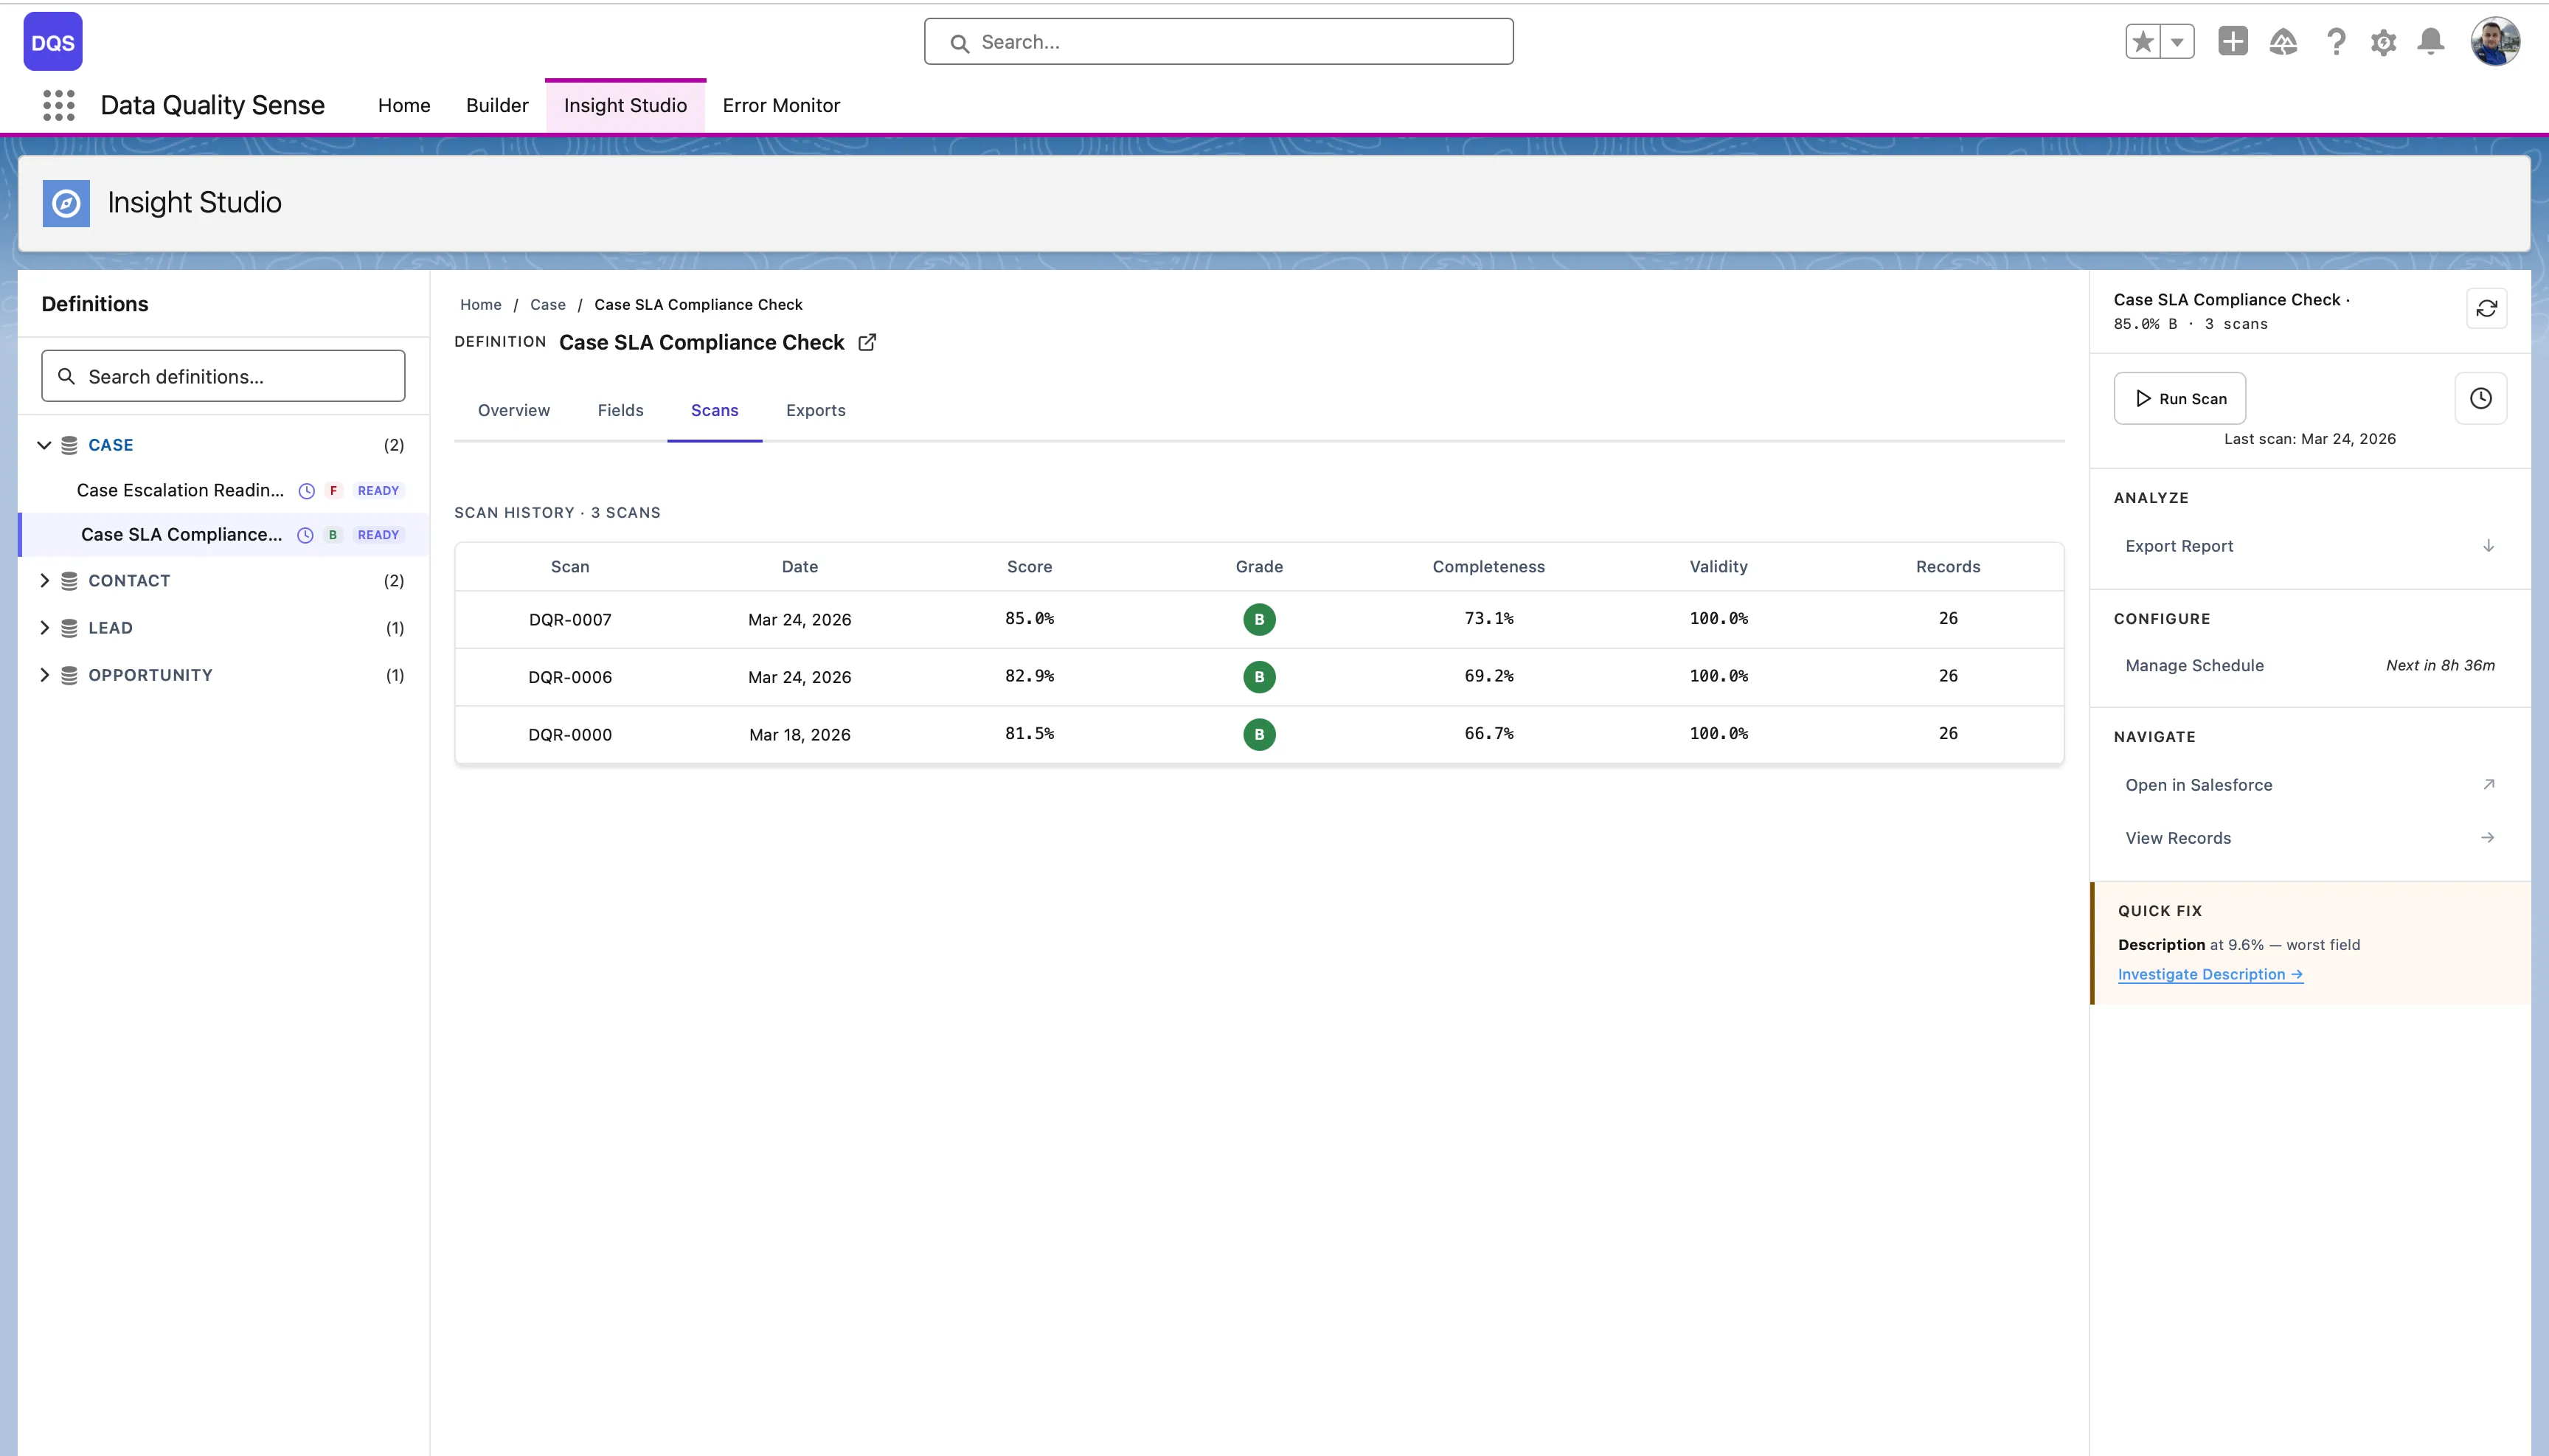
Detailed results for a specific scan execution. The Scans tab shows the full scan history with status indicators, scores, and per-dimension breakdowns for each run.
Results for a single field across all dimensions. Useful for understanding why a specific field is scoring poorly.
The deepest level — individual metric results for one field in one dimension. Shows the raw evaluation data.
The right-hand sidebar shows context and actions for the current definition:
A breadcrumb trail at the top of the stage area shows your current position in the hierarchy. Click any breadcrumb segment to navigate back to that level.

Every level in Insight Studio shows quality scores with visual indicators:
| Score Range | Grade | Color |
|---|---|---|
| 90–100 | Excellent | Green |
| 75–89 | Good | Light Green |
| 50–74 | Fair | Yellow/Orange |
| 25–49 | Poor | Orange |
| 0–24 | Critical | Red |
The definition dashboard shows dimension cards — one for each enabled capability — with:
Small inline charts next to each score showing the last several scan results. Useful for spotting trends without navigating to detailed views.
A larger trend chart available at the definition level showing:
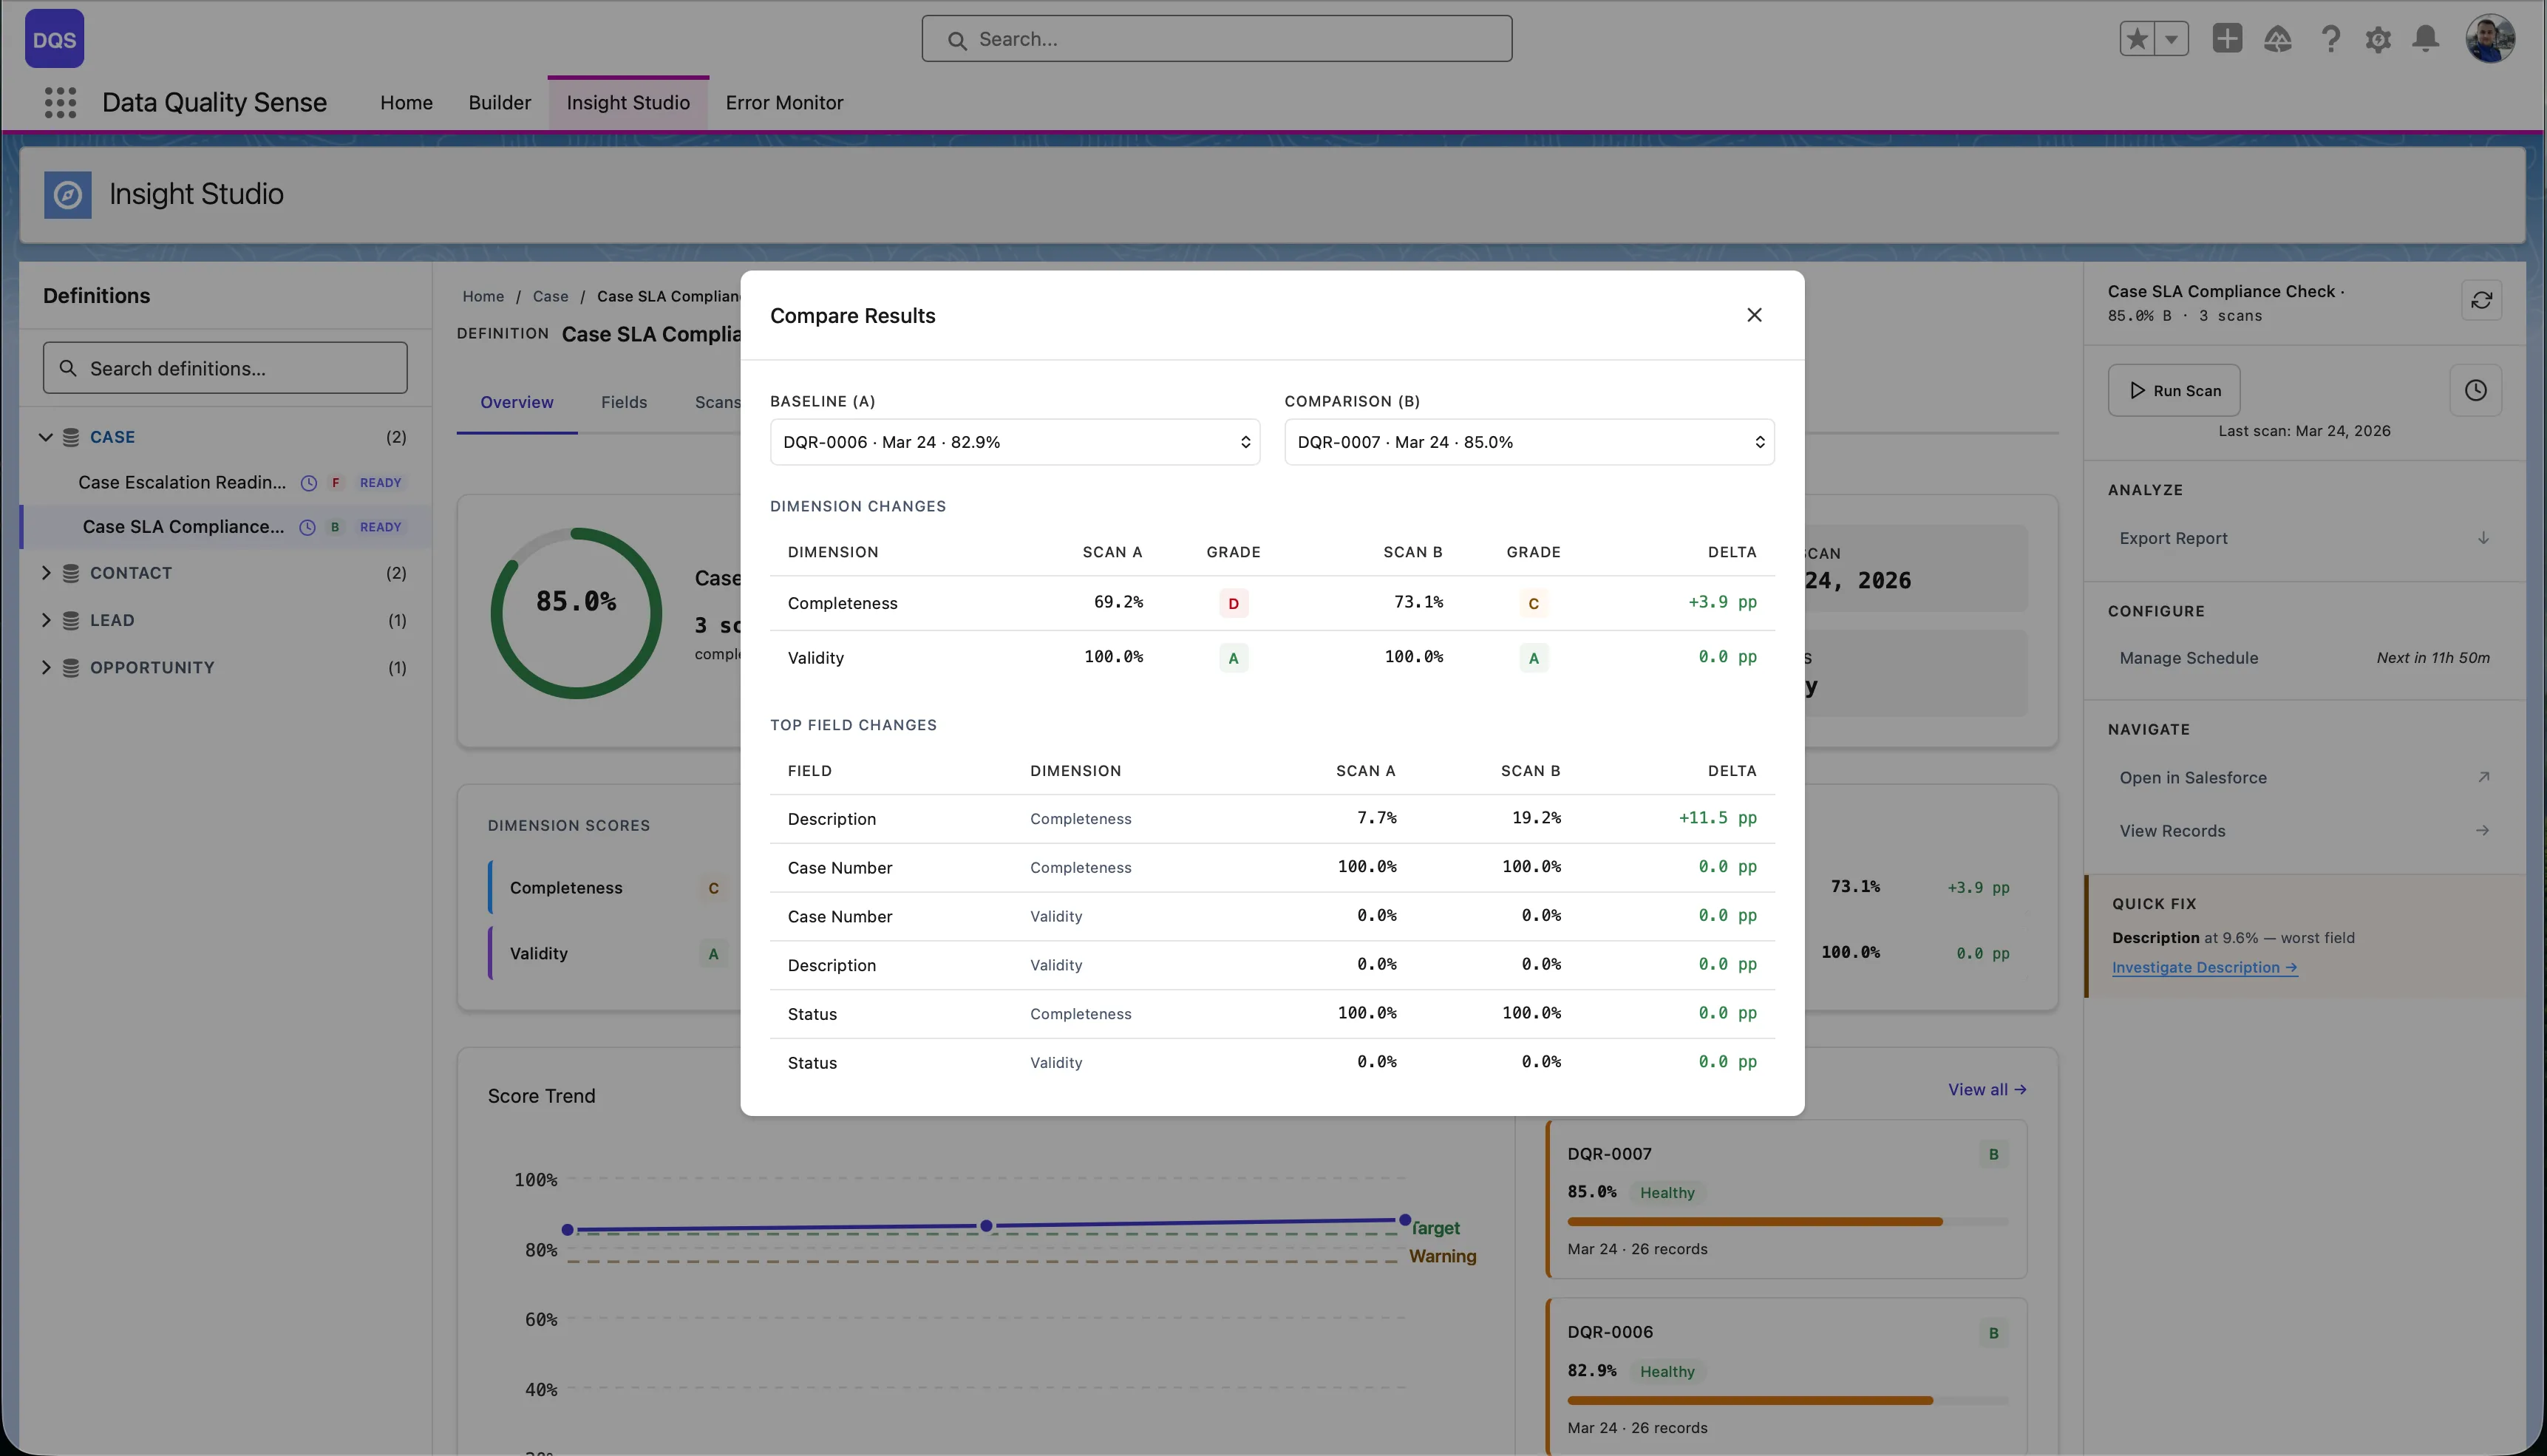
Compare two specific scans to see detailed deltas:
Some components adapt based on data availability:
The top of the definition view shows key performance indicators:
The field health matrix is a grid view showing every scanned field against every enabled dimension. Each cell displays the field’s score for that dimension, color-coded by grade.
| Axis | Content |
|---|---|
| Rows | Individual fields (sorted by overall score, worst first) |
| Columns | Quality dimensions (Completeness, Validity, etc.) |
| Cells | Score (0–100) with color indicator |
Scan the matrix for rows with multiple red/yellow cells. These fields have quality issues across multiple dimensions.
Look for columns with many red cells. These dimensions need attention across your dataset.
Click any cell to navigate to the detailed field-dimension view, showing the specific metrics and records that contribute to that score.
The Actions menu in the Mentor panel provides a unified dropdown for taking action on records that failed quality checks. It replaces the standalone Export button with an extensible menu that currently offers three actions:
| Action | What It Does |
|---|---|
| Export Report | Download violation details as CSV (details) |
| Create Tasks | Create Salesforce Tasks for record owners to remediate issues |
| Post Chatter | Post Chatter messages on impacted records to notify stakeholders |
All actions share the same scope model — you choose which fields and dimensions to act on, and the system processes violations for each combination as a separate background job.
When you open any action modal, you first select the scope:
The system re-evaluates violations at the time of the action, so results reflect the current state of your data — not a cached snapshot from the last scan.
Each field-dimension combination runs as a separate batch job. For example, selecting 3 fields and 2 dimensions produces 6 jobs that execute sequentially.
Creates Salesforce Task records linked to each impacted record. Tasks are assigned to record owners by default and appear in their standard Salesforce task list.
| Setting | Default | Description |
|---|---|---|
| Subject | Data Quality: {dimension} — {recordName} | Task subject line. Supports {dimension}, {recordName}, and {fieldName} placeholders |
| Description | Describes the quality issue and asks for review | Free-text body of the task |
| Due Date | 7 days from today | When the task should be completed |
| Priority | Normal | High, Normal, or Low |
| Assign To | Record Owner | Enter a specific User ID to override. Leave blank to assign to each record’s owner |
Before creating tasks, the system checks for existing open tasks on each record with a matching subject prefix. Records that already have a matching open task are skipped — this prevents duplicate tasks when you run the action multiple times.
The skip count is reported in the completion summary (e.g., “Created 45 tasks. 12 skipped (existing tasks). 0 errors.”).
Posts a Chatter feed message on each impacted record. Optionally @mentions the record owner to trigger a Salesforce notification.
| Setting | Default | Description |
|---|---|---|
| Message | Describes the quality issue and dimension | Free-text message body. Supports {dimension}, {recordName}, and {fieldName} placeholders |
| Mention Record Owner | Checked | When enabled, the post @mentions the record’s owner, triggering a Salesforce notification |
Chatter uses a 24-hour dedup window — if the current user already posted a matching quality message on a record within the last 24 hours, that record is skipped. This prevents flooding Chatter feeds when running the action repeatedly.
All actions run as Apex batch jobs in the background. Key details:
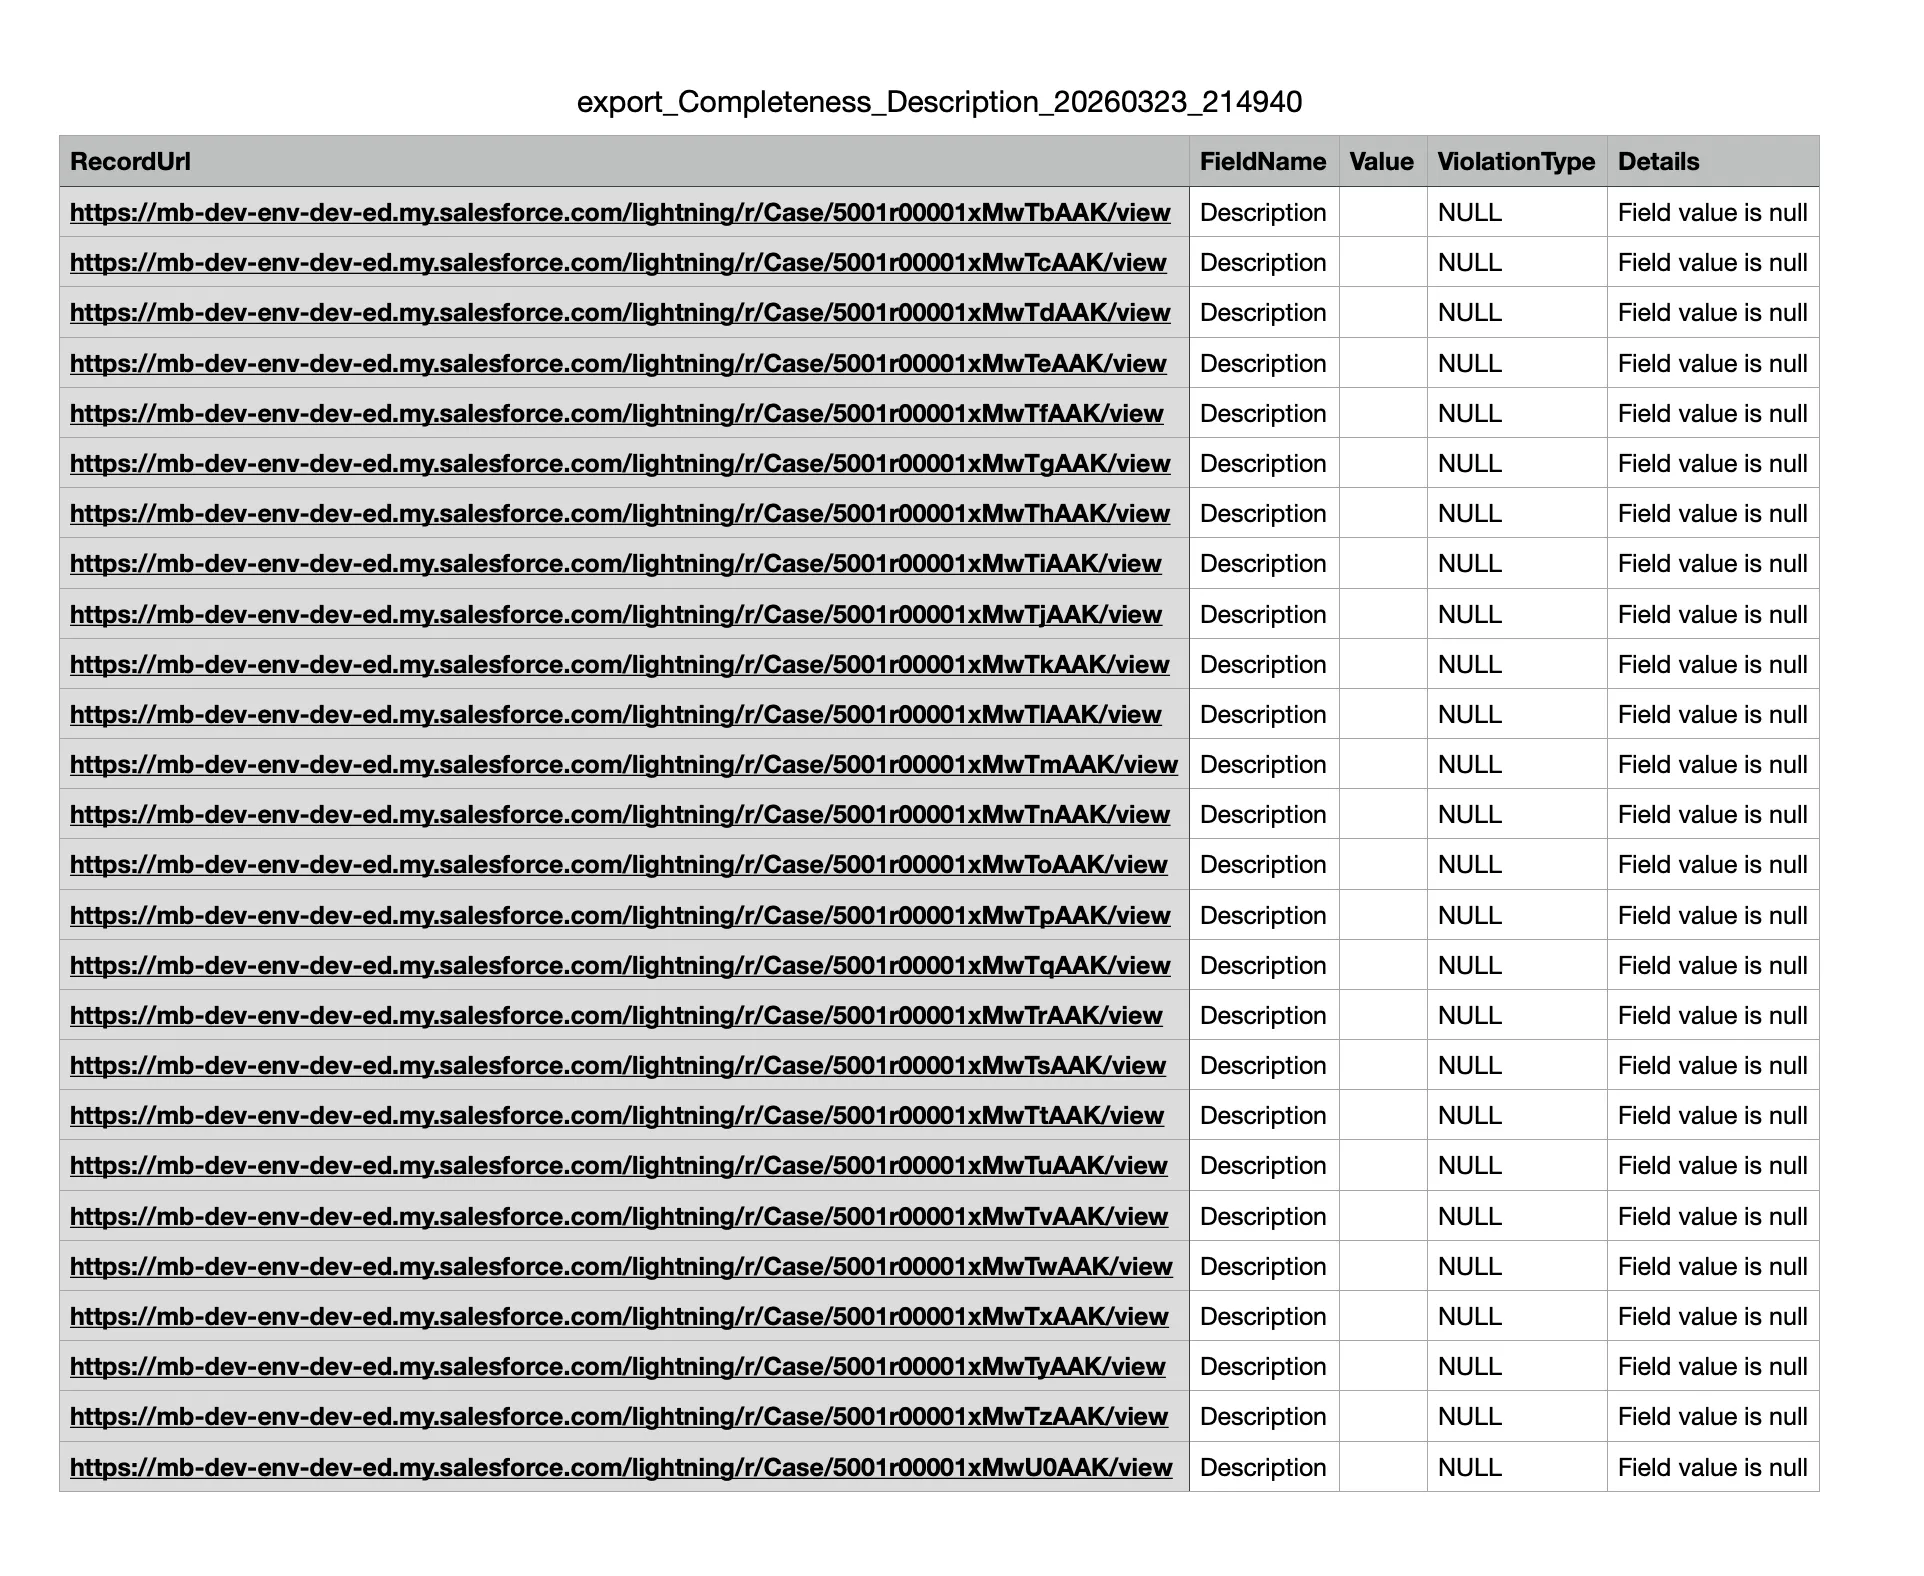
Insight Studio supports CSV export of violation details for all dimensions. This lets you take action on data quality issues outside of Salesforce.
Each export contains the specific records that failed quality checks for a given dimension:
| Dimension | Export Contains |
|---|---|
| Completeness | Records with blank/null fields |
| Validity | Records with invalid values |
| Uniqueness | Records with duplicate values |
| Timeliness | Records with stale dates |
| Consistency | Records with contradicting fields |
| PII Detection | Records with detected PII |
Each CSV includes:
The Field Result page shows the full context — field identity, dimension, scoring details (score, threshold, records empty/populated), and an AI Insight section. The exported CSV file is available for download in the Files panel on the right.
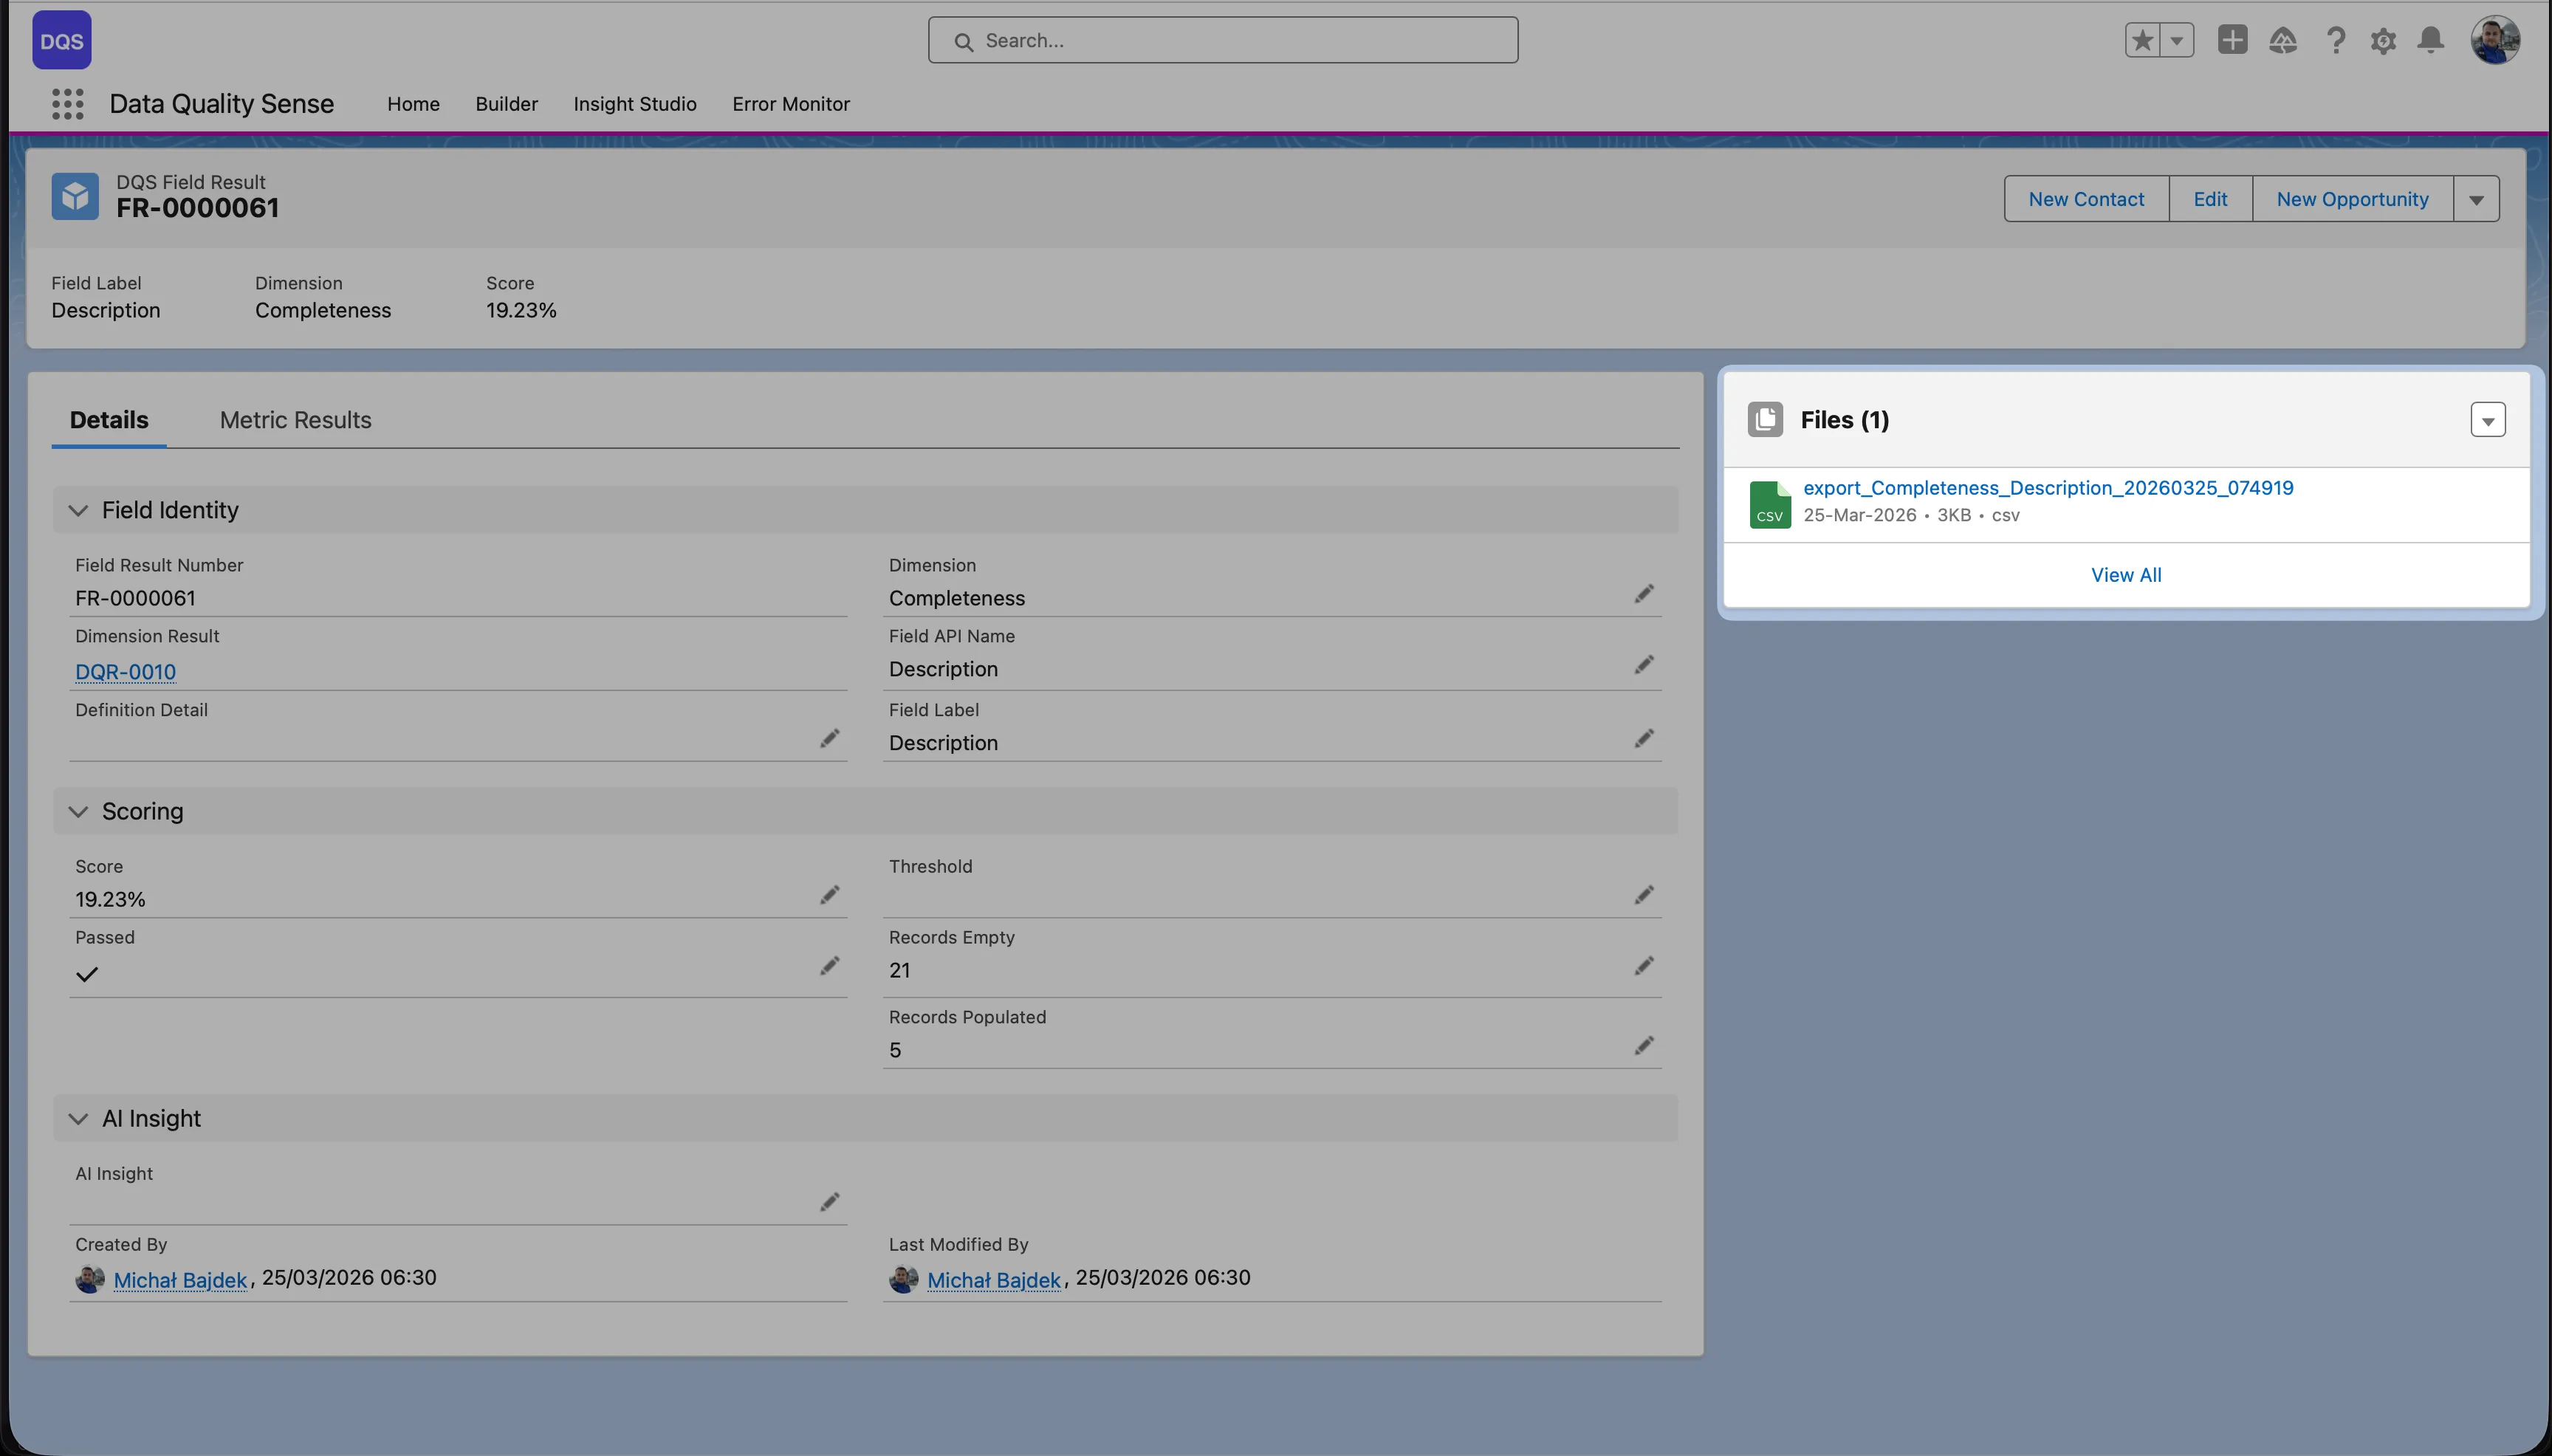
Below is an example of the exported CSV file contents:
The Processing engine is the execution layer of Data Quality Sense. It reads scan definitions created in the Builder, queries live Salesforce data, and produces quality scores visible in Insight Studio.
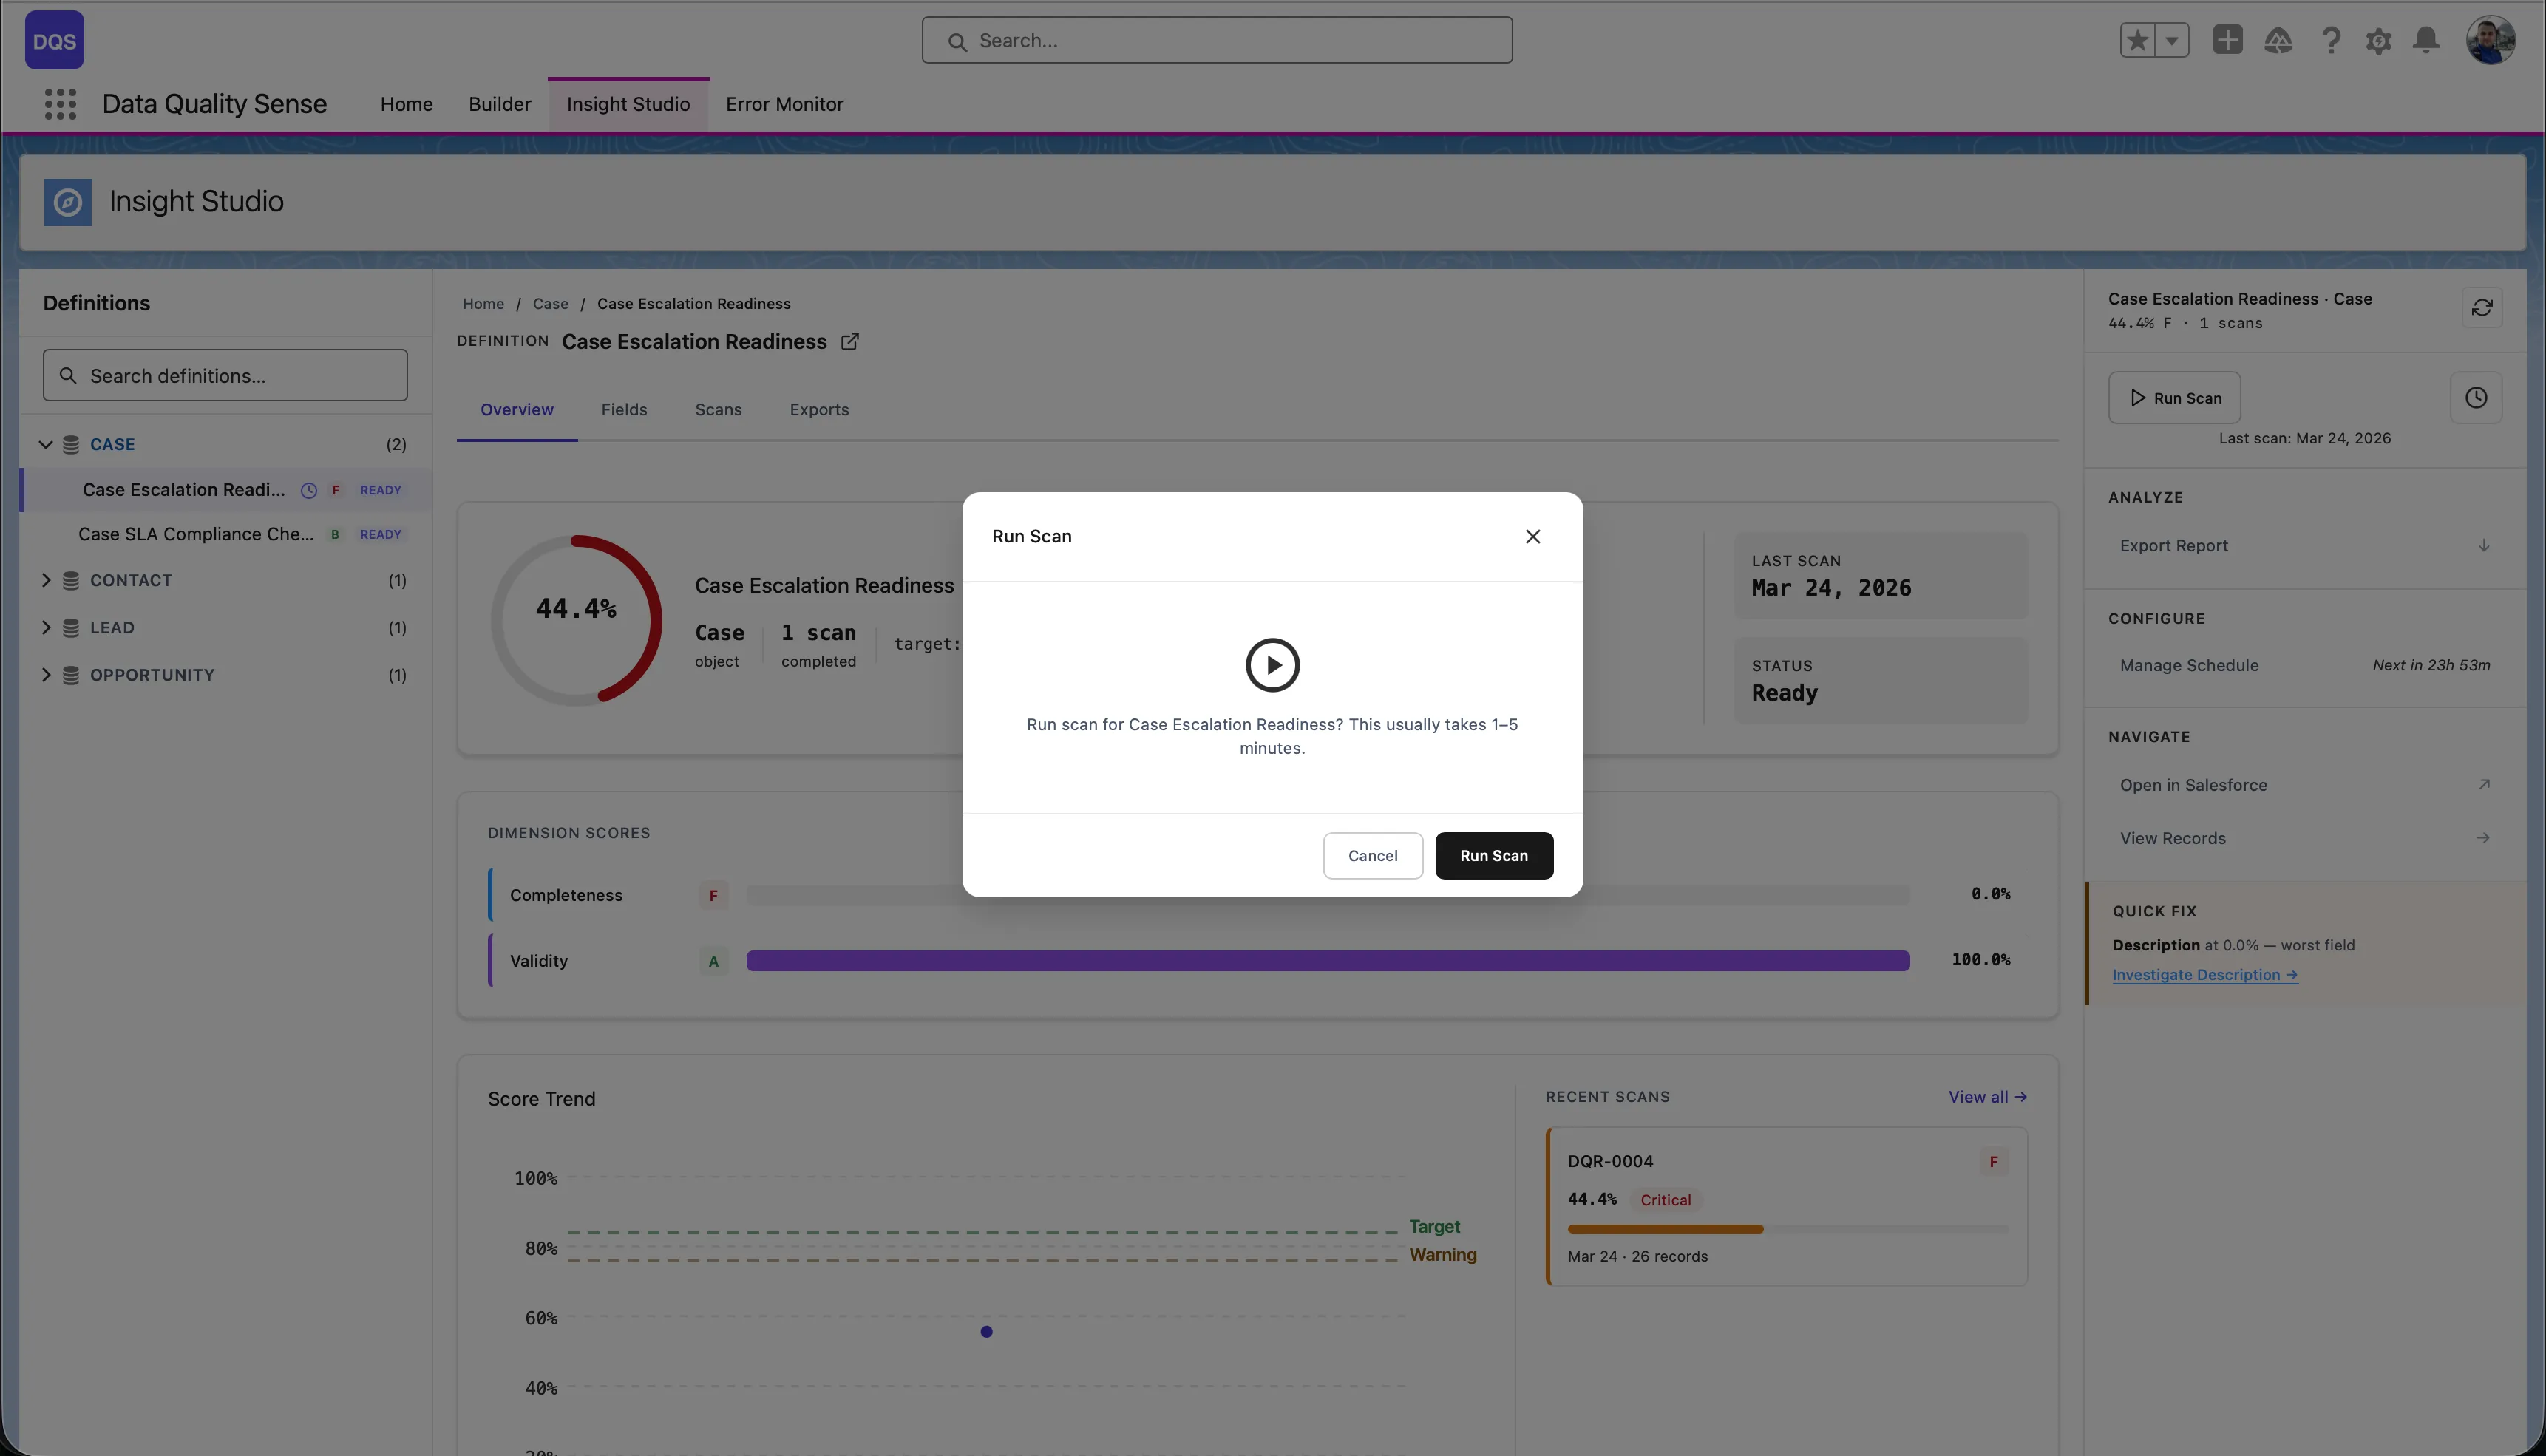
Scans can be triggered in three ways:
DQS supports automated recurring scans via CRON-based scheduling. Once configured, scans run automatically without manual intervention.
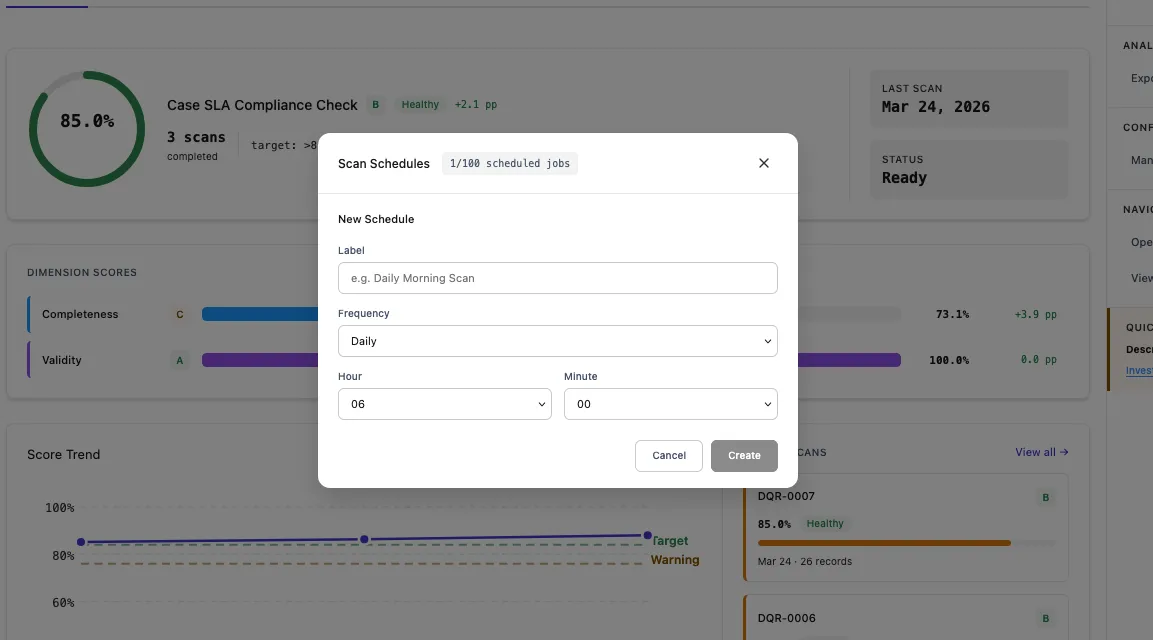
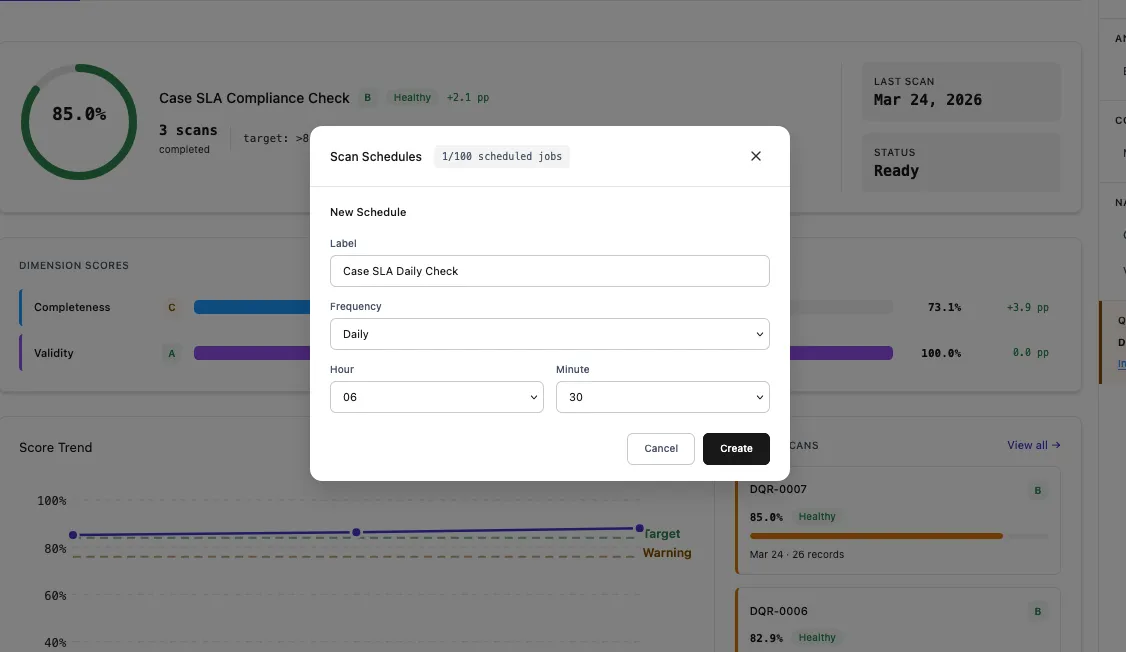
| Setting | Description | Example |
|---|---|---|
| Name | Display name for the schedule | Case SLA Daily Check |
| Frequency | How often the scan runs | Daily, Weekly, Monthly |
| Time | What time of day to run | 06:30 |
| Day of Week | For weekly schedules | Monday |
| Day of Month | For monthly schedules | 1st |
Under the hood, schedules use Salesforce CRON expressions. DQS provides a user-friendly UI that generates the CRON expression for you, but advanced users can also set custom expressions.
| Schedule | CRON Expression |
|---|---|
| Daily at 2 AM | 0 0 2 * * ? |
| Weekly on Monday at 6 AM | 0 0 6 ? * MON |
| Monthly on 1st at midnight | 0 0 0 1 * ? |
| Every weekday at 5 AM | 0 0 5 ? * MON-FRI |
The Scan Schedules modal shows all configured schedules with their status, frequency, and next run time. The counter shows how many scheduled jobs are used out of the Salesforce limit (e.g., 2/100).
Click the edit icon to modify schedule settings. The existing schedule is replaced with the new configuration.

Use the Active toggle to temporarily pause a schedule without deleting it.
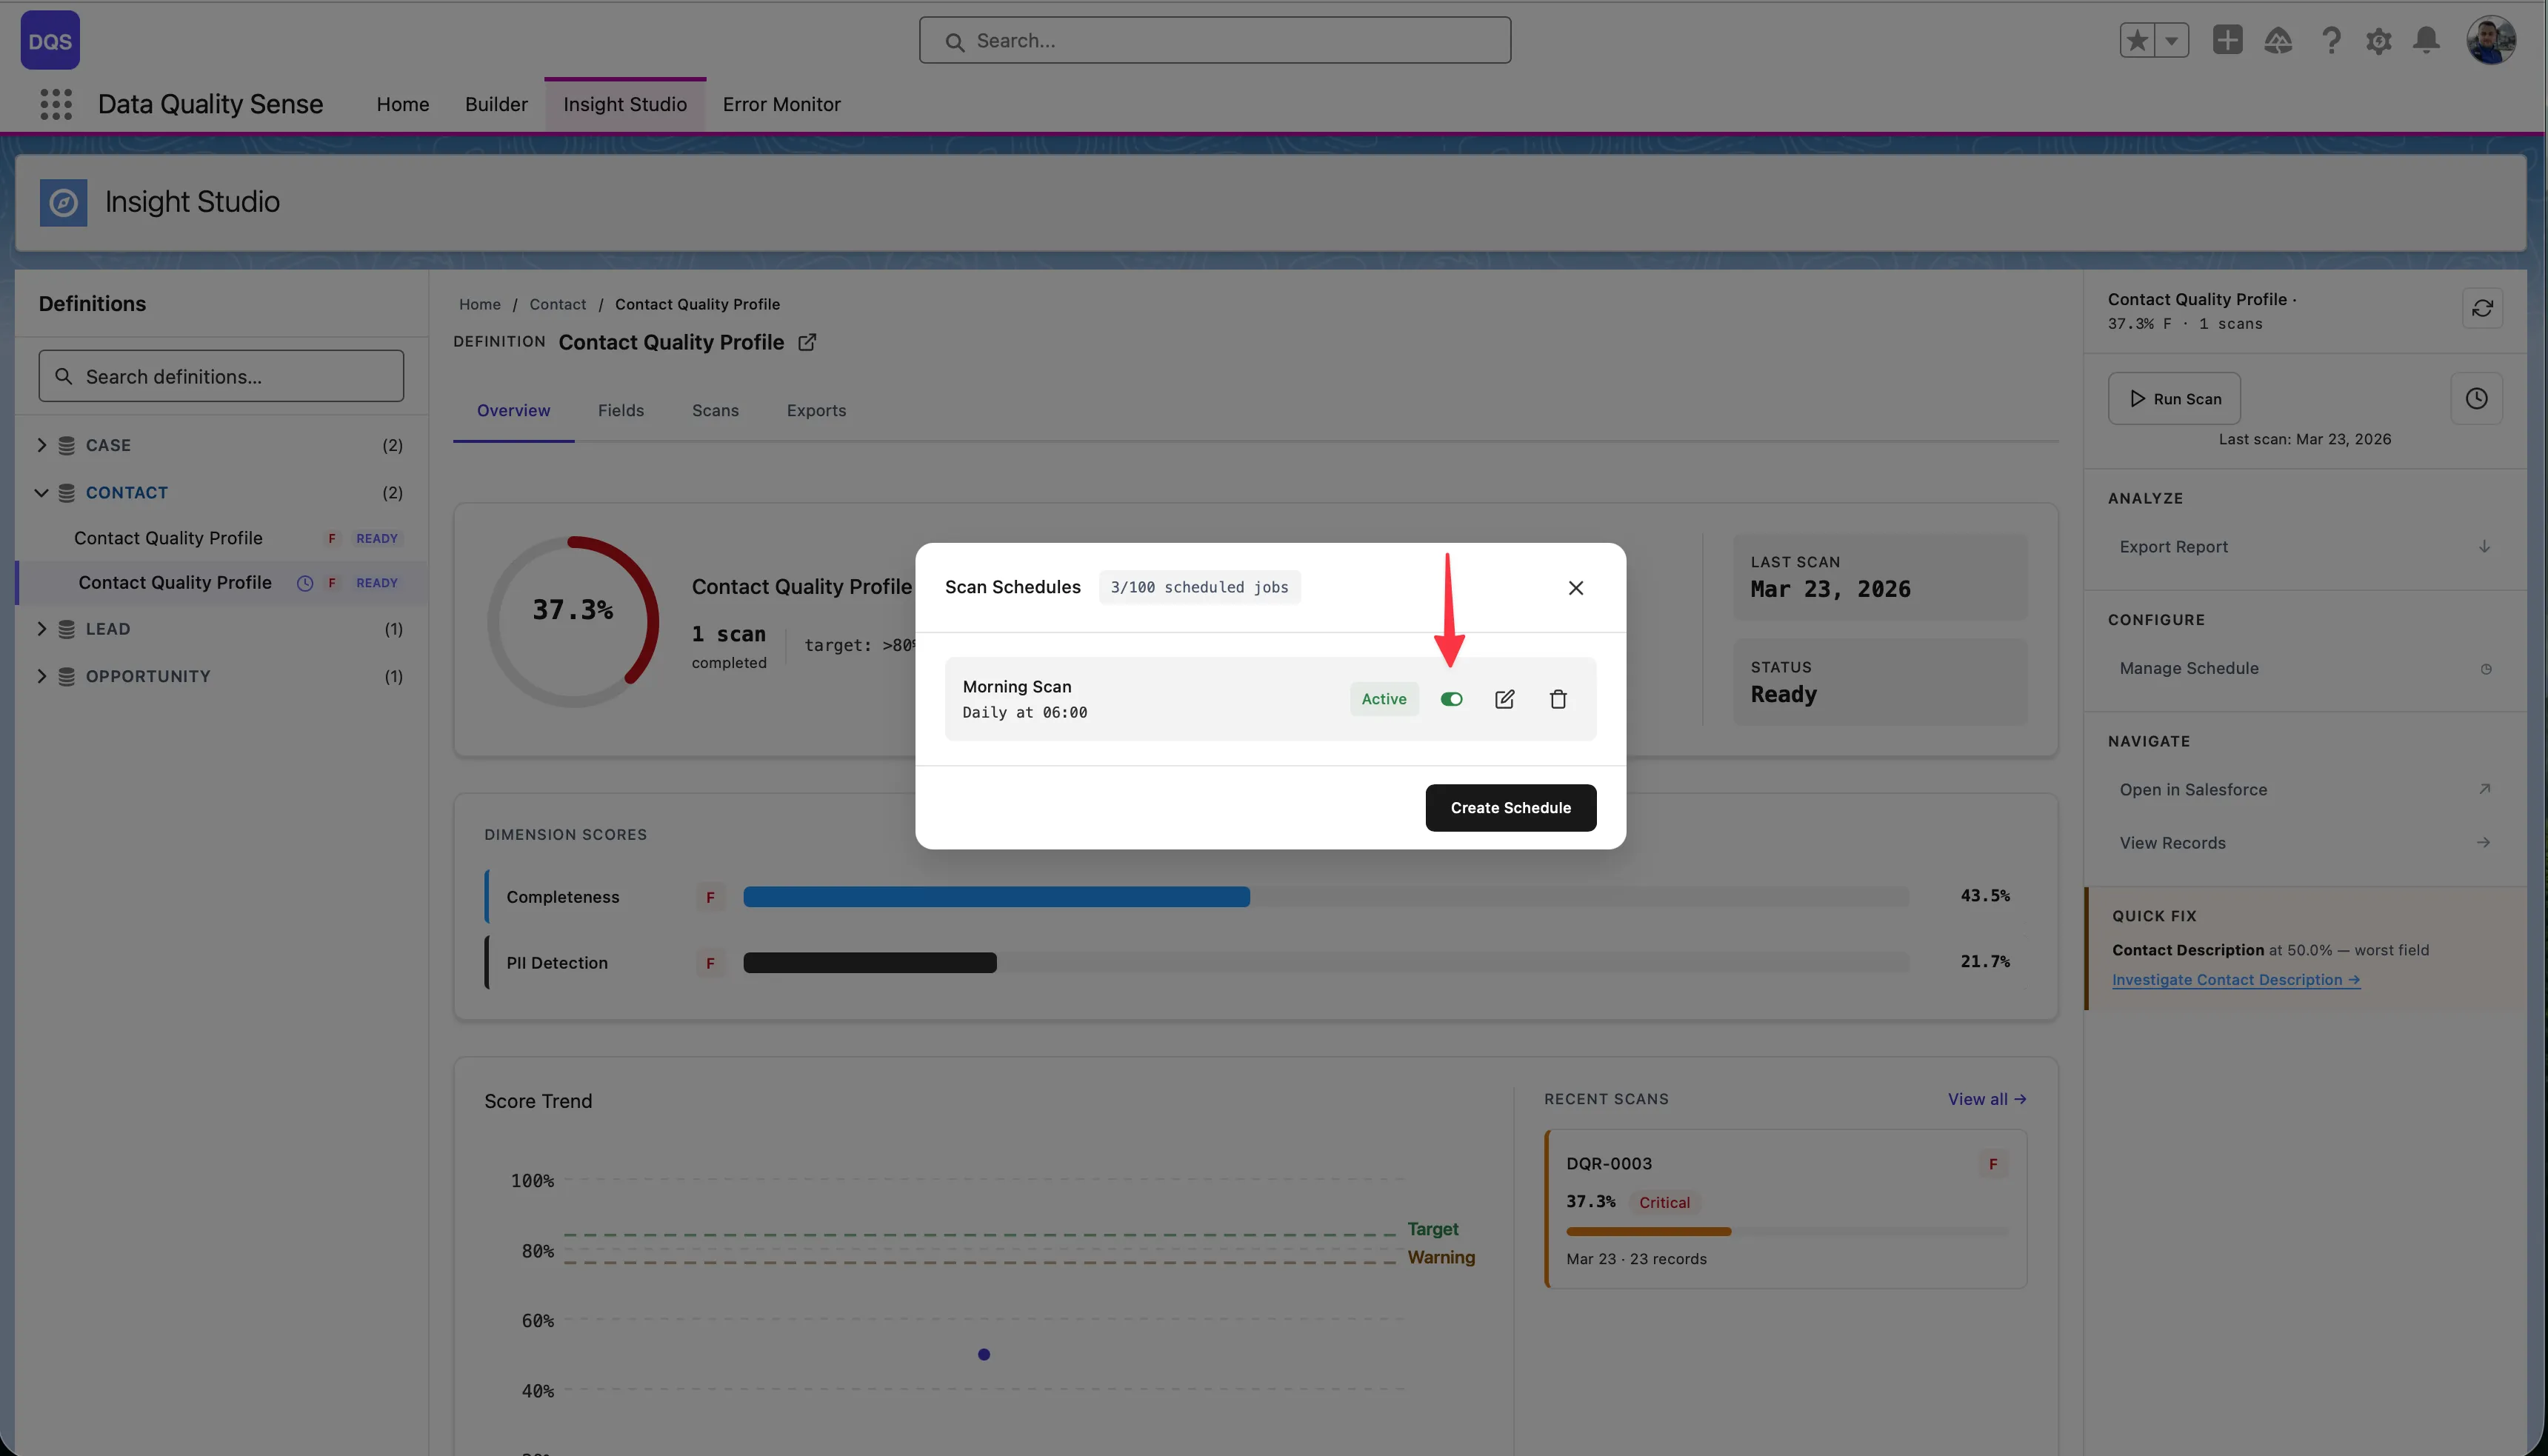
Click the delete icon to remove a schedule. Manual scans remain available.

Every scan records who triggered it:
DQS includes automated data purging to prevent unbounded growth of scan results and error logs. Retention policies are configured via Custom Metadata Types and can be adjusted by administrators.
All retention settings are stored in DQS_Configuration__mdt (Category: “Retention”):
| Setting | Default | Description |
|---|---|---|
| Error Log Retention | 7 days | Days before error logs are deleted |
| Scan Result Retention | 30 days | Days before dimension results are purged |
| Purge Batch Size | 2,000 | Records processed per batch chunk |
| Purge CRON Expression | 0 0 2 * * ? | When the purge job runs (default: daily at 2 AM) |
The purge process runs as a chained batch job:
DQS_DataPurgeScheduler (CRON trigger) └── DQS_ErrorLogPurgeBatch (deletes error logs where Expires_At <= NOW) └── DQS_ResultPurgeBatch (deletes dimension results older than retention window) └── Cascade: Field Results + Metric Results (deleted automatically via master-detail relationship)When a DQS_Dimension_Result__c record is deleted:
DQS_Field_Result__c records are automatically deletedDQS_Metric_Result__c records are automatically deletedThis happens via Salesforce’s master-detail cascade — no additional batch processing is needed.
To change retention periods, edit the values directly from the Configuration panel on the DQS Home page:
Alternatively, you can update them via Salesforce Setup:
Scan_Result_Retention_Days)DQS_DataPurgeScheduler in Setup → Scheduled Jobs to verify the purge is runningThe Error Monitor tab in the DQS application provides a dedicated interface for monitoring and resolving errors that occur during scan processing. It gives full visibility into batch failures, strategy errors, and platform issues — all in one place.
The Error Management Console uses a 3-zone layout:
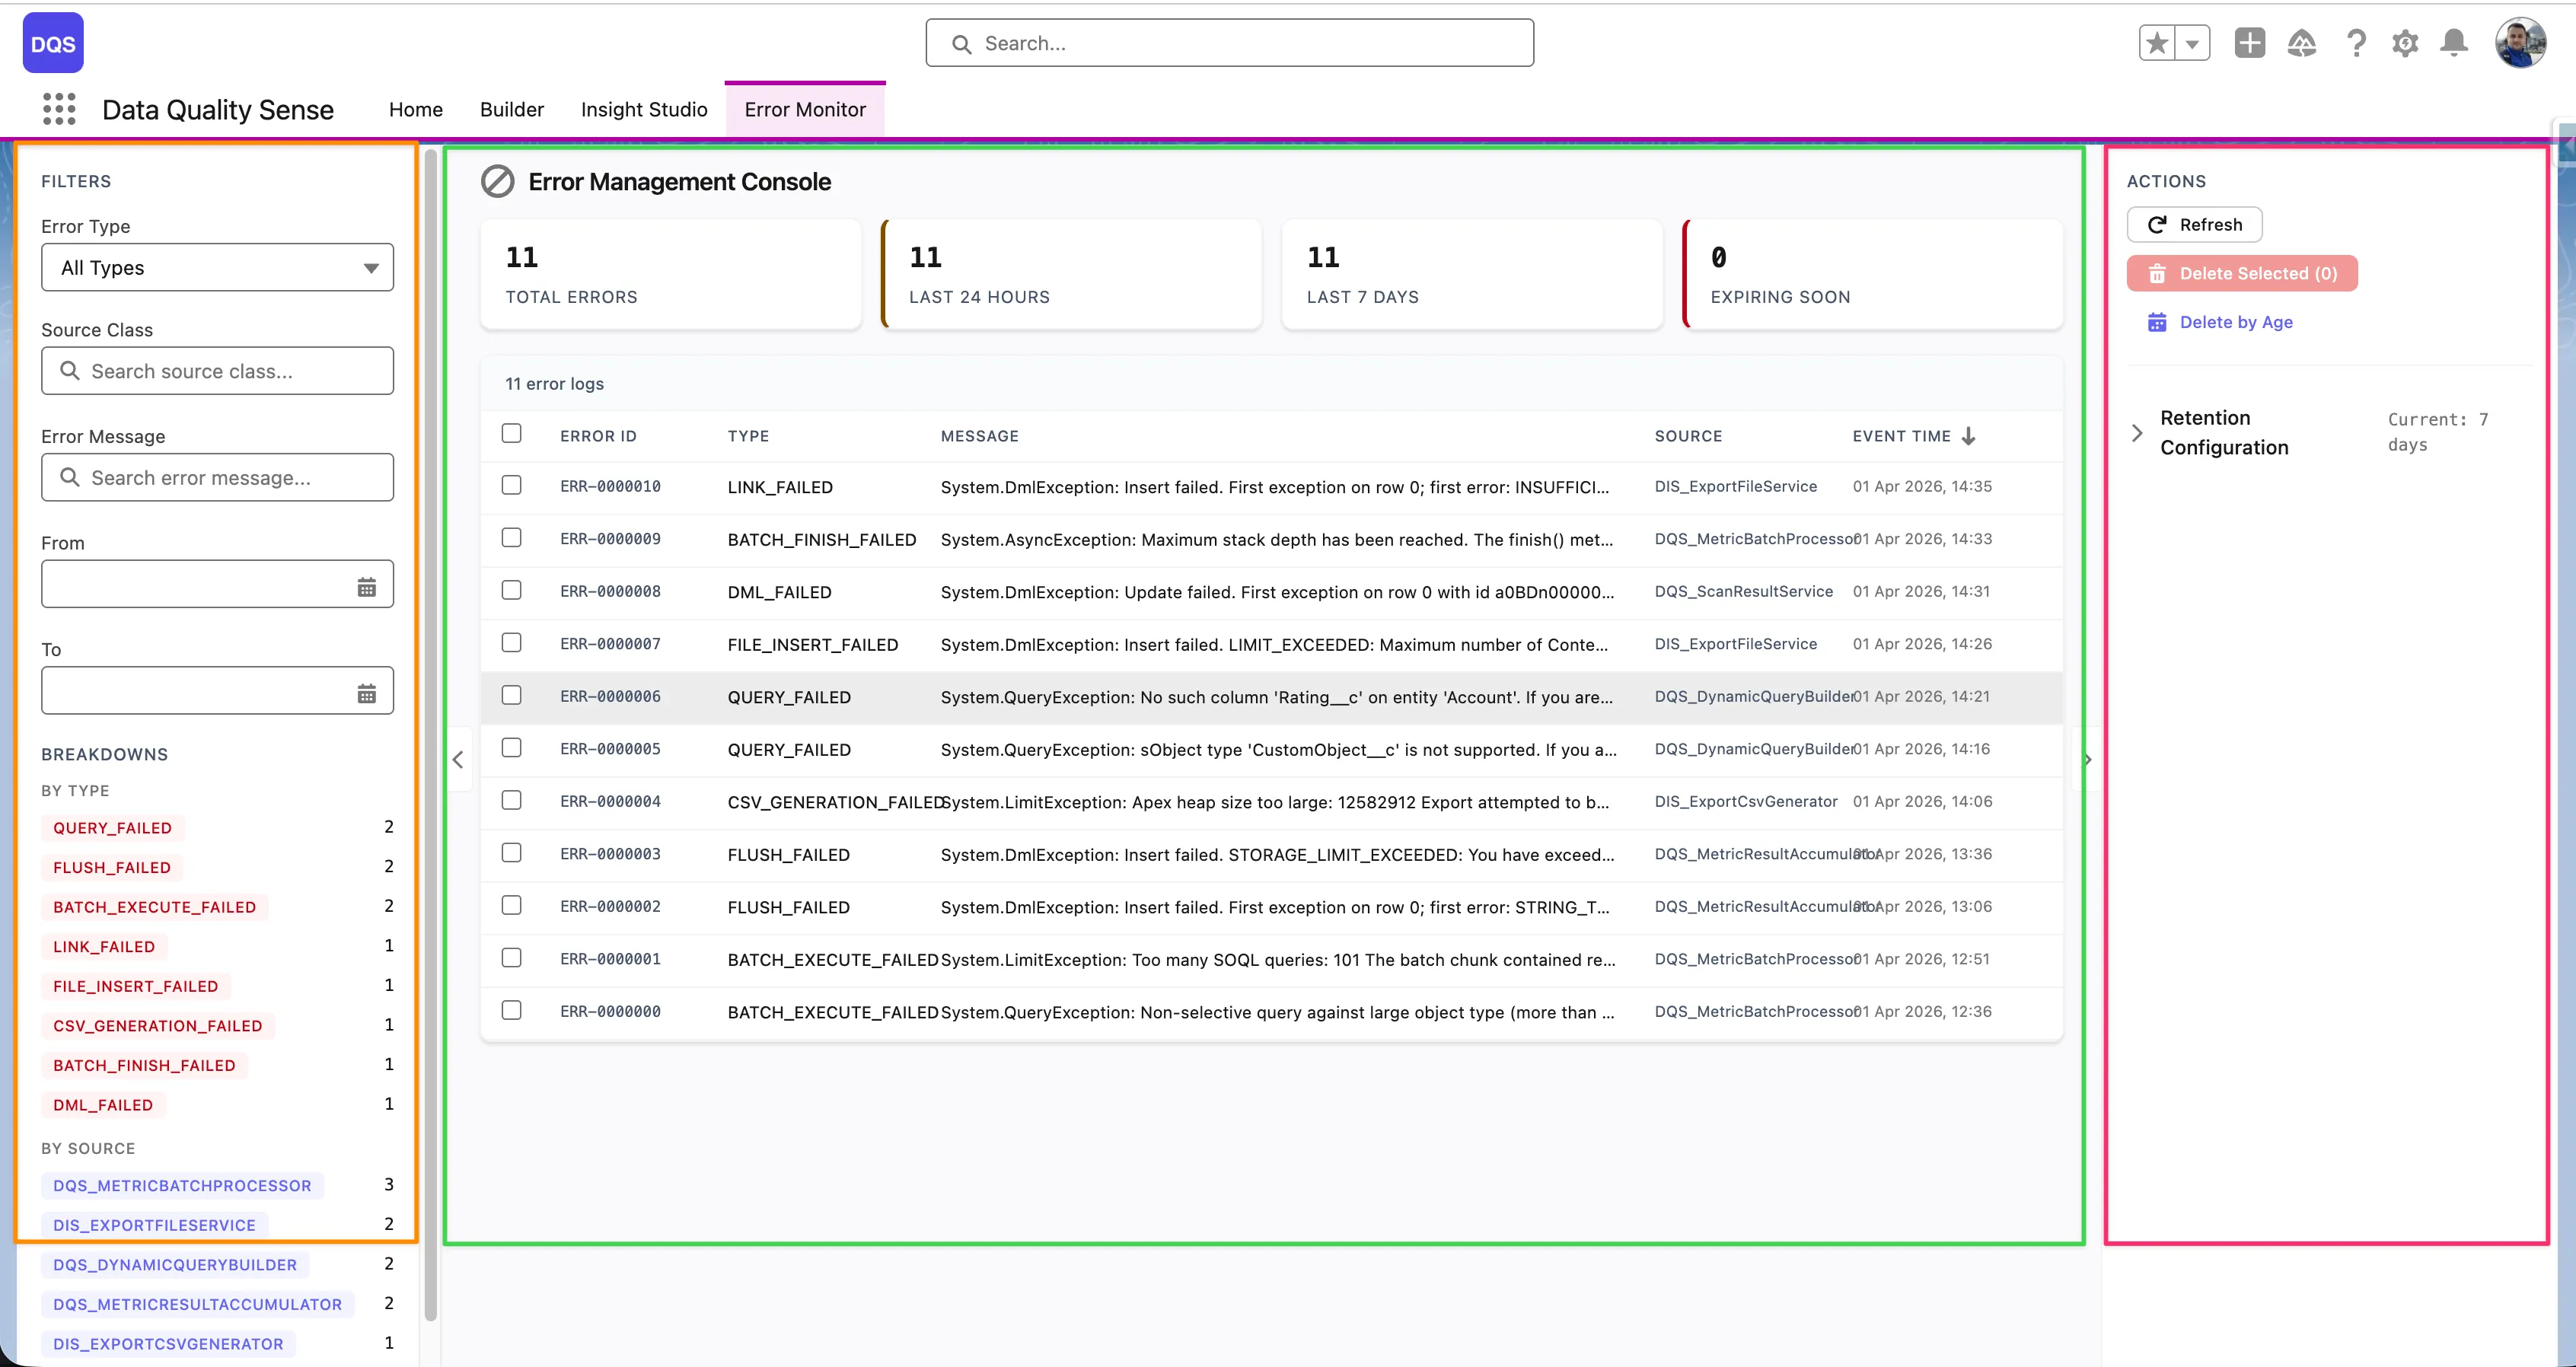
Each error row in the table shows the following columns:
| Column | Description |
|---|---|
| Error ID | Unique identifier for the error log entry |
| Type | Error category (e.g., DML_FAILED, QUERY_FAILED, FIELD_INSERT_FAILED, BATCH_EXECUTE_FAILED) |
| Message | Short error description (truncated — click the row to see the full message) |
| Source | The Apex class that generated the error (e.g., DQS_ExportFileService, DQS_DynamicQueryBuilder01) |
| Event Time | Timestamp of when the error occurred |
The top of the table shows aggregate counters — Total Errors, Last 24 Hours, Last 7 Days, and Expiring Soon — giving you an at-a-glance health overview.
Click any error row to open a detail modal with the full context:
System.AsyncException, System.DmlException)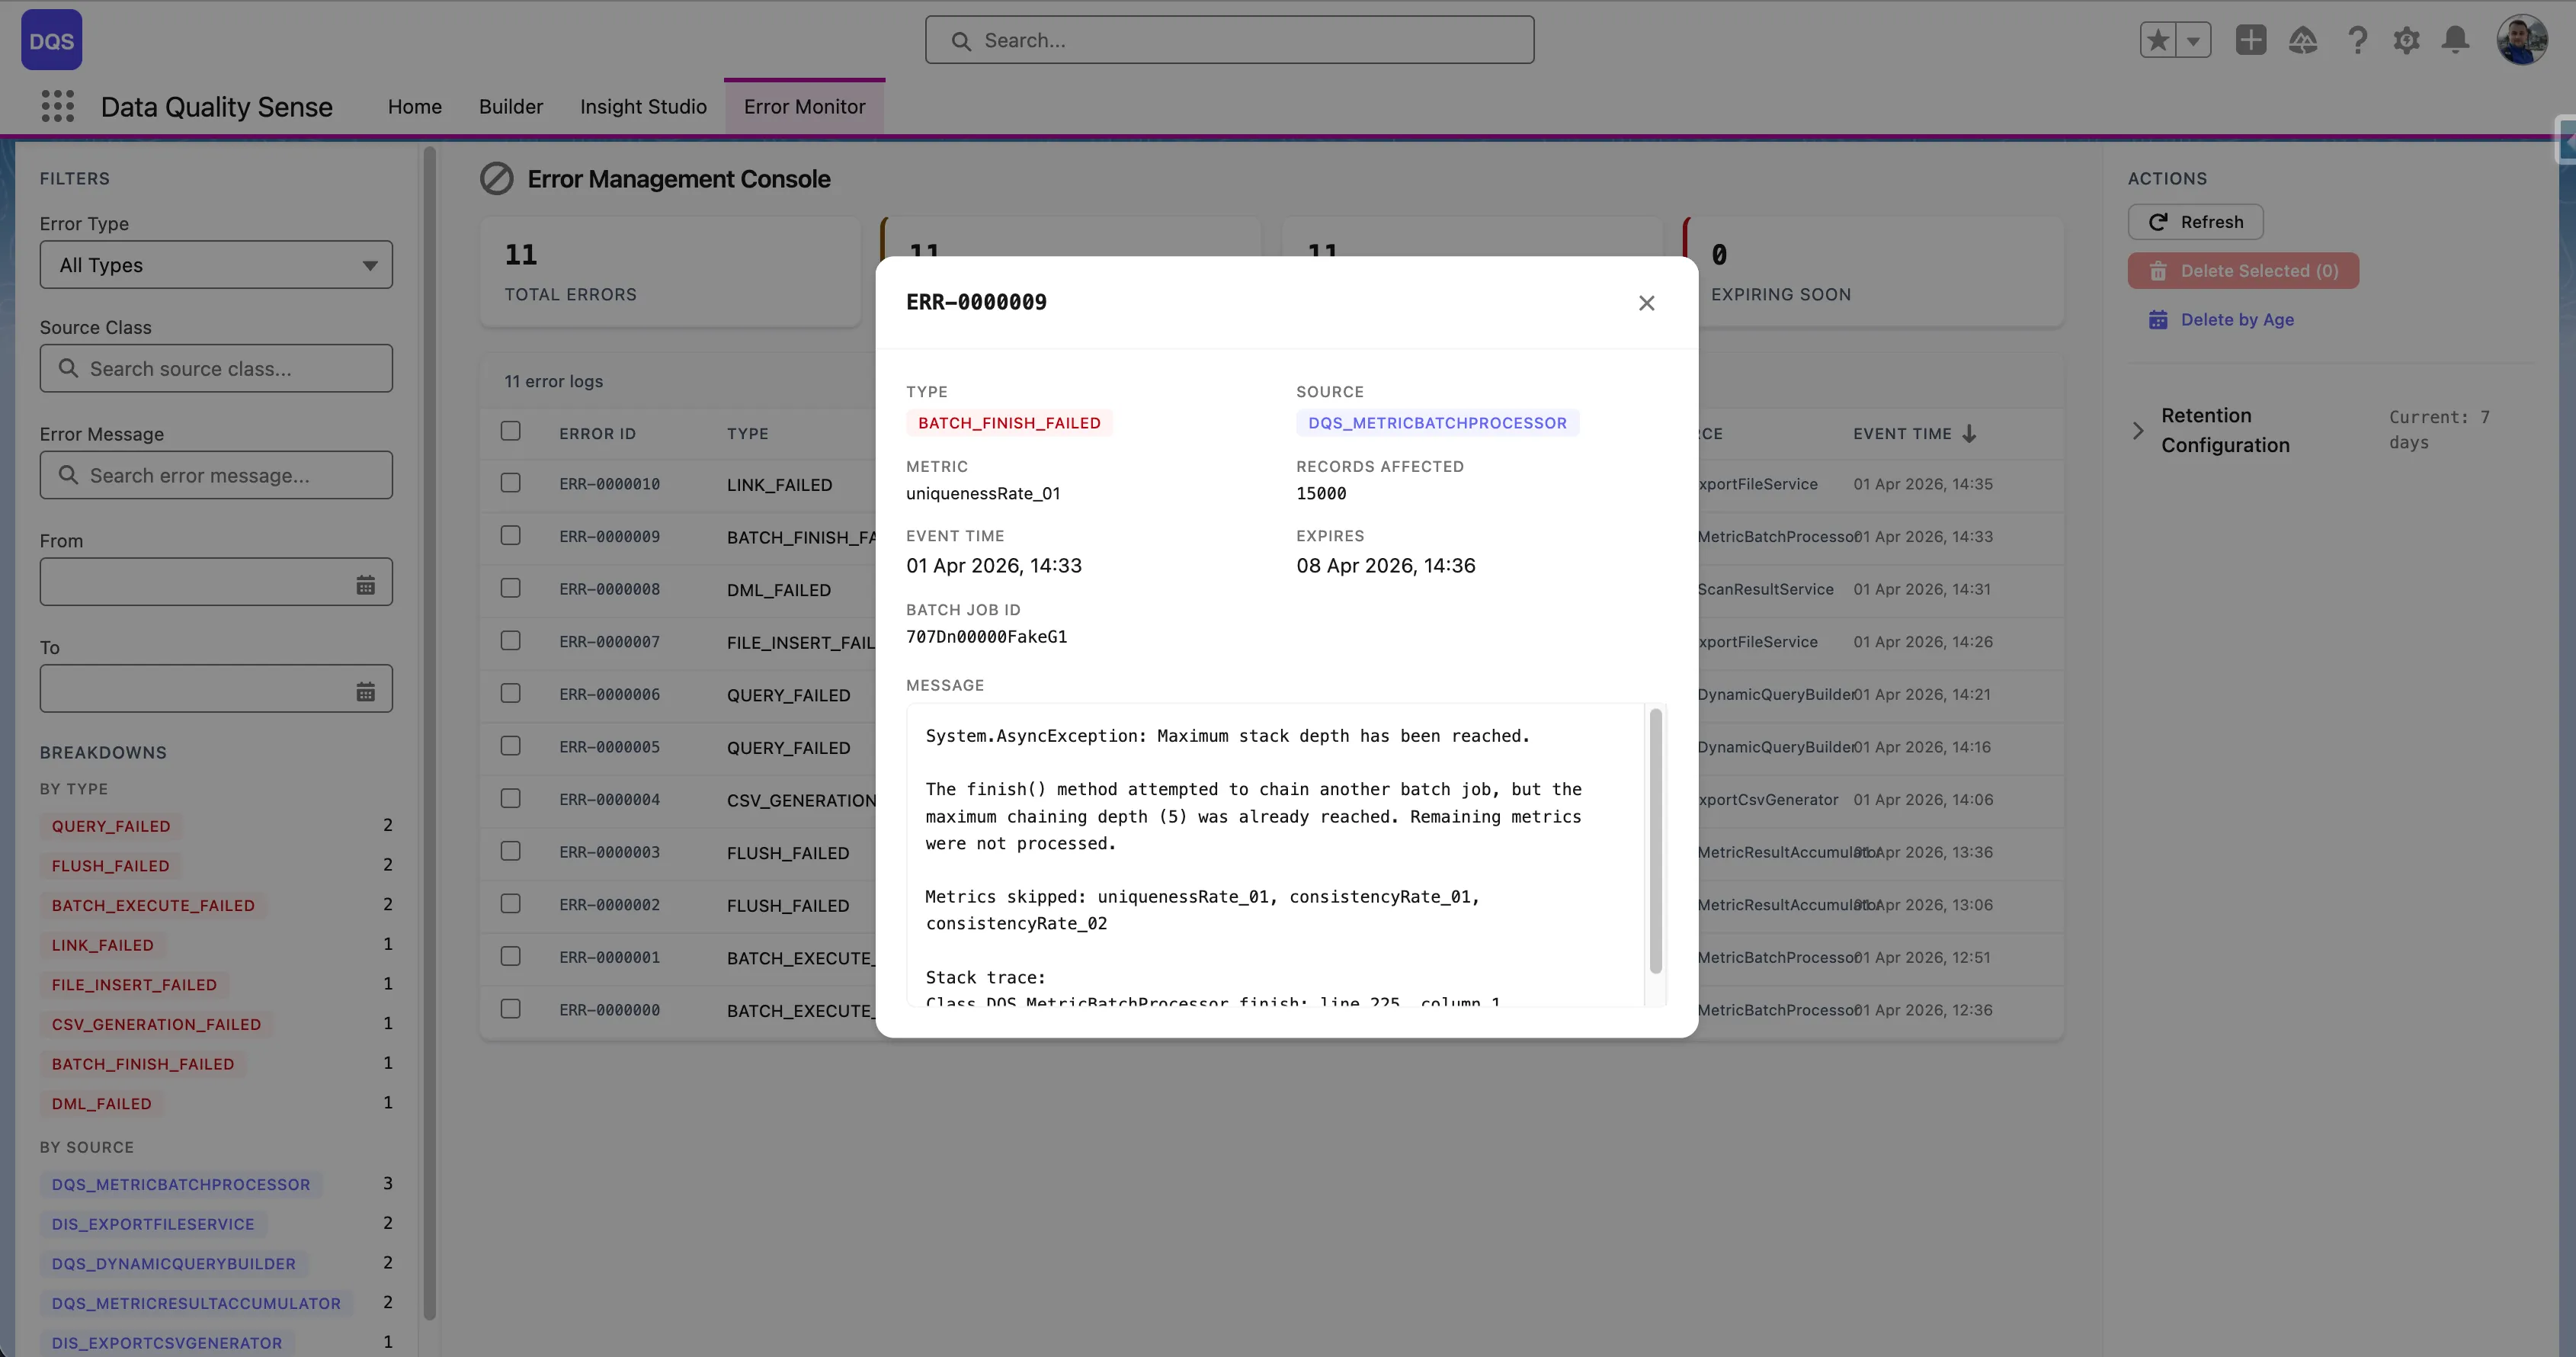
| Source | Examples |
|---|---|
| Batch Processing | Governor limit exceeded, query timeout |
| Dimension Strategy | Invalid field access, null pointer in strategy logic |
| Platform Events | Event publish failure |
| Scheduling | CRON expression issues, permission errors |
DQS uses DQS_Processing_Error__e platform events to surface errors in real time. When an error occurs during batch processing:
This replaces silent catch blocks with visible error reporting.
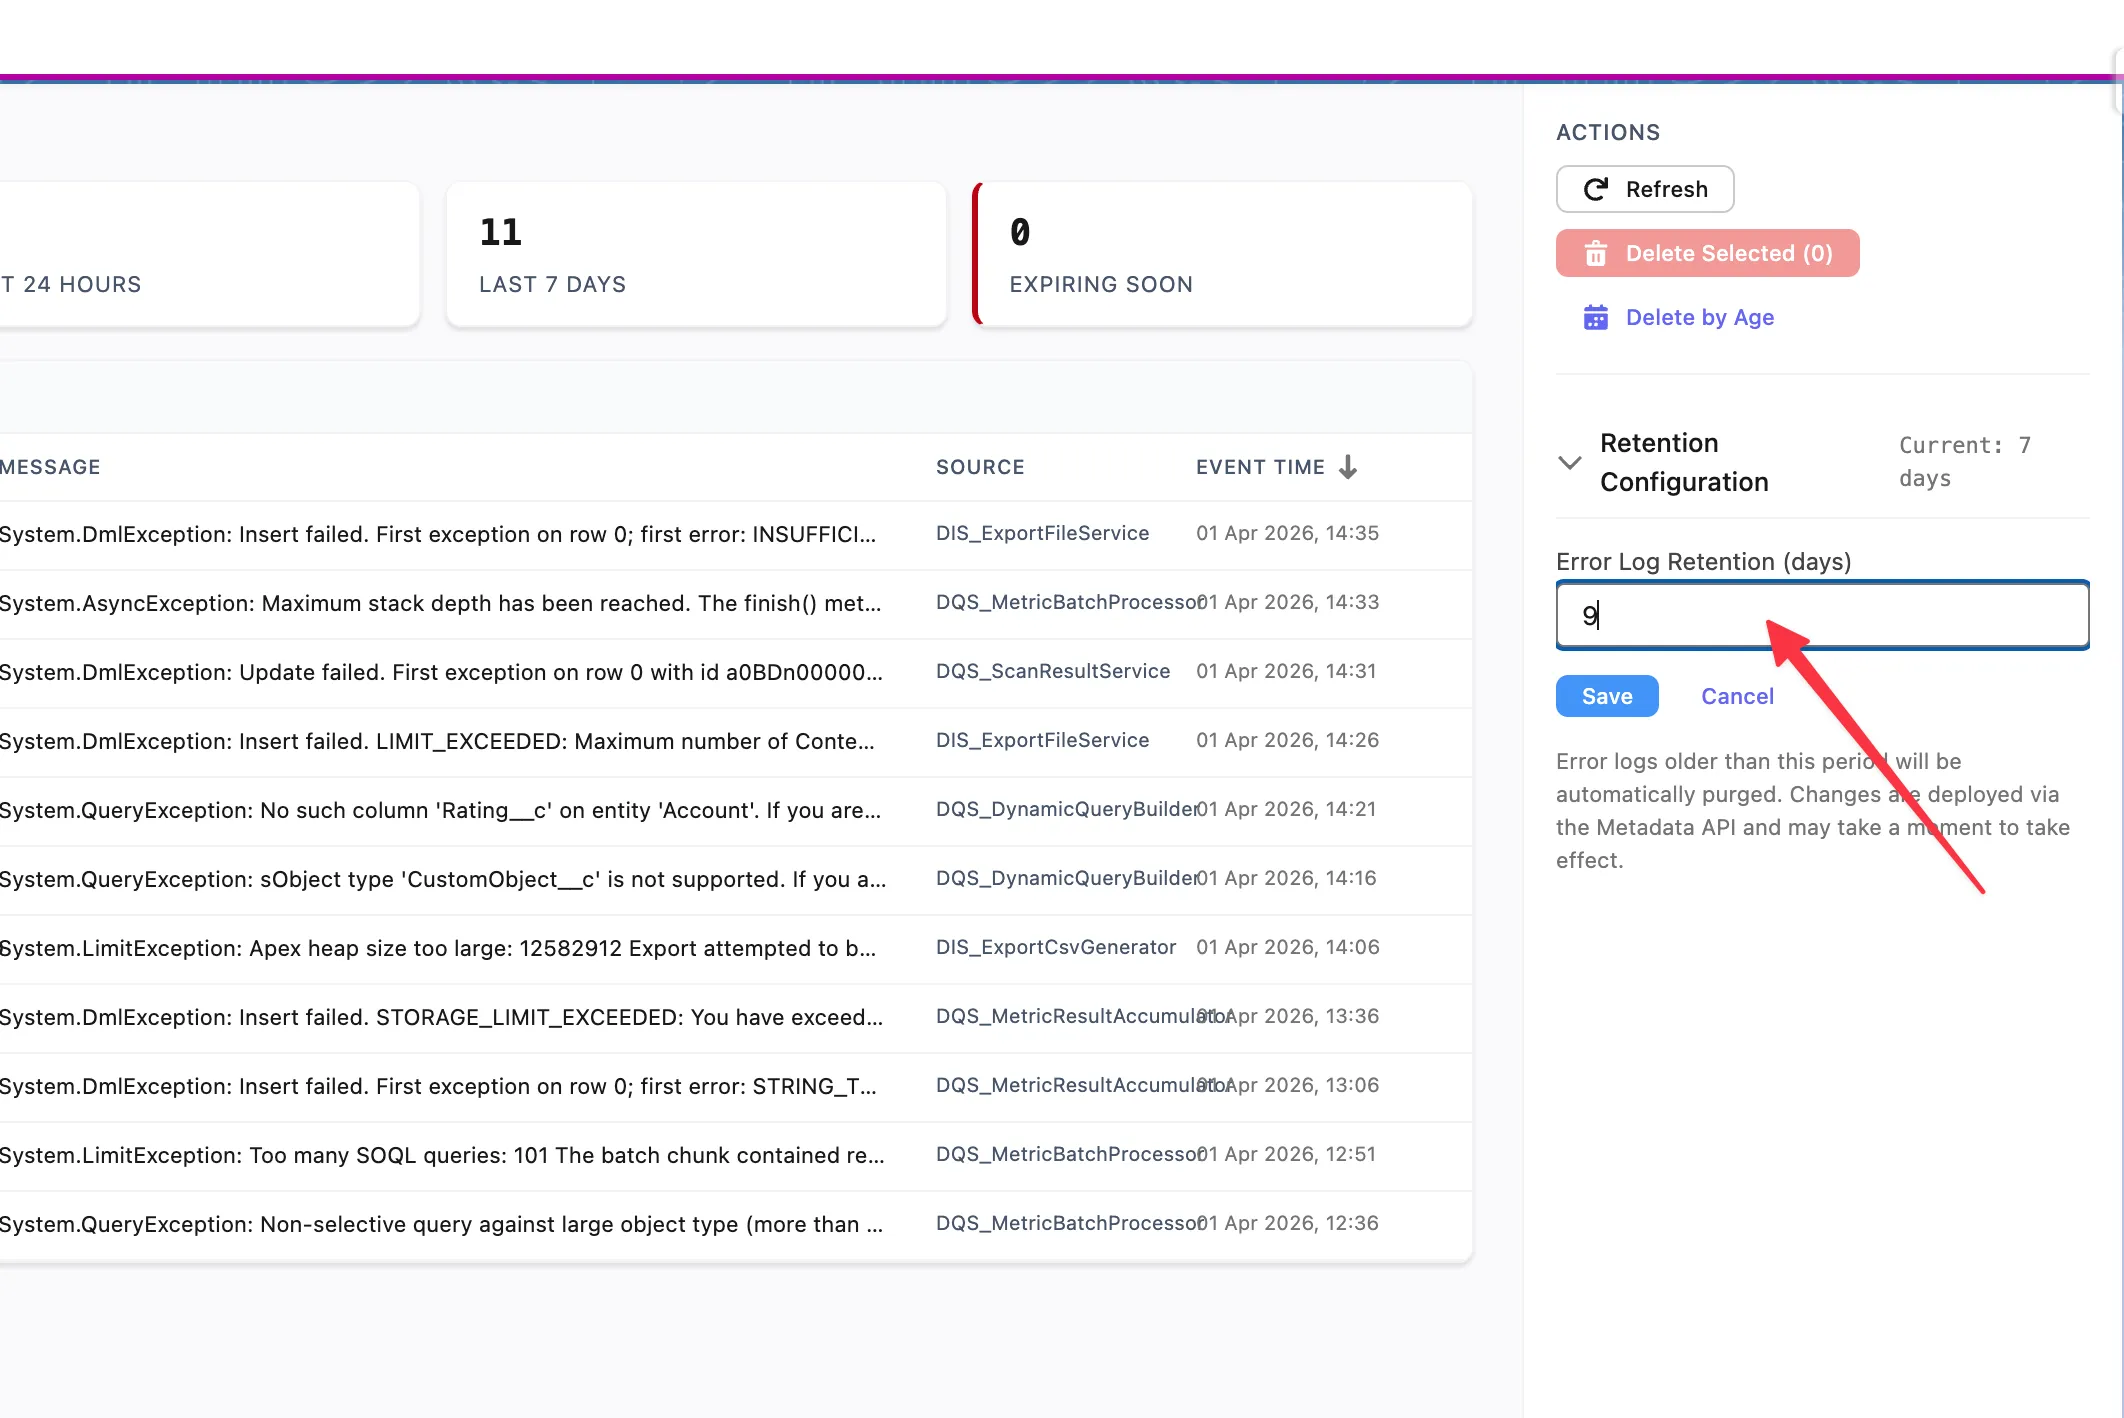
Error logs are automatically purged based on the configured retention period. The default retention is 7 days.
To change the retention period, use the Retention Configuration section in the Actions panel on the right side of the console. Enter the desired number of days in the Error Log Retention (days) field and click Save. Error logs older than the specified period will be automatically purged. Changes are deployed via the Metadata API and may take a moment to take effect.
DQS uses a set of custom objects to store definitions, results, and scheduling data. All objects use the dataqualitysens namespace prefix.
| Object | Purpose | Key Fields |
|---|---|---|
DQS_Definition__c | Scan configuration | Name, Object API Name, Status, Description |
DQS_Definition_Detail__c | Field-level config | Definition (lookup), Field API Name, Overrides |
| Object | Purpose | Relationship |
|---|---|---|
DQS_Dimension_Result__c | Per-dimension scan result | Definition (lookup) |
DQS_Field_Result__c | Per-field result within a dimension | Dimension Result (master-detail) |
DQS_Metric_Result__c | Detailed metric per field | Field Result (master-detail) |
| Object | Purpose |
|---|---|
DQS_Batch_Schedule__c | Stores schedule configuration per definition |
DQS_Definition__c ├── DQS_Definition_Detail__c (1:N) ├── DQS_Batch_Schedule__c (1:1) └── DQS_Dimension_Result__c (1:N per scan) └── DQS_Field_Result__c (1:N, master-detail) └── DQS_Metric_Result__c (1:N, master-detail)CMTs drive the configuration of capabilities and their evaluation logic. They are package-controlled and not editable by subscribers (except where noted).
| CMT | Purpose | Records |
|---|---|---|
DQS_Capability__mdt | Defines available quality dimensions | 7 (one per capability) |
DQS_Dimension__mdt | Dimension display configuration | 7 |
DQS_Metric__mdt | Metric definitions per capability | Multiple per dimension |
DQS_Input_Configuration__mdt | Input configurator settings | Per-capability config fields |
DQS_Configuration__mdt | General app settings | Retention, feature flags |
| Event | Purpose |
|---|---|
Calculation_Complete__e | Fired when a scan finishes processing |
DQS_Processing_Error__e | Fired when an error occurs during batch processing |
| Parameter | Purpose |
|---|---|
DQS_AppEnabled | Controls activation gate — whether the app is licensed and active |
Each Data Quality Sense activation comes with a fixed number of scans (20 by default). Every scan execution — manual or scheduled — counts toward this quota.
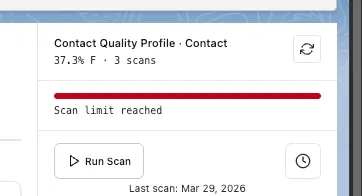
The definition card in Insight Studio displays a progress bar showing how many scans have been used. When the limit is approaching, the bar turns red and shows a Scan limit reached warning.
Once all scans are used, attempting to run a new scan triggers an error dialog informing you that the scan limit has been reached.
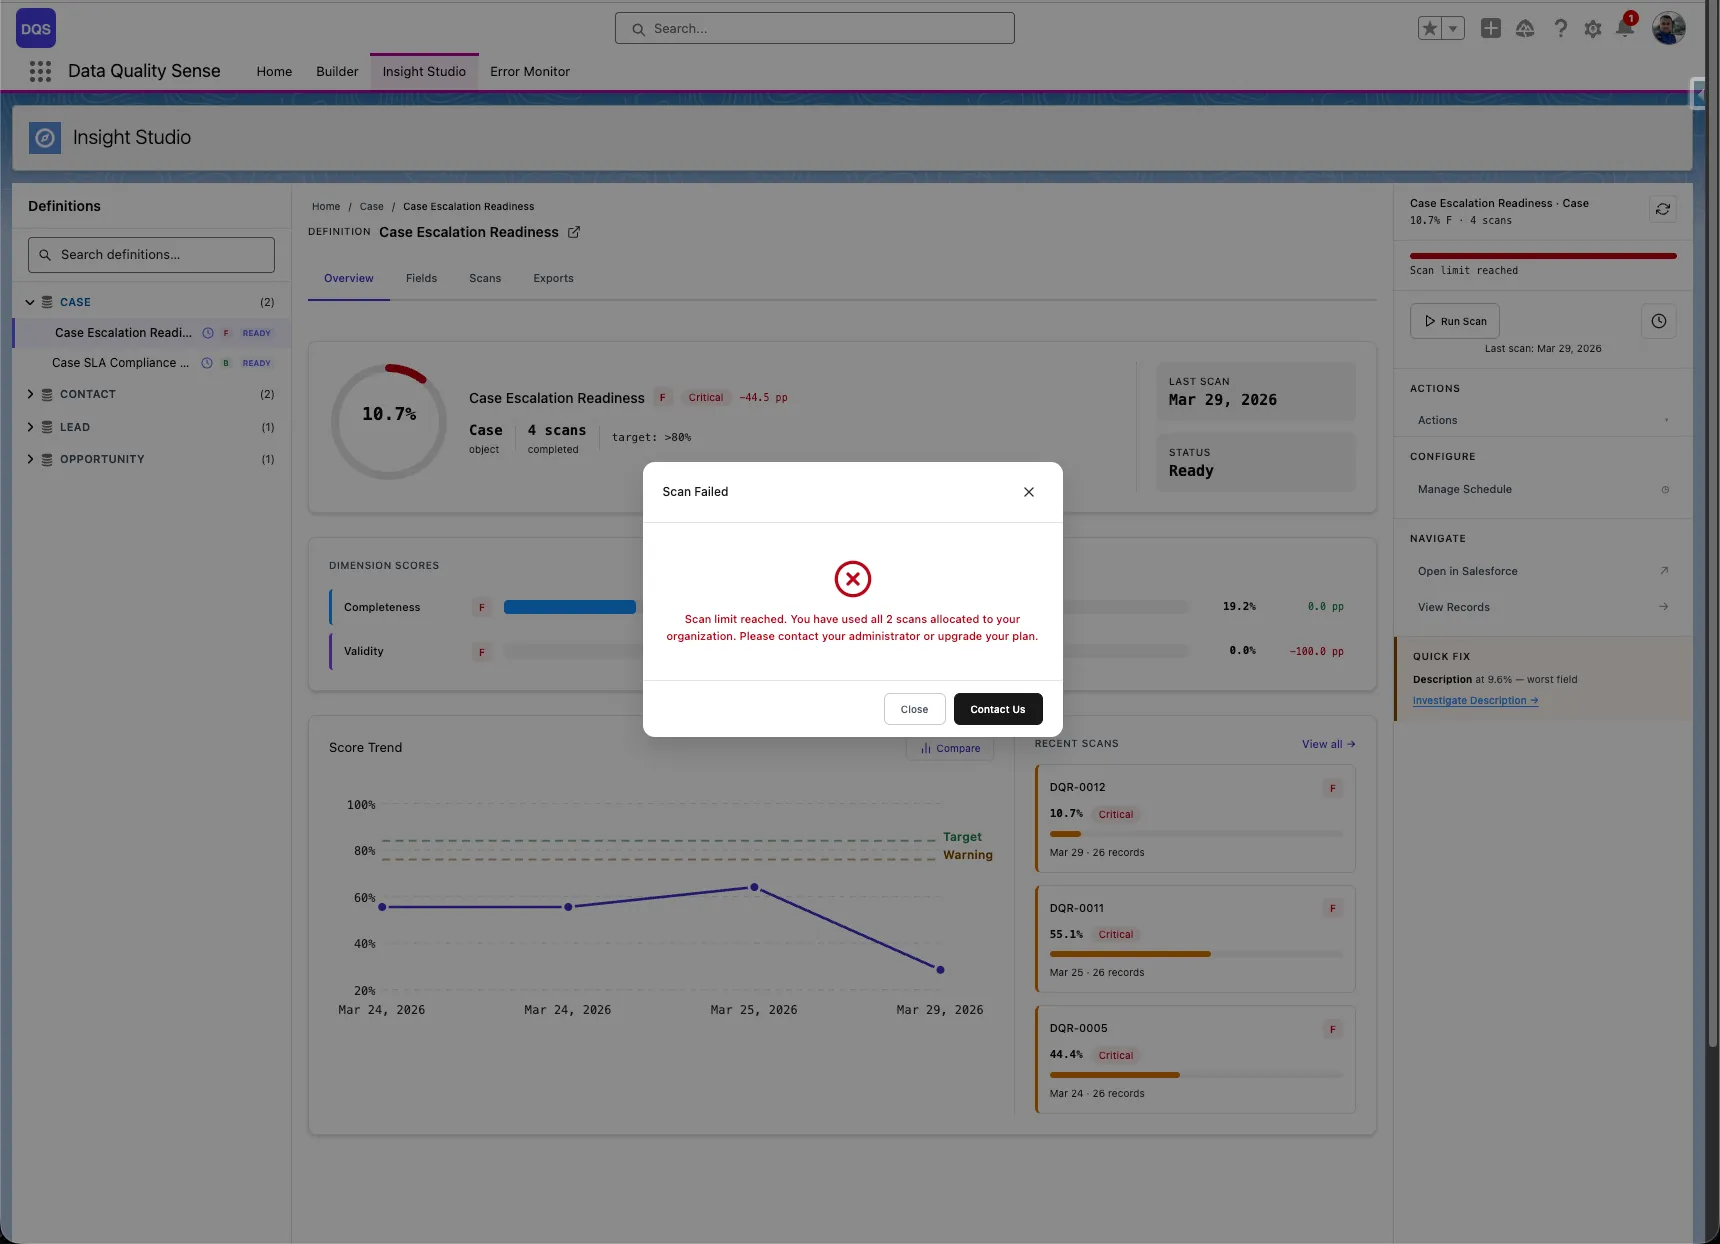
Click the Upgrade button in the error dialog to open a pre-filled email requesting additional scans. The email is addressed to hello@tucario.com and includes your Org ID automatically.
DQS runs entirely within Salesforce and is subject to standard governor limits. The processing engine is designed to work within these constraints.
| Limit | Salesforce Maximum | DQS Impact |
|---|---|---|
| Batch size | 2,000 records per chunk | Configurable via DQS settings |
| Concurrent batches | 5 per org | DQS uses 1 batch per scan |
| SOQL queries per transaction | 100 | Dynamic queries used efficiently |
| DML operations per transaction | 150 | Results batched for efficient writes |
| Heap size | 12 MB (async) | Large text fields may contribute |
| Limit | Salesforce Maximum |
|---|---|
| Scheduled Apex jobs | 100 per org |
| CRON triggers | 100 per org |
| Object Size | Expected Scan Time | Notes |
|---|---|---|
| < 10,000 records | Minutes | Fast processing |
| 10,000 – 100,000 | 10–30 minutes | Normal batch processing |
| 100,000 – 1,000,000 | 30–60 minutes | Consider off-peak scheduling |
| > 1,000,000 | 1+ hours | Schedule during maintenance windows |
More fields in a definition means more processing per record. A definition with 50+ fields will take longer than one with 10 fields.
Each enabled capability adds a dimension strategy execution per chunk. Enabling all 7 capabilities takes approximately 7x longer than enabling just one.
Scan results consume Salesforce data storage. Each scan creates:
With data retention configured, old results are automatically purged.
When “Create Tasks” is run and a record’s owner is an inactive user, the task for that record fails. Other tasks in the same batch are preserved — only the affected record is skipped. The completion summary reports it as an error.
Workaround: Reassign ownership of records with inactive owners before running Create Tasks, or use the “Assign To” field in the Task modal to assign all tasks to a specific active user.
The “Post Chatter” action requires Chatter to be enabled on the org and Feed Tracking to be enabled on the specific object being scanned. If Chatter is not enabled, the action returns a clear error message. If Feed Tracking is disabled for the object, the posts fail per-record and the completion summary reports errors.
Workaround: Enable Feed Tracking for the target object in Setup > Chatter > Feed Tracking before running Post Chatter.
When “Mention Record Owner” is checked, each Chatter post is created individually rather than in bulk. For large violation sets (500+ records), processing time may be noticeably longer.
Workaround: For large datasets, consider unchecking “Mention Record Owner” for faster processing, then manually notifying owners if needed.
All actions (Export, Create Tasks, Post Chatter) re-evaluate violations against the current state of the data — not the scan results displayed in the UI. If records have been updated since the last scan, the action may find different violations than what is shown on screen.
Workaround: Run a fresh scan before taking actions if data freshness is critical.
When an action is run across multiple fields and dimensions, a record that violates in multiple combinations will receive one task or Chatter post per combination. Duplicate prevention only operates within a single field+dimension scope.
Example: A record with violations on both Email (Validity) and Phone (Completeness) will receive two separate tasks with different subjects.
If two users run the same action on the same definition at the same time, both deduplication checks pass and duplicate tasks or Chatter posts may be created.
Workaround: Coordinate with team members to avoid running the same action on the same definition simultaneously.
Scans evaluate all monitored fields, including formula and rollup summary fields. If violations are found on these read-only fields, tasks or Chatter posts are still created — but the record owner cannot directly fix the value since it is calculated.
Workaround: When configuring the scan definition, consider excluding formula and rollup fields from dimensions where violations are not remediable by the record owner.
Definitions with heavy export usage may not show all exported files in the Export History panel — the oldest files are excluded. The files still exist as Salesforce Files and can be found via the Files tab.
Workaround: Delete old exports to make room for newer ones in the panel.
The “Download All” action triggers multiple file downloads in sequence. Some browser security settings or extensions may block or warn about multiple simultaneous downloads.
Workaround: Allow multiple downloads for the Salesforce domain in your browser settings, or download files individually.
Data Quality Sense works with Enterprise, Unlimited, and Developer editions. It requires Lightning Experience to be enabled.
No. DQS is 100% Salesforce-native. All processing, storage, and visualization happens within your Salesforce org. No data leaves your org.
dataqualitysens namespace?It’s the managed package namespace for Data Quality Sense. All custom objects, Apex classes, and LWC components are prefixed with this namespace to avoid naming conflicts with your existing customizations.
Yes, and we recommend it. Install in a sandbox to evaluate the product, then install in production when ready.
No. DQS only reads your existing data during scans. It never modifies your business data. It creates its own custom objects to store scan configurations and results.
Use the same installation URL. Salesforce detects the existing package and offers an upgrade path. Your definitions and results are preserved.
There is no hard limit on the number of definitions. However, each definition with an active schedule consumes one Salesforce scheduled Apex slot (maximum 100 per org).
Yes. DQS can scan any standard or custom SObject that you have read access to.
No. The target object is set at creation time and cannot be changed. Create a new definition for a different object.
It depends on the number of records, fields, and capabilities. A typical scan of 10,000 records with 3 capabilities takes a few minutes. See Limits for detailed estimates.
Each scan uses one Salesforce batch job. Salesforce allows up to 5 concurrent batch jobs per org, so theoretically yes — but we recommend staggering scans to avoid governor limit issues.
The error is logged in the Error Management Console via platform events. Partial results from completed dimensions are preserved.
By default, scan results are retained for 30 days and error logs for 7 days. These can be adjusted via retention settings.
Yes. Insight Studio supports CSV export of violation details for any dimension.
A score of 0 means there was no data to measure (zero denominator) — not necessarily that all data is bad. For example, if all fields are null, Completeness can’t calculate a meaningful fill rate.
Visit dataqualitysense.com for support options, documentation updates, and contact information.