Scores & Trends
Score Display
Section titled “Score Display”Every level in Insight Studio shows quality scores with visual indicators:
Score Grades
Section titled “Score Grades”| Score Range | Grade | Color |
|---|---|---|
| 90–100 | Excellent | Green |
| 75–89 | Good | Light Green |
| 50–74 | Fair | Yellow/Orange |
| 25–49 | Poor | Orange |
| 0–24 | Critical | Red |
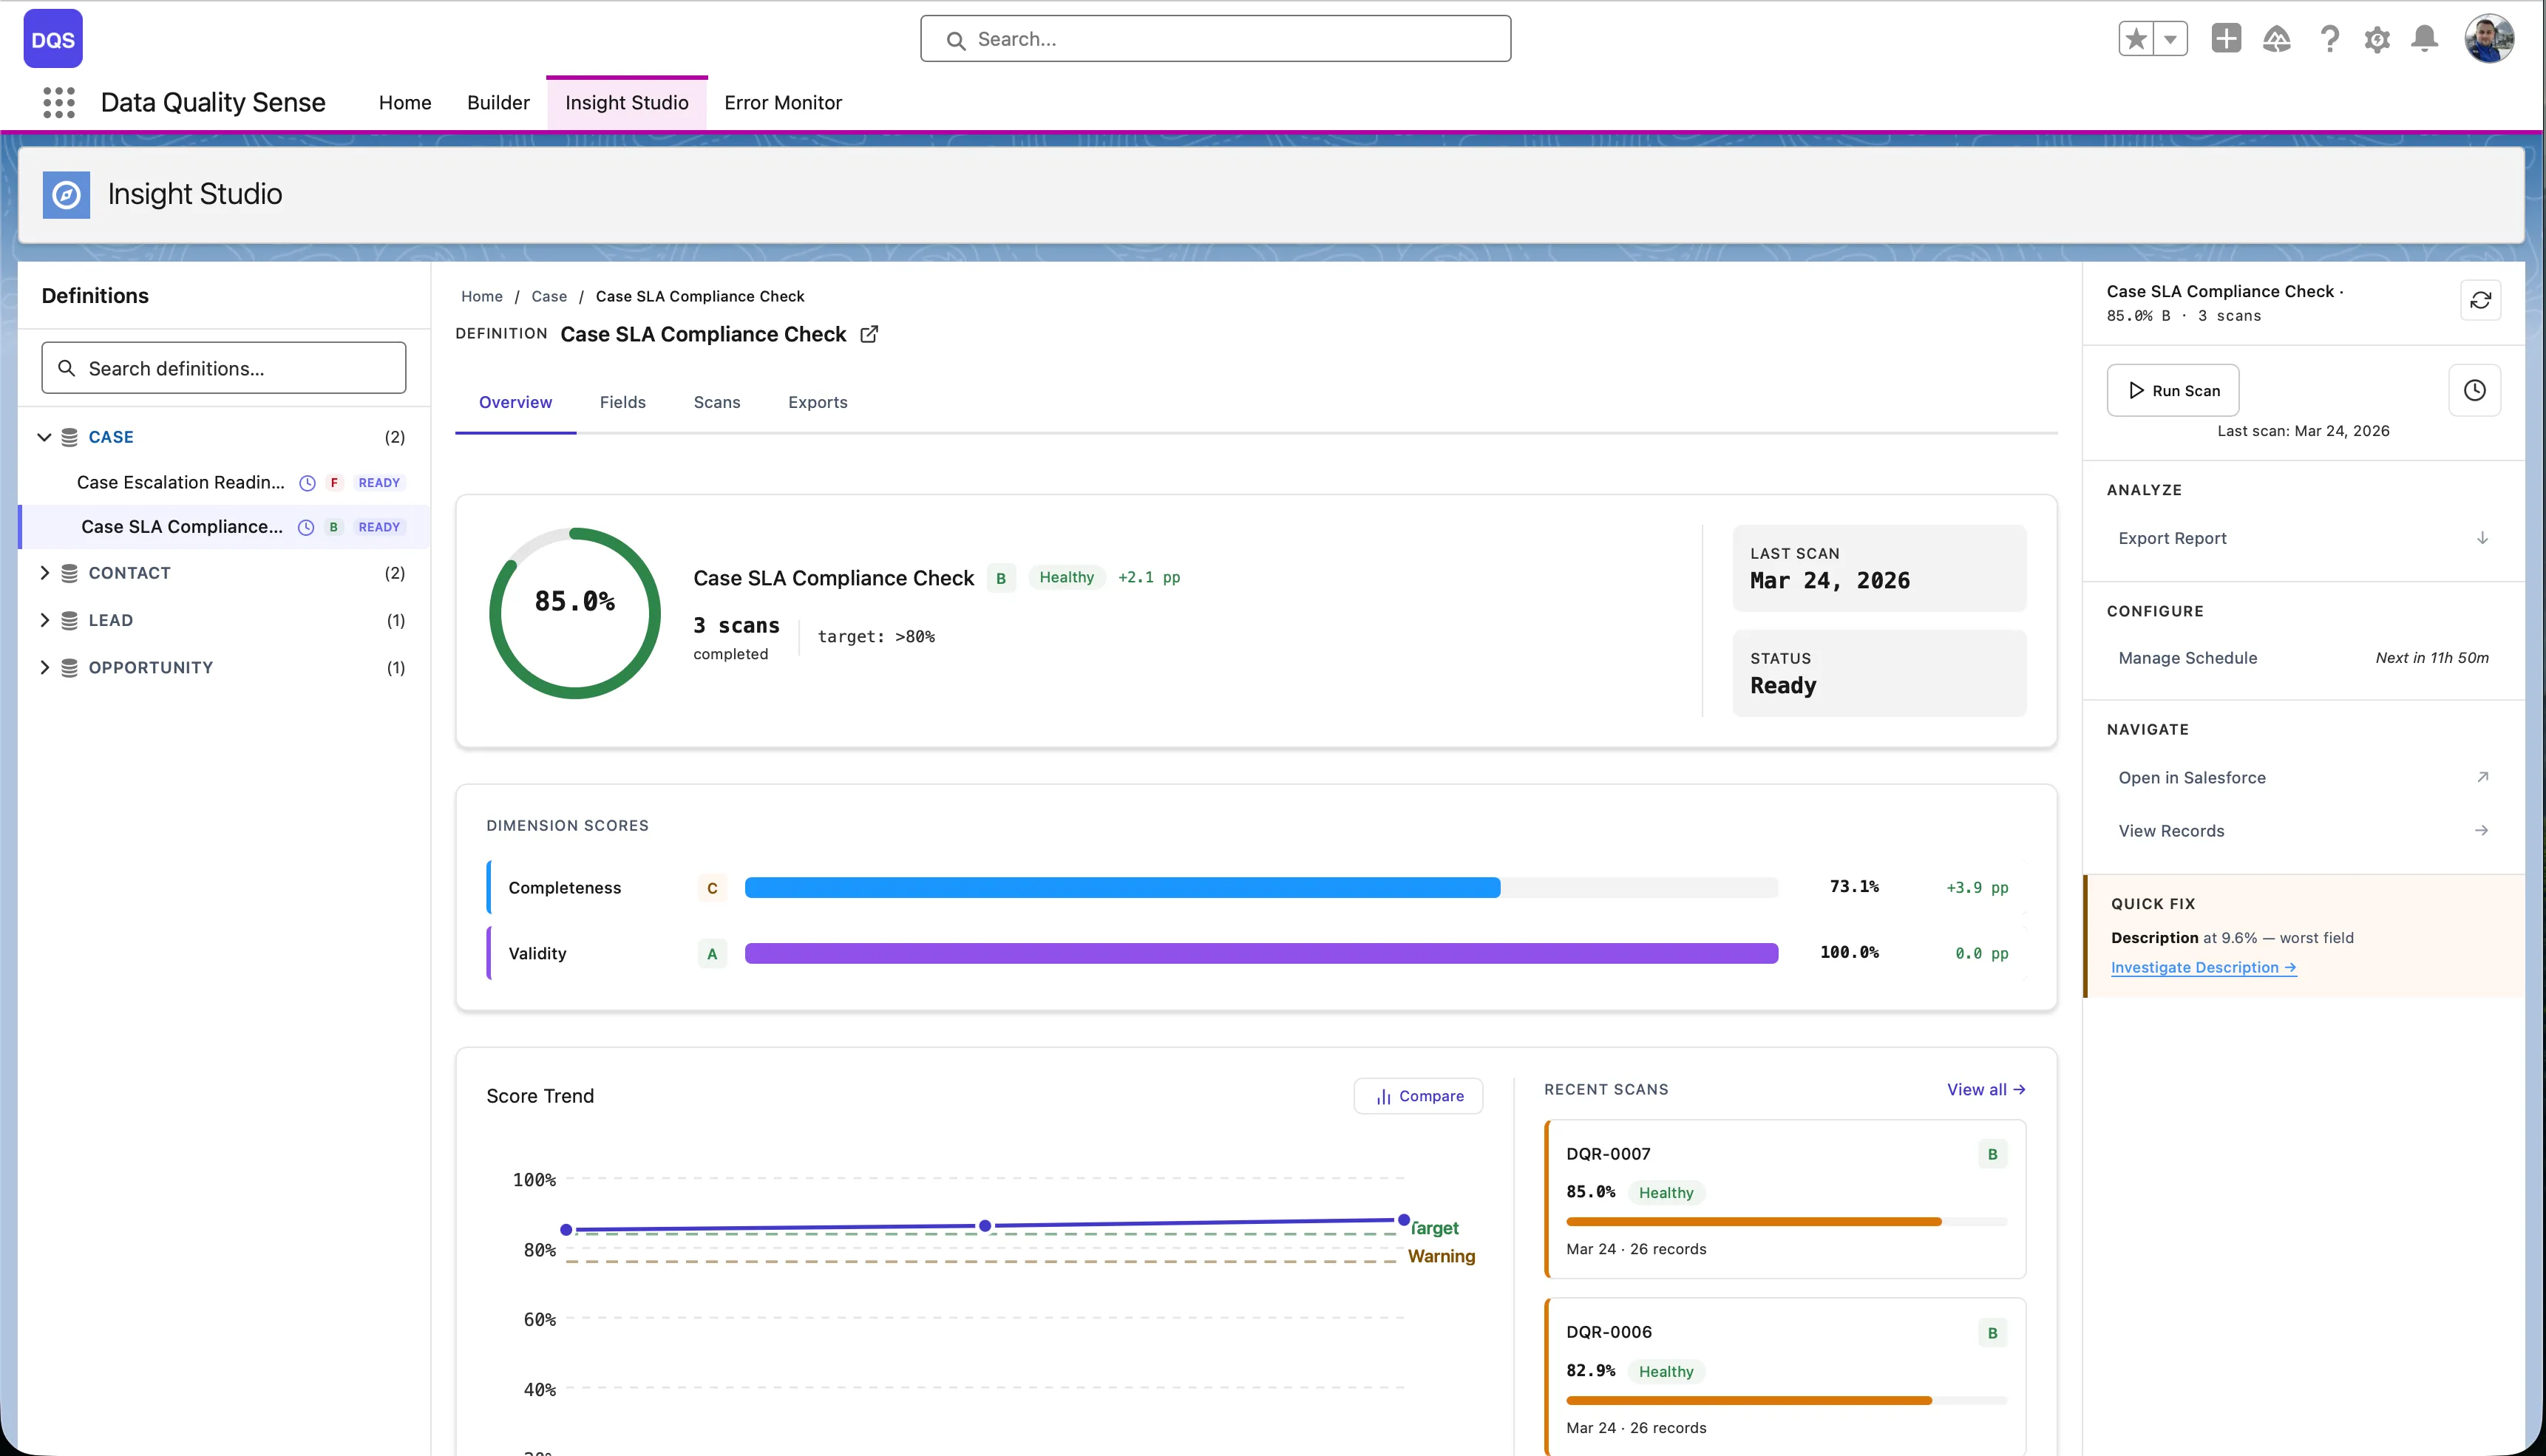
Score Cards
Section titled “Score Cards”The definition dashboard shows dimension cards — one for each enabled capability — with:
- Numeric score (0–100)
- Grade indicator (color-coded)
- Change arrow (↑ improvement, ↓ regression, → stable)
- Sparkline showing recent trend
Trend Analysis
Section titled “Trend Analysis”Sparklines
Section titled “Sparklines”Small inline charts next to each score showing the last several scan results. Useful for spotting trends without navigating to detailed views.
Score Trend Chart
Section titled “Score Trend Chart”A larger trend chart available at the definition level showing:
- Score over time for each dimension
- Overall score trend line
- Scan dates on the x-axis
Scan Comparison
Section titled “Scan Comparison”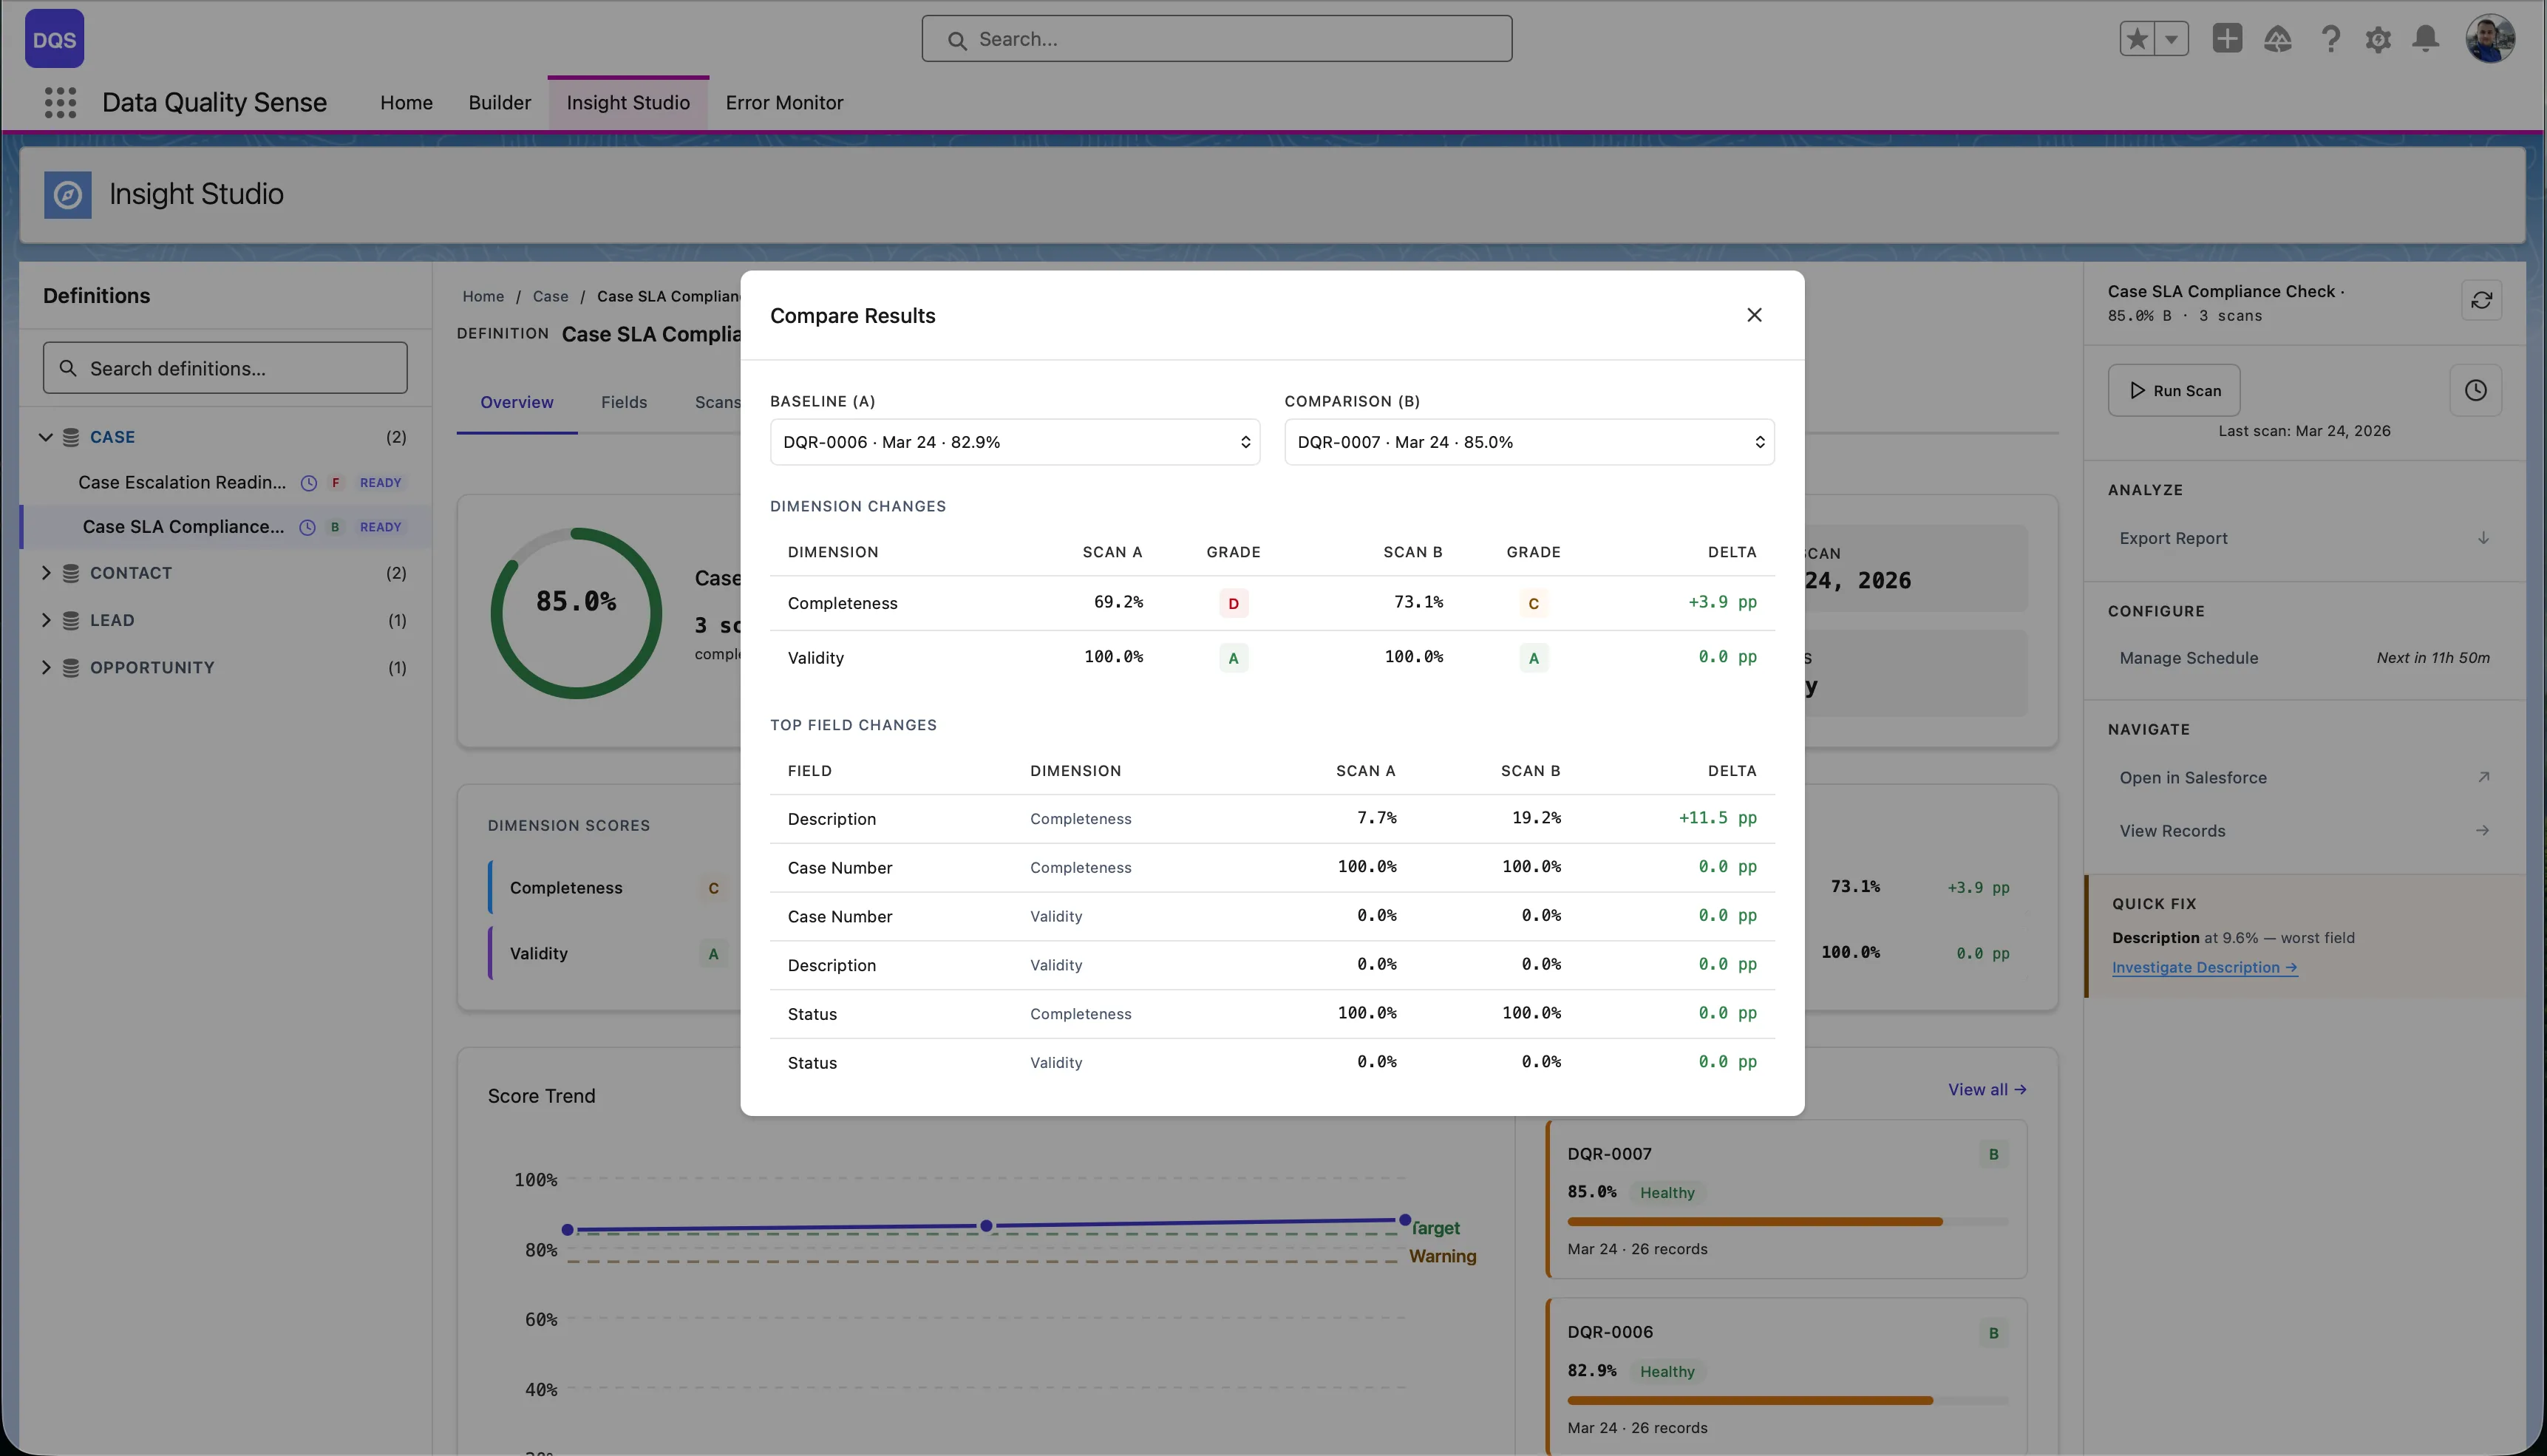
Compare two specific scans to see detailed deltas:
- Dimension deltas — Which capabilities improved or regressed
- Field deltas — Which fields changed and by how much
- Select any two scans from the scan history
Two-State Views
Section titled “Two-State Views”Some components adapt based on data availability:
- No scans yet — Shows a prompt to trigger the first scan
- Results available — Shows the full dashboard with scores and charts
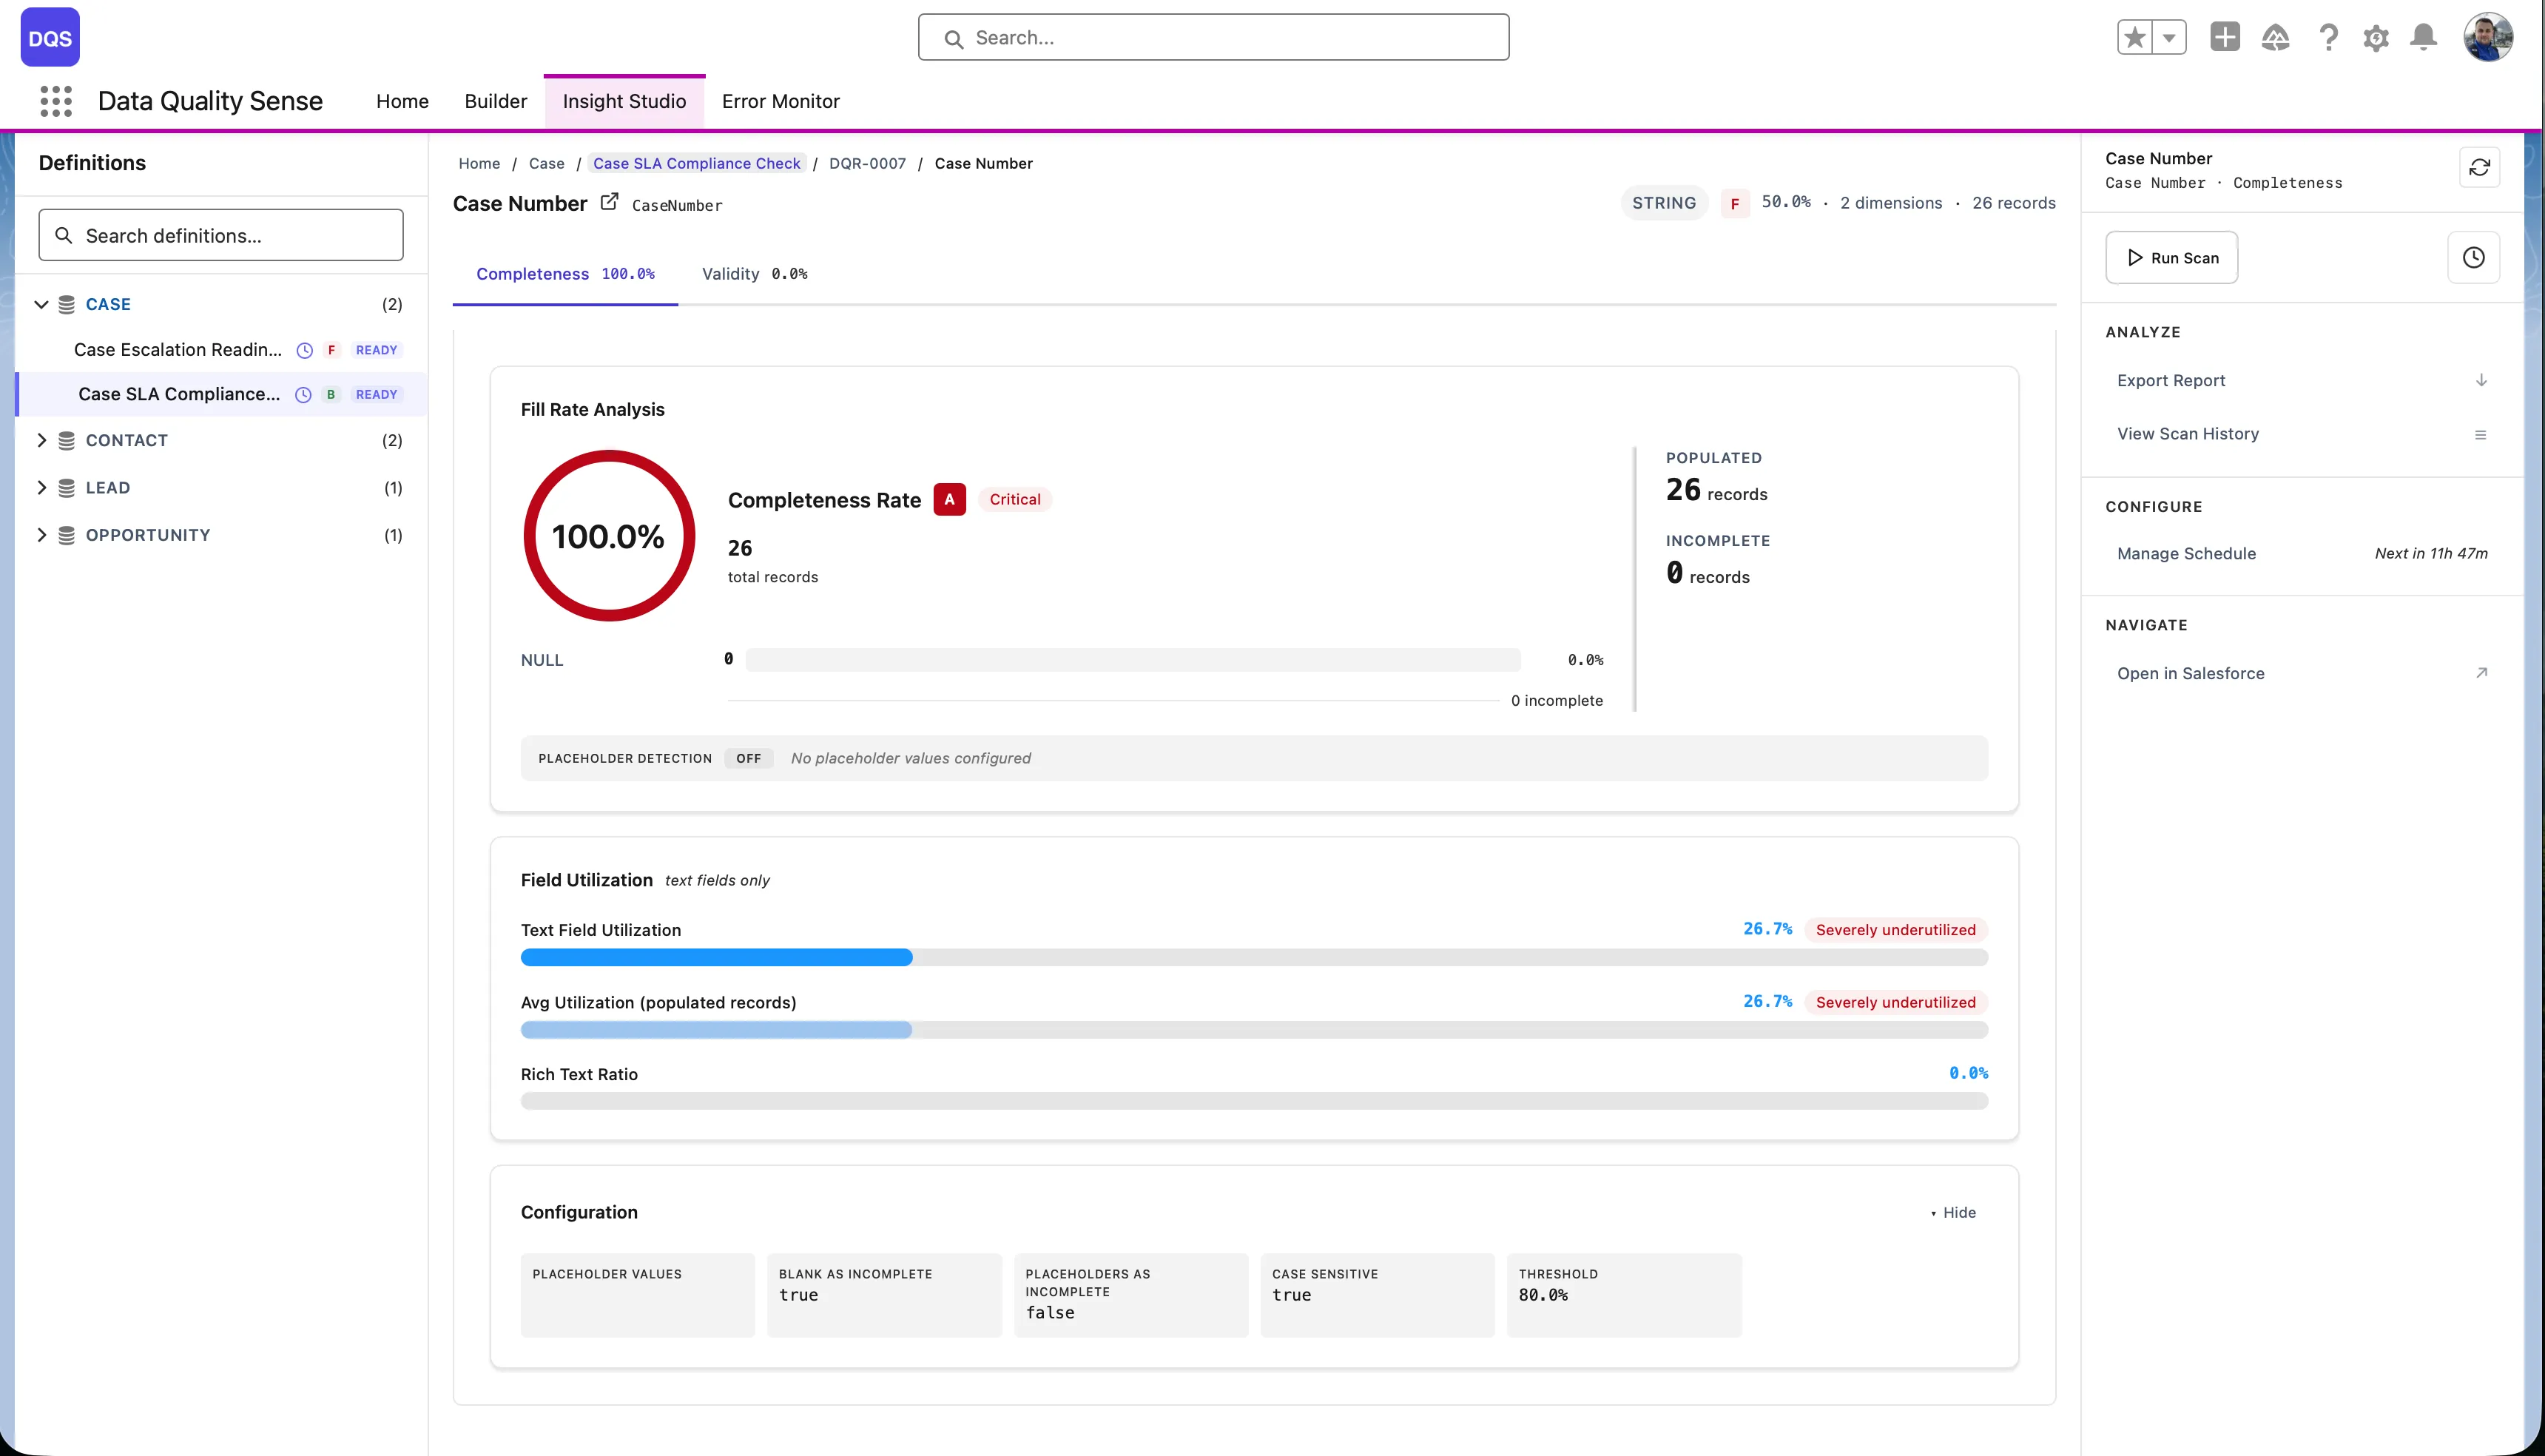
KPI Summary
Section titled “KPI Summary”The top of the definition view shows key performance indicators:
- Overall Score — Weighted average across all dimensions
- Fields Scanned — Total fields included
- Records Evaluated — Total records in scope
- Last Scan — Timestamp of the most recent scan