Score Overview
At-a-glance quality scores for each dimension, with overall ratings and grade indicators.
Insight Studio (DIS) is the visualization and analytics layer of Data Quality Sense. It consumes scan results and presents them as interactive dashboards, charts, and recommendations.
Insight Studio uses a 3-zone layout:
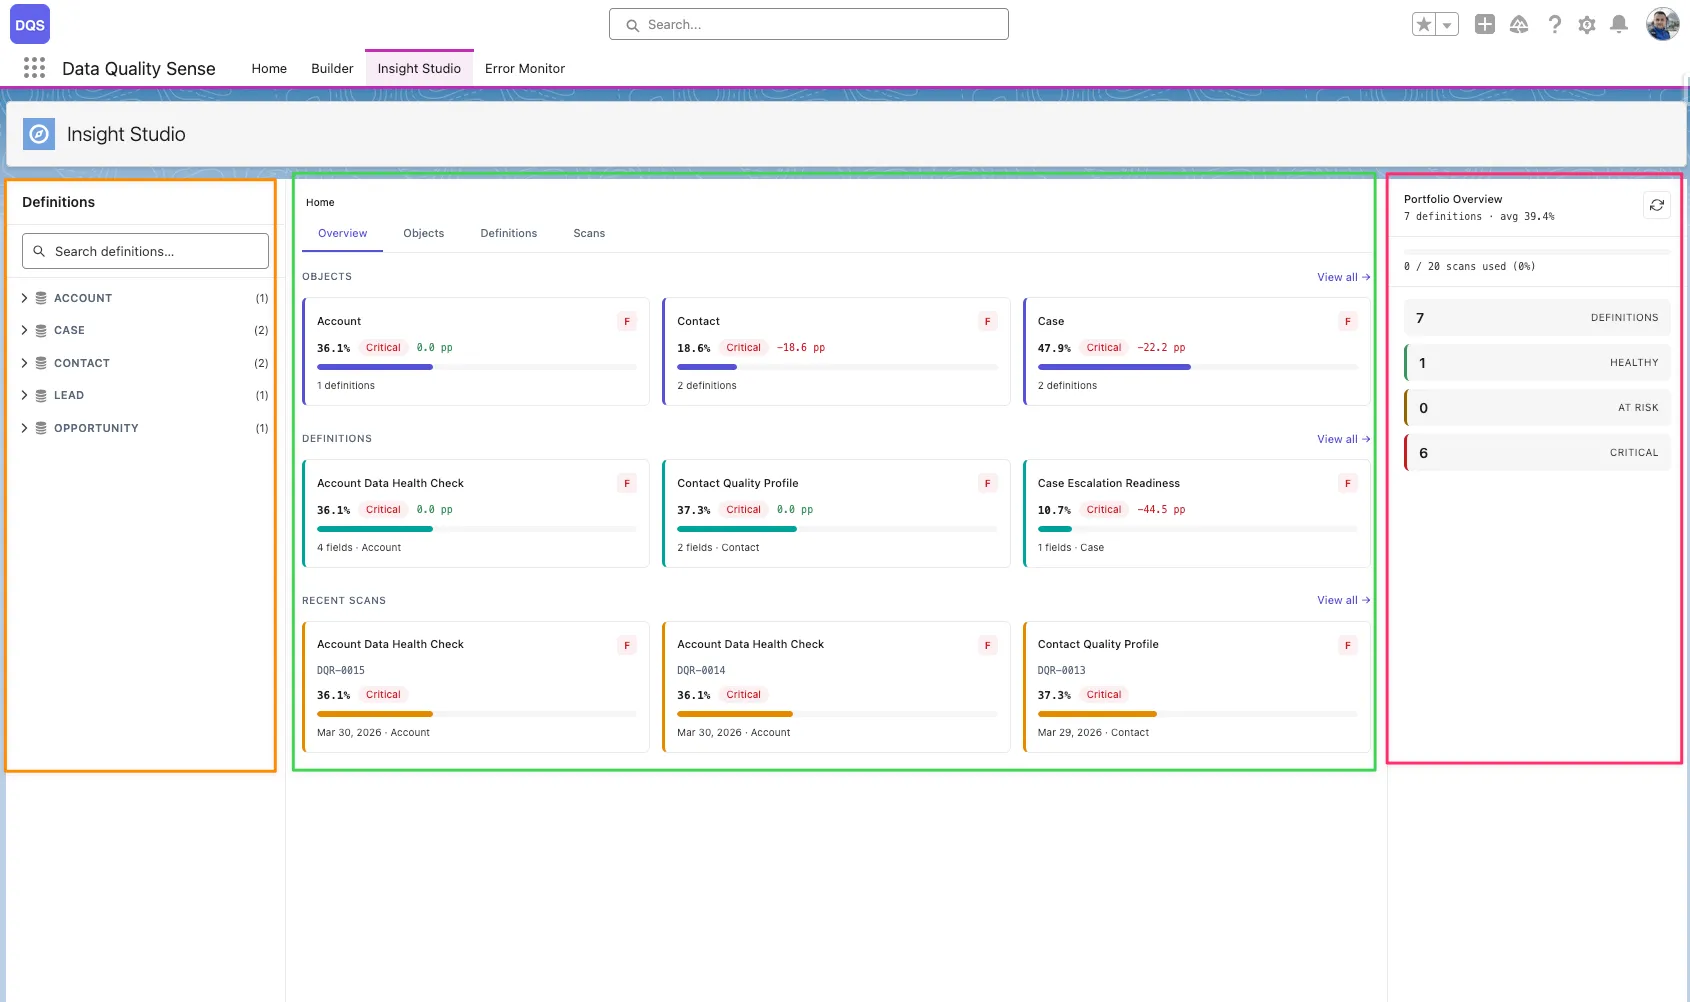
Score Overview
At-a-glance quality scores for each dimension, with overall ratings and grade indicators.
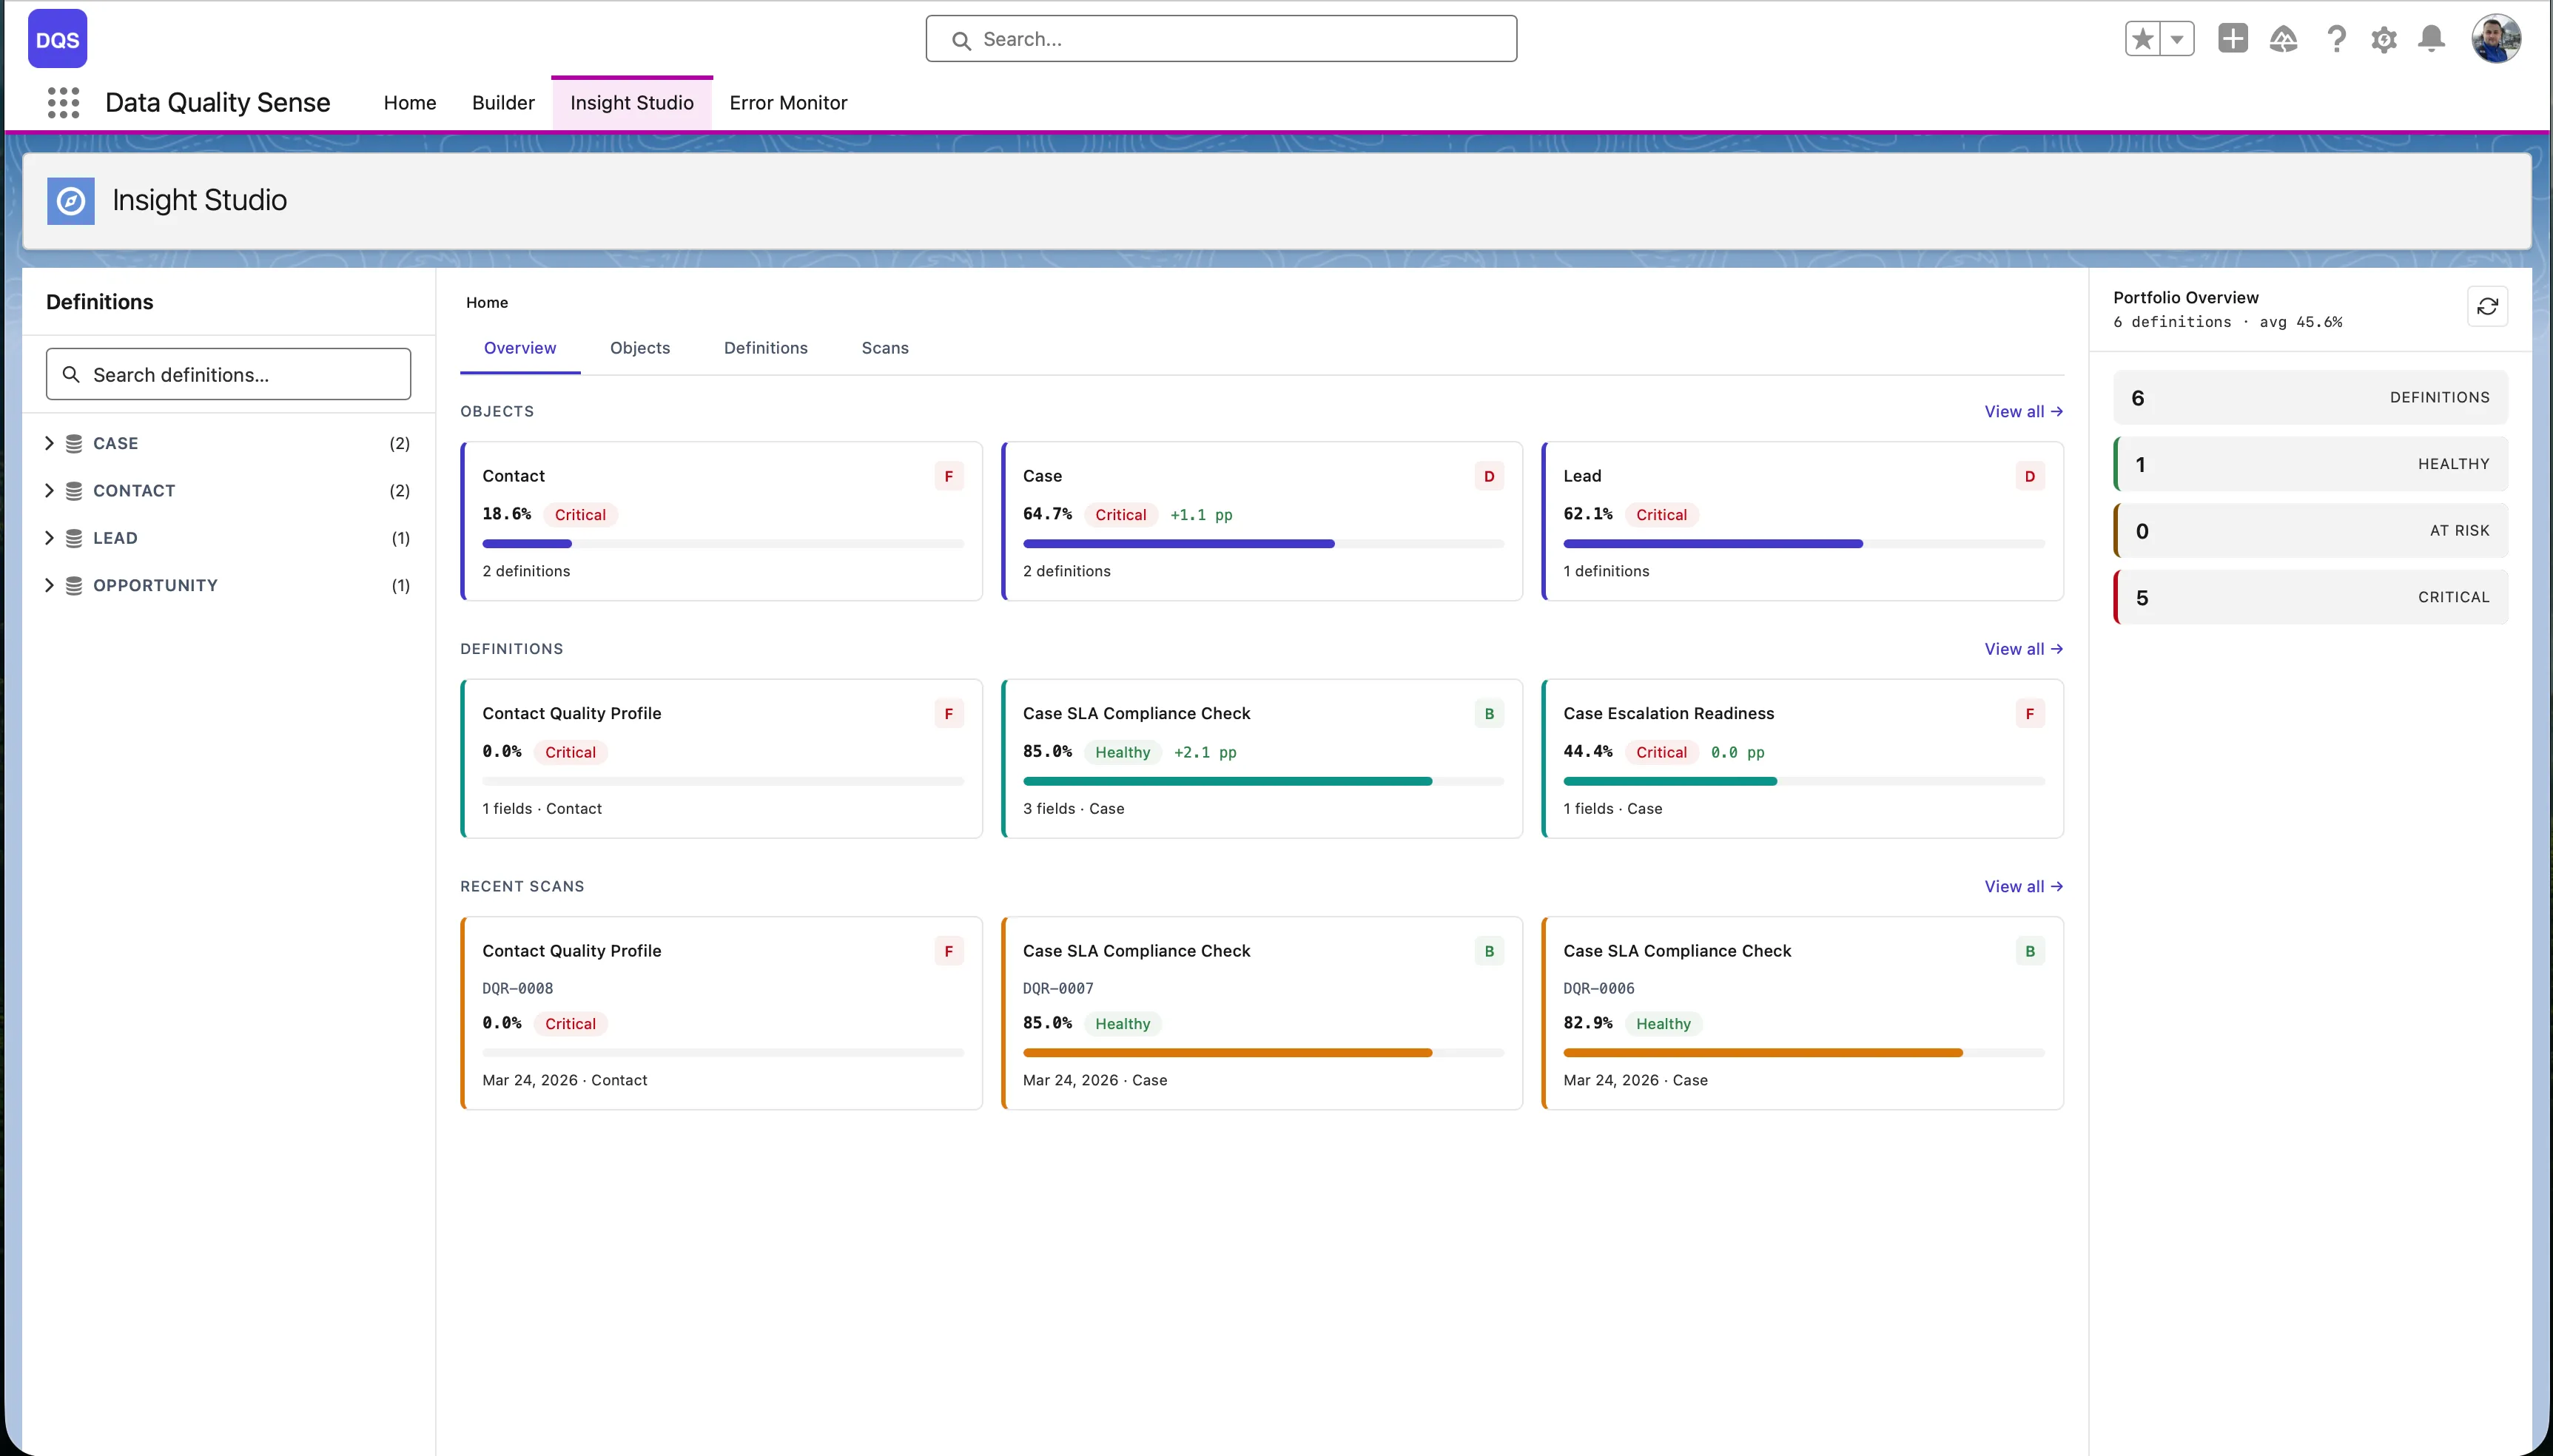
Trend Analysis
Sparklines and trend charts showing how data quality changes over time across scans.
Field Health
Matrix view of every field’s quality score per dimension. Quickly spot the weakest fields.
AI Mentor
Contextual recommendations based on scan results. Suggests actions to improve data quality.
| Feature | Description |
|---|---|
| Multi-level navigation | Drill from Home → Object → Definition → Scan → Field → Dimension |
| Score comparison | Compare results between two scans to see improvement or regression |
| Actions menu | Create Tasks, Post Chatter, or Export CSV for impacted records |
| Scan trigger | Manually trigger a scan from the dashboard |
| Schedule management | Create and manage scan schedules |