Navigation
Navigation Depth
Section titled “Navigation Depth”Insight Studio provides a 6-level drill-down hierarchy:
Home → Object → Definition → Scan → Field → DimensionLevel 1: Home
Section titled “Level 1: Home”The top-level view showing all scanned objects with their latest quality scores. Use this to identify which objects need attention.
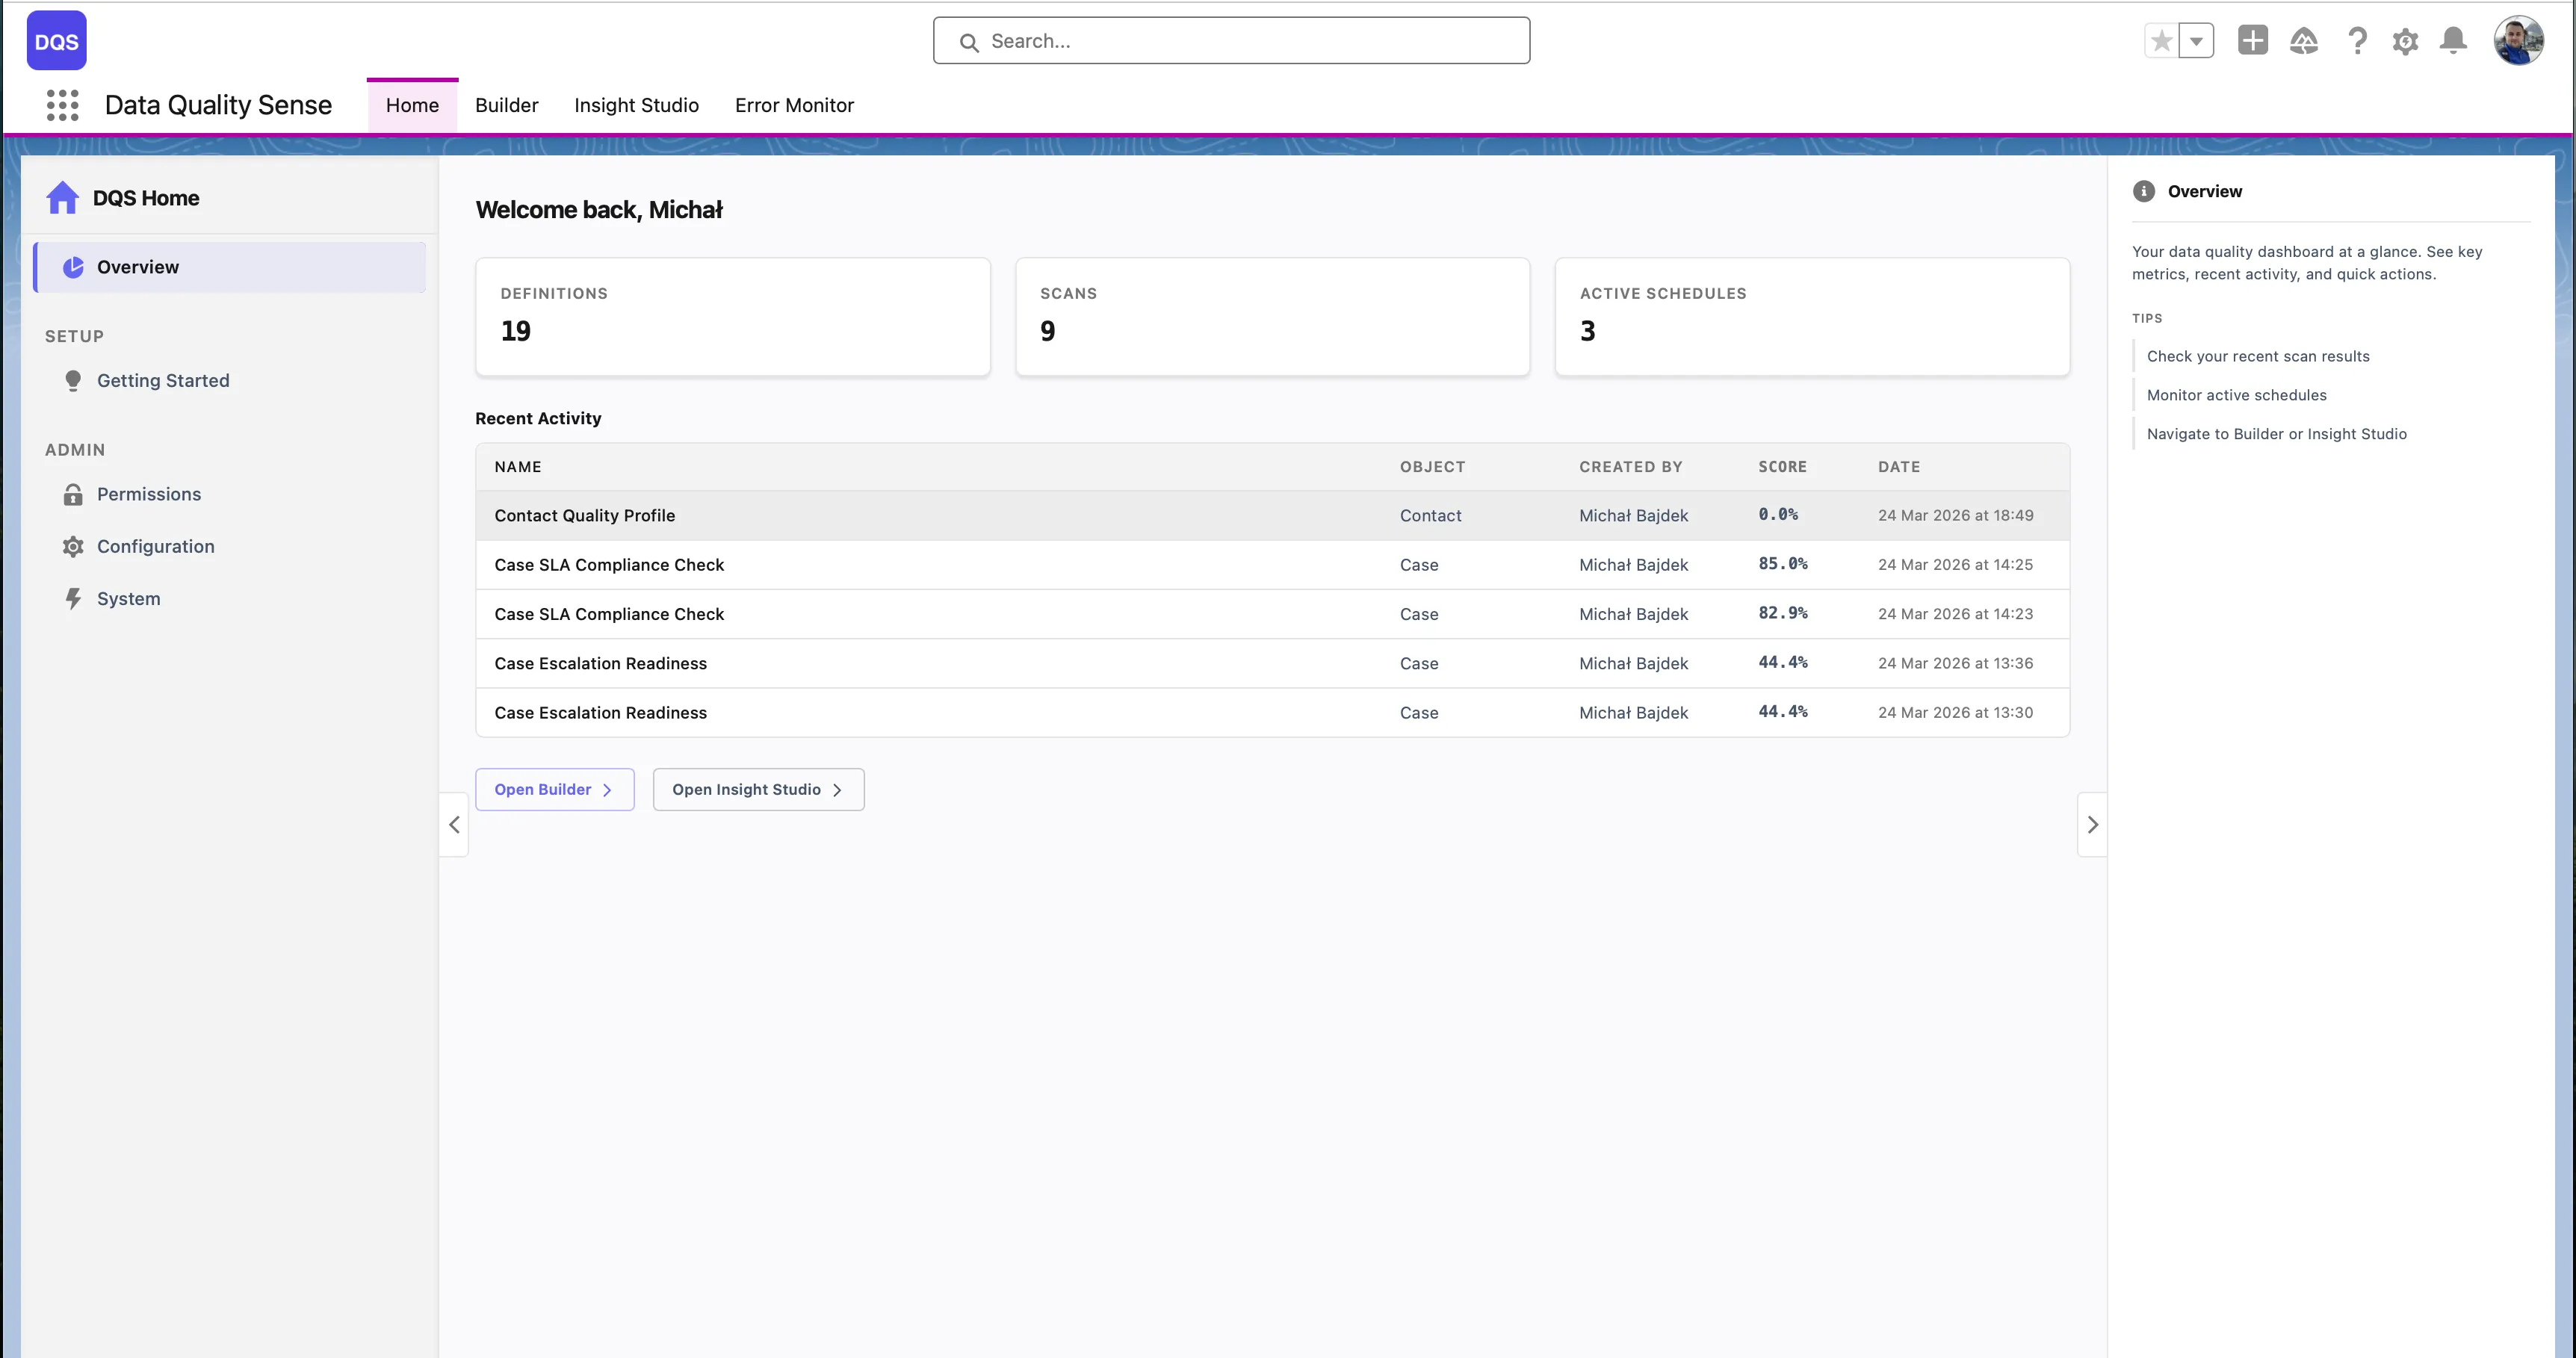
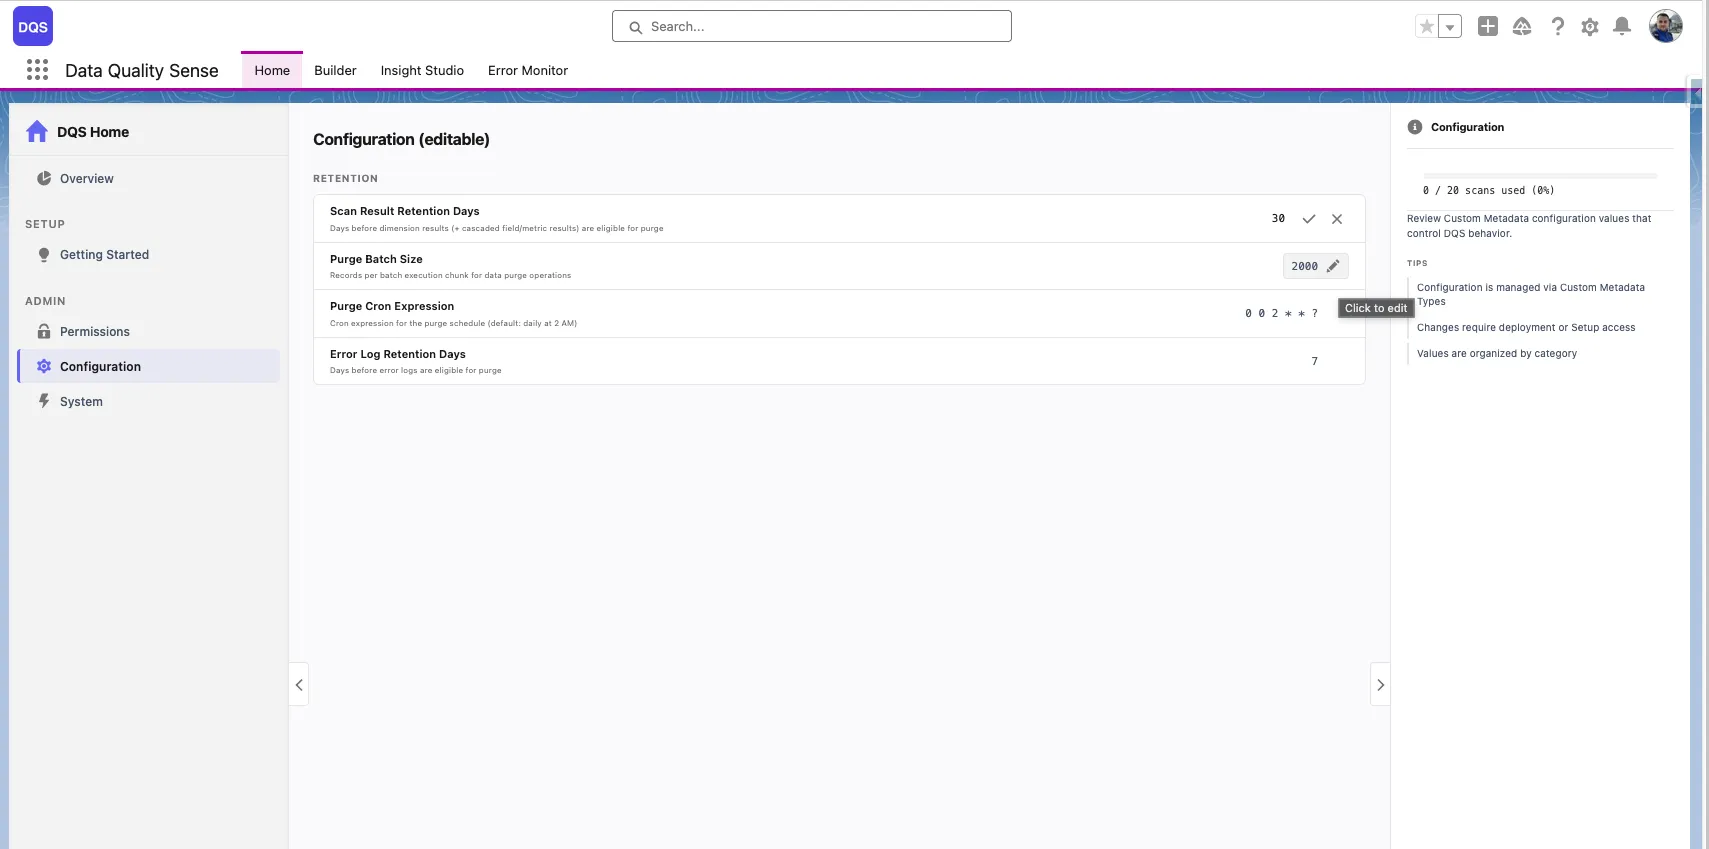
The Home page also includes a Configuration panel where administrators can edit default parameters such as Scan Result Retention Days, Purge Batch Size, Purge CRON Expression, and Error Log Retention Days directly from the UI.
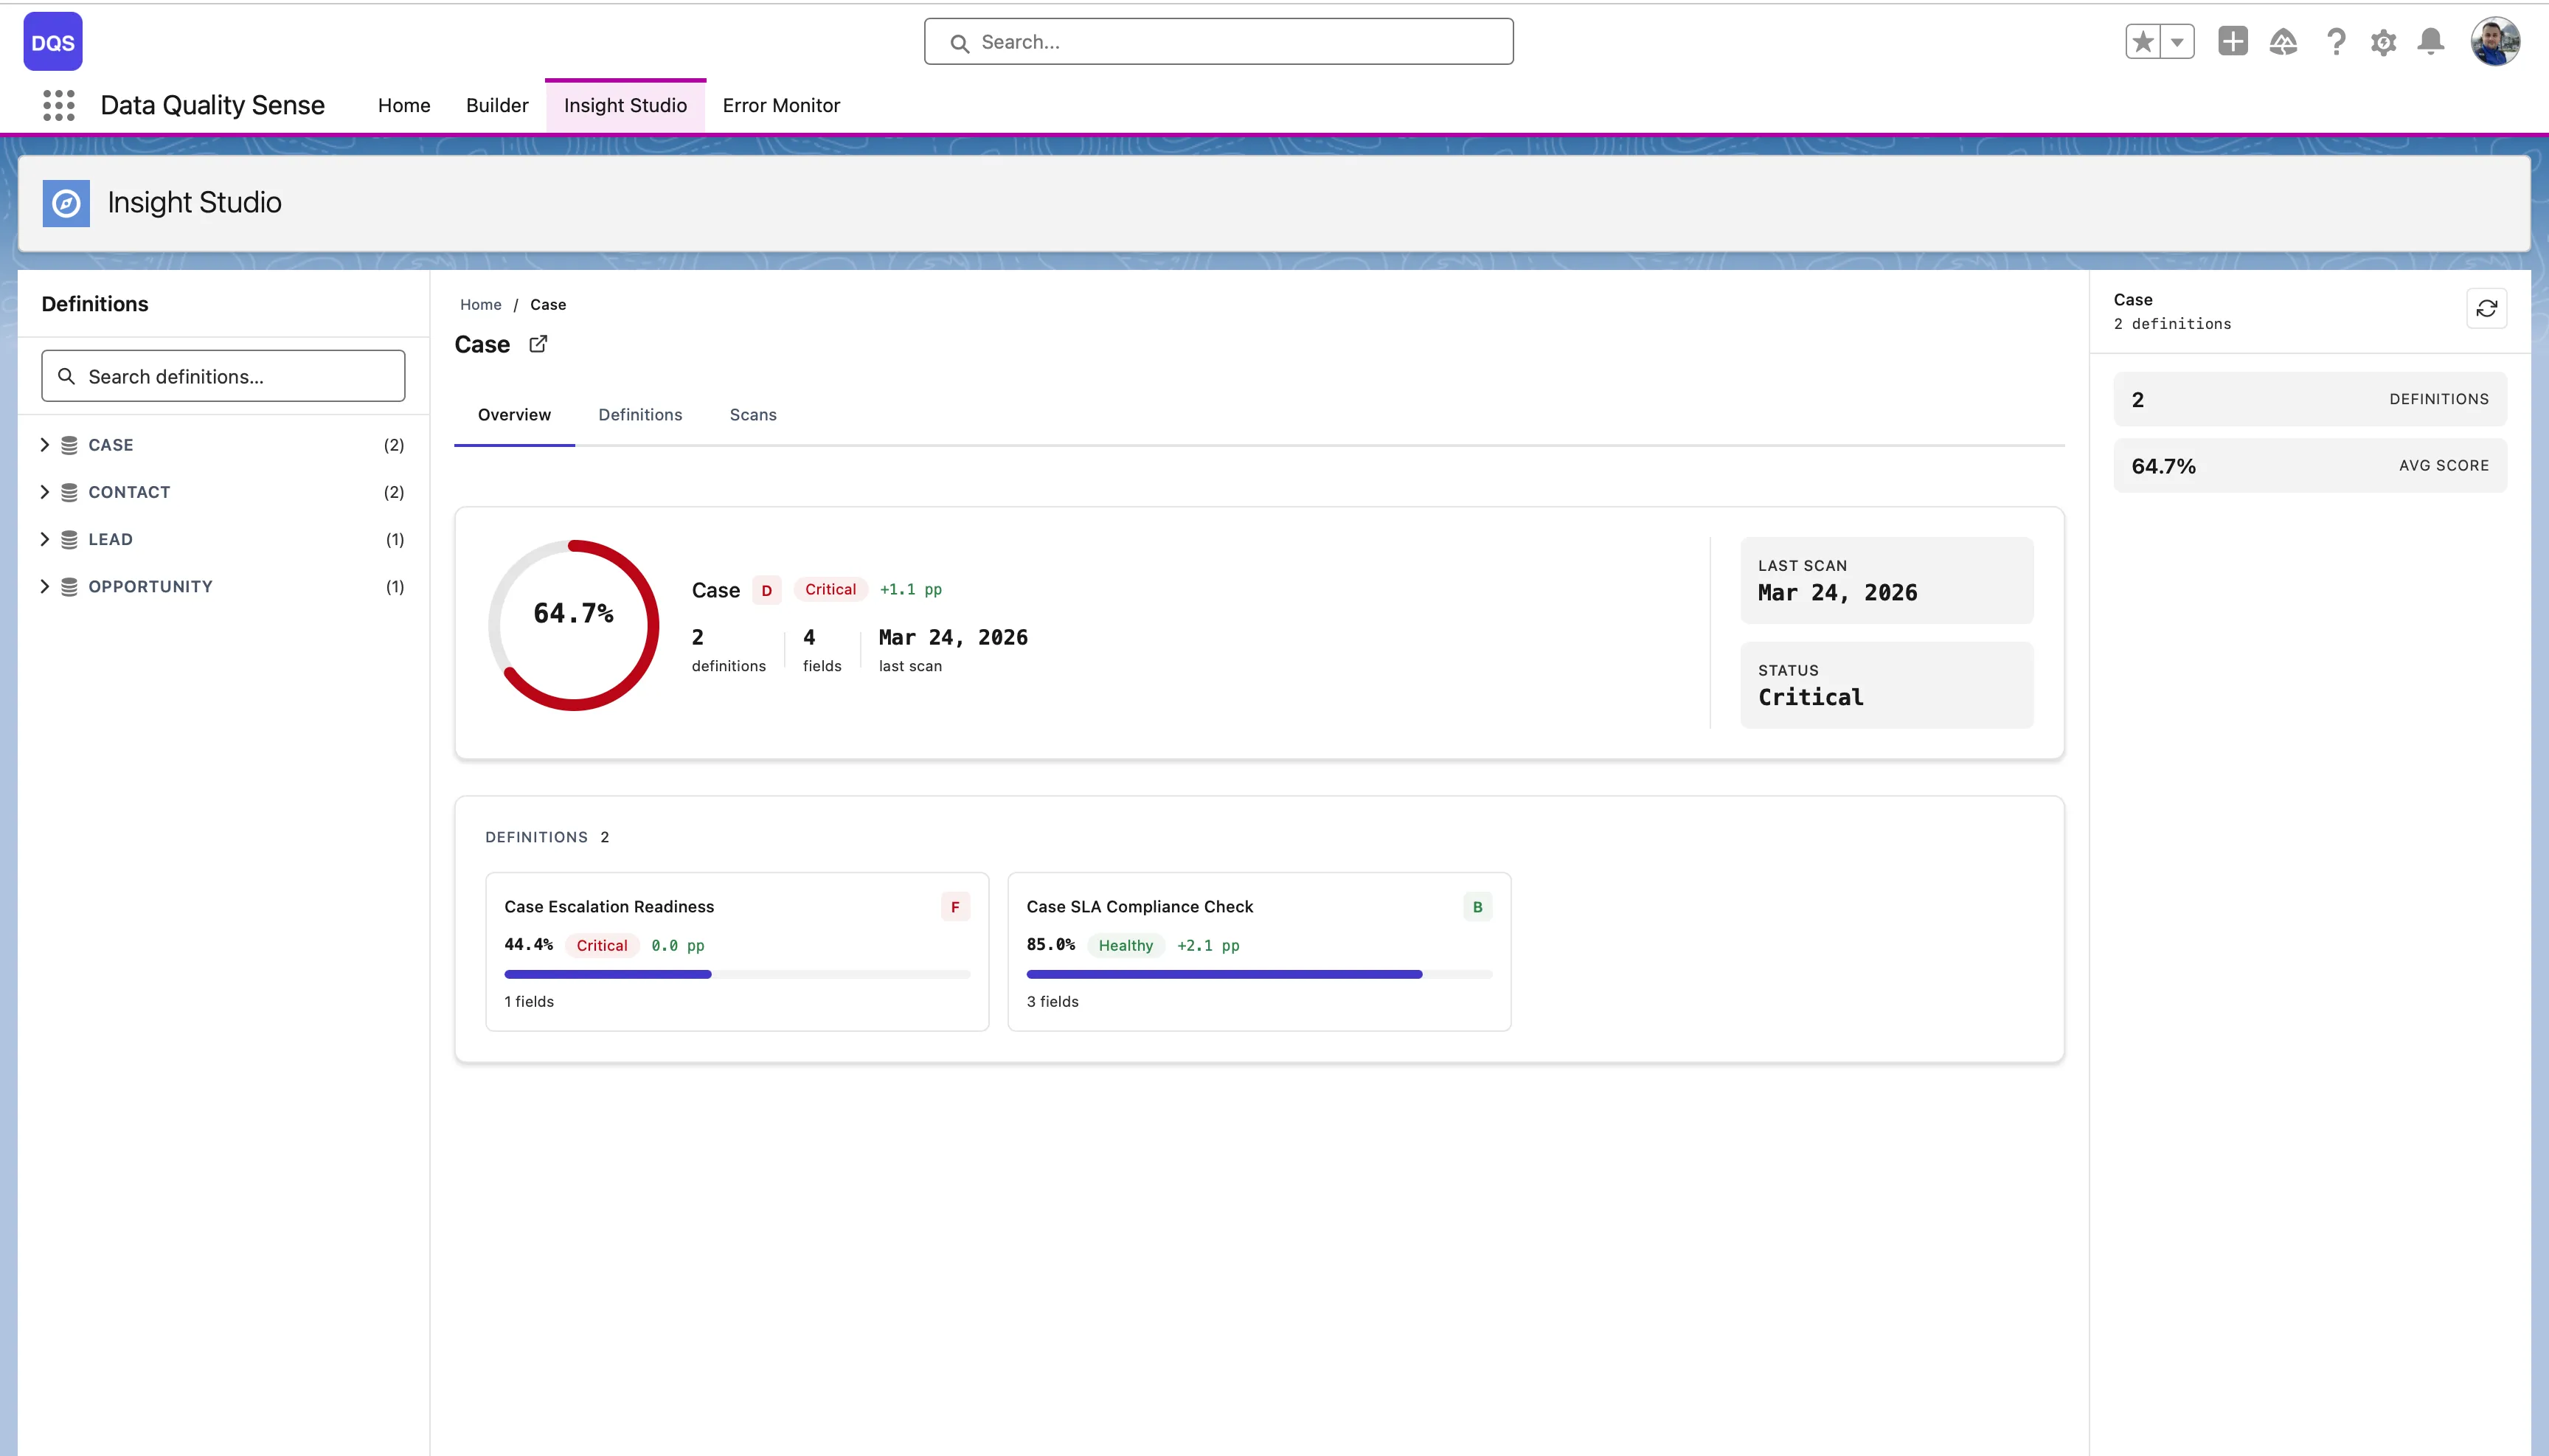
Level 2: Object
Section titled “Level 2: Object”Shows all definitions for a selected object with the overall quality score, last scan date, status, and definition cards. Compare different scan configurations and their results side by side.
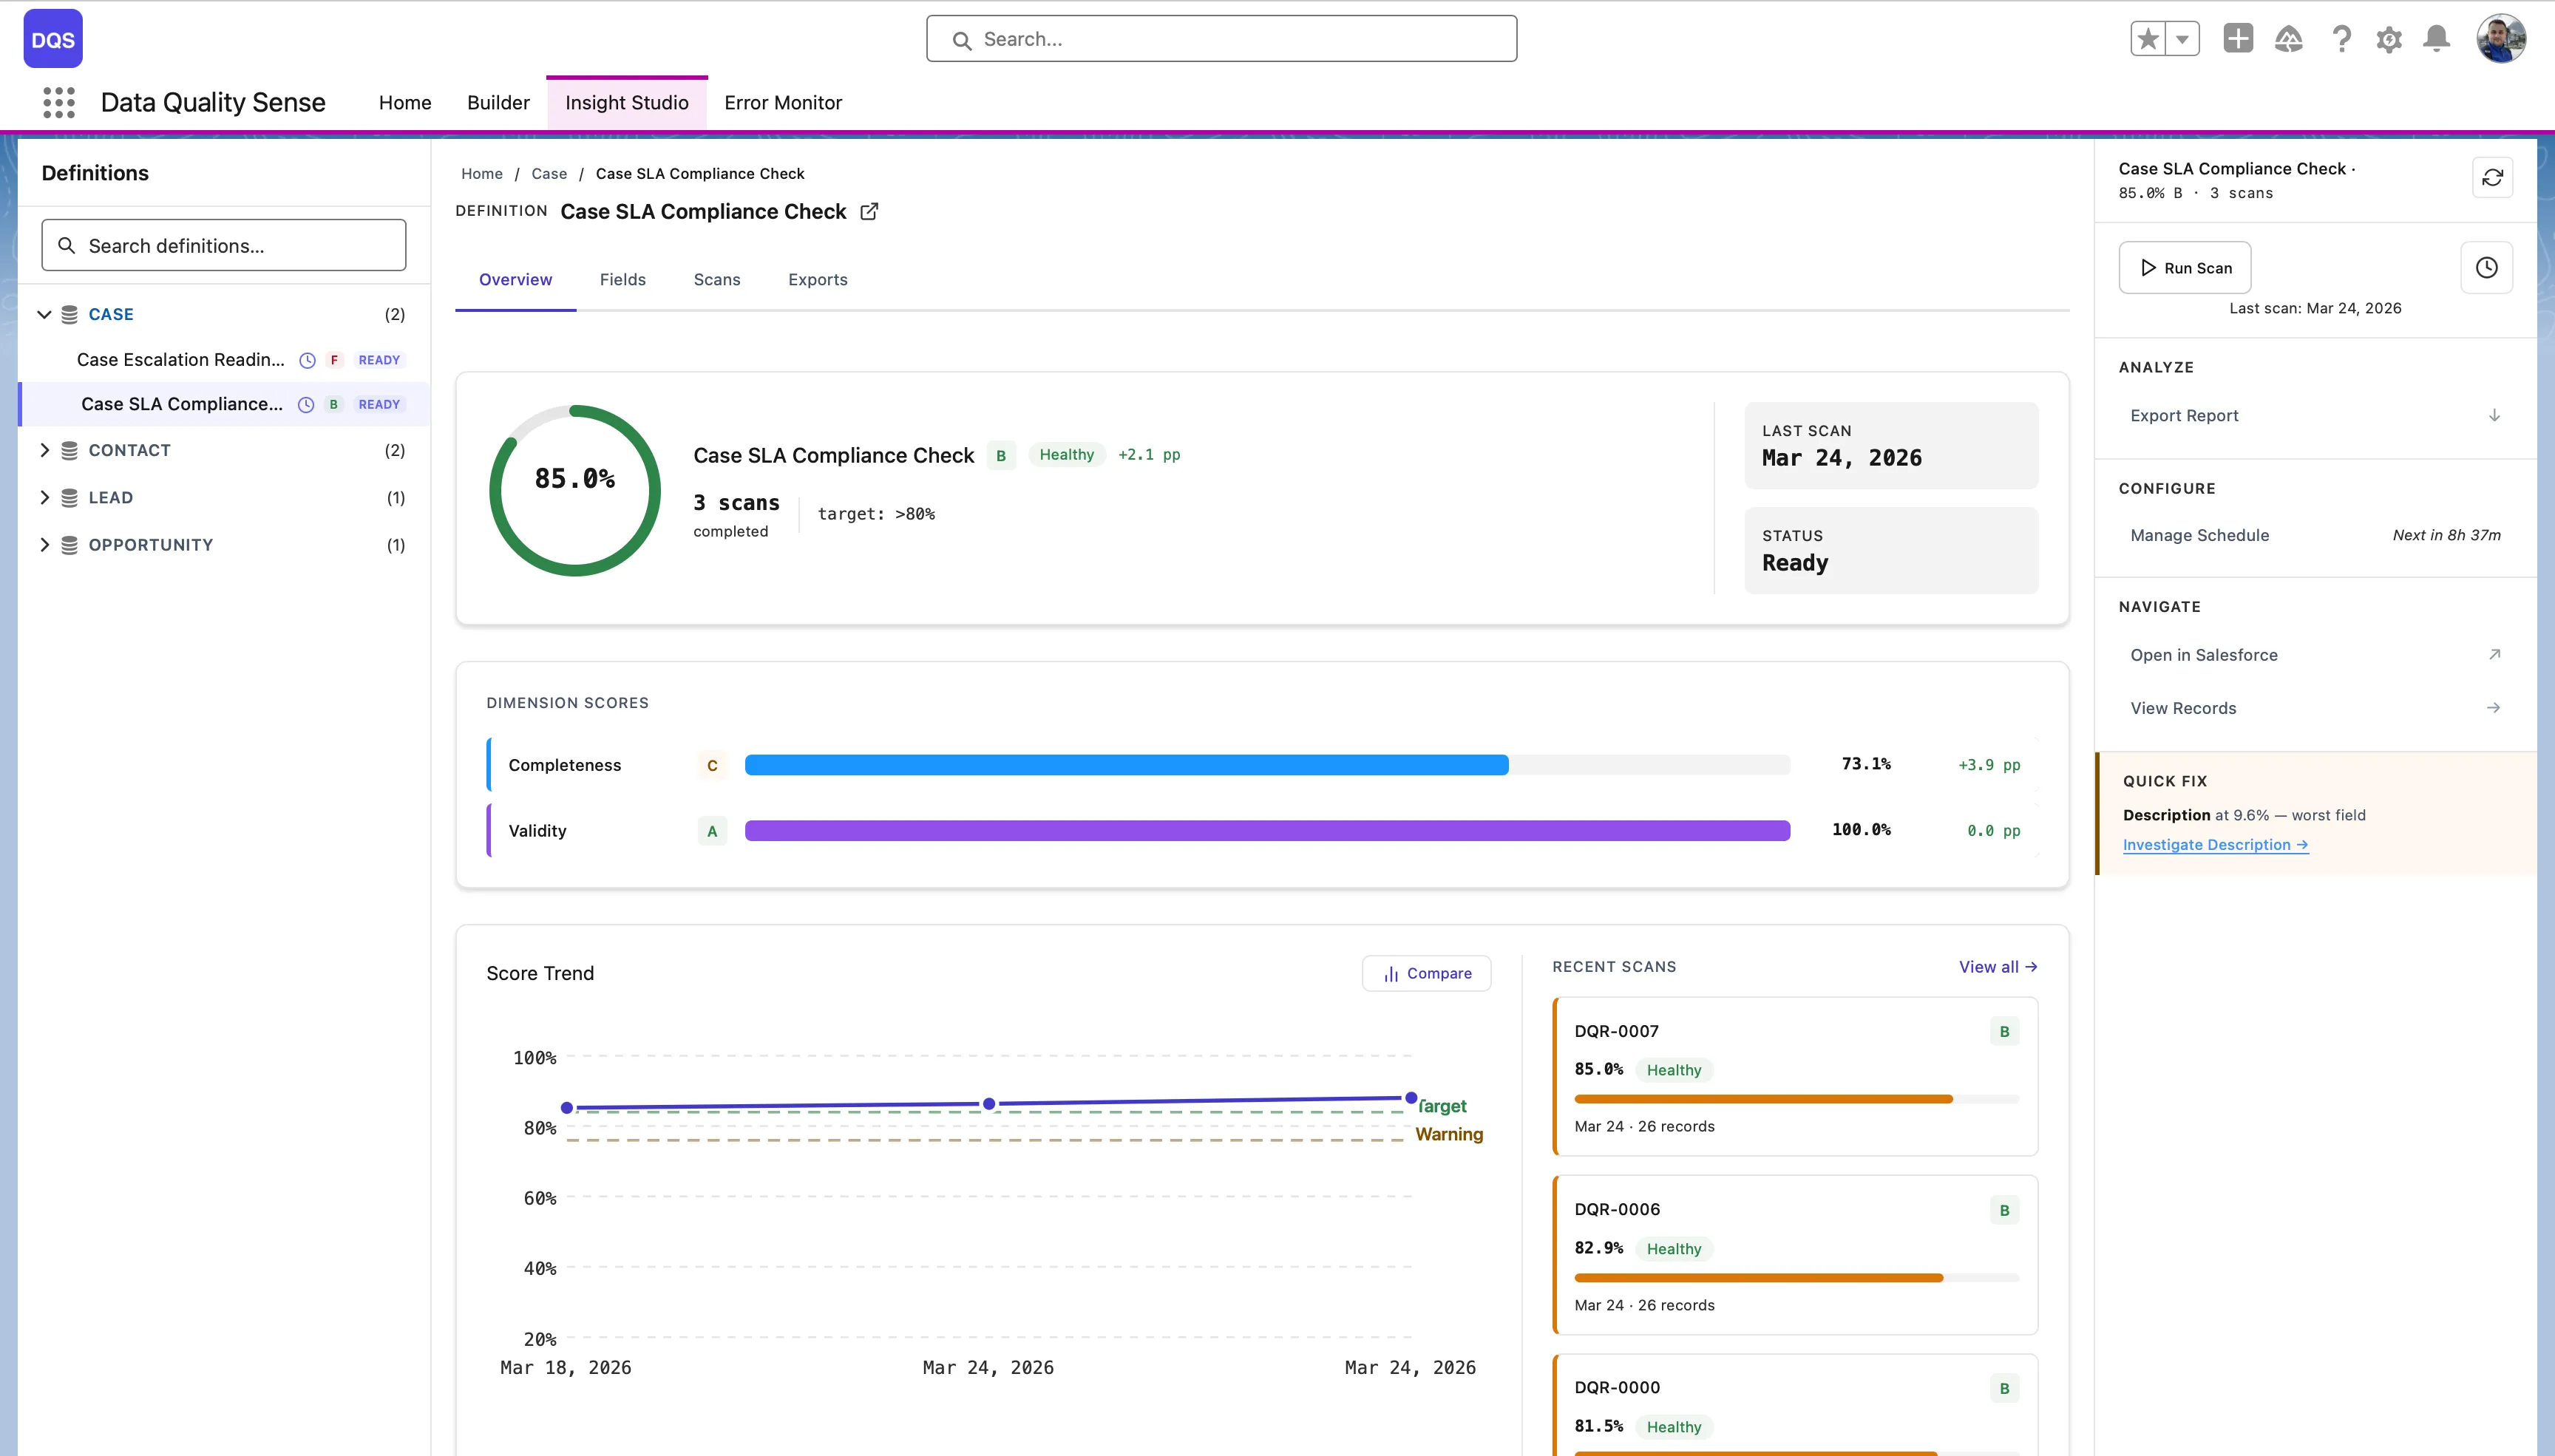
Level 3: Definition
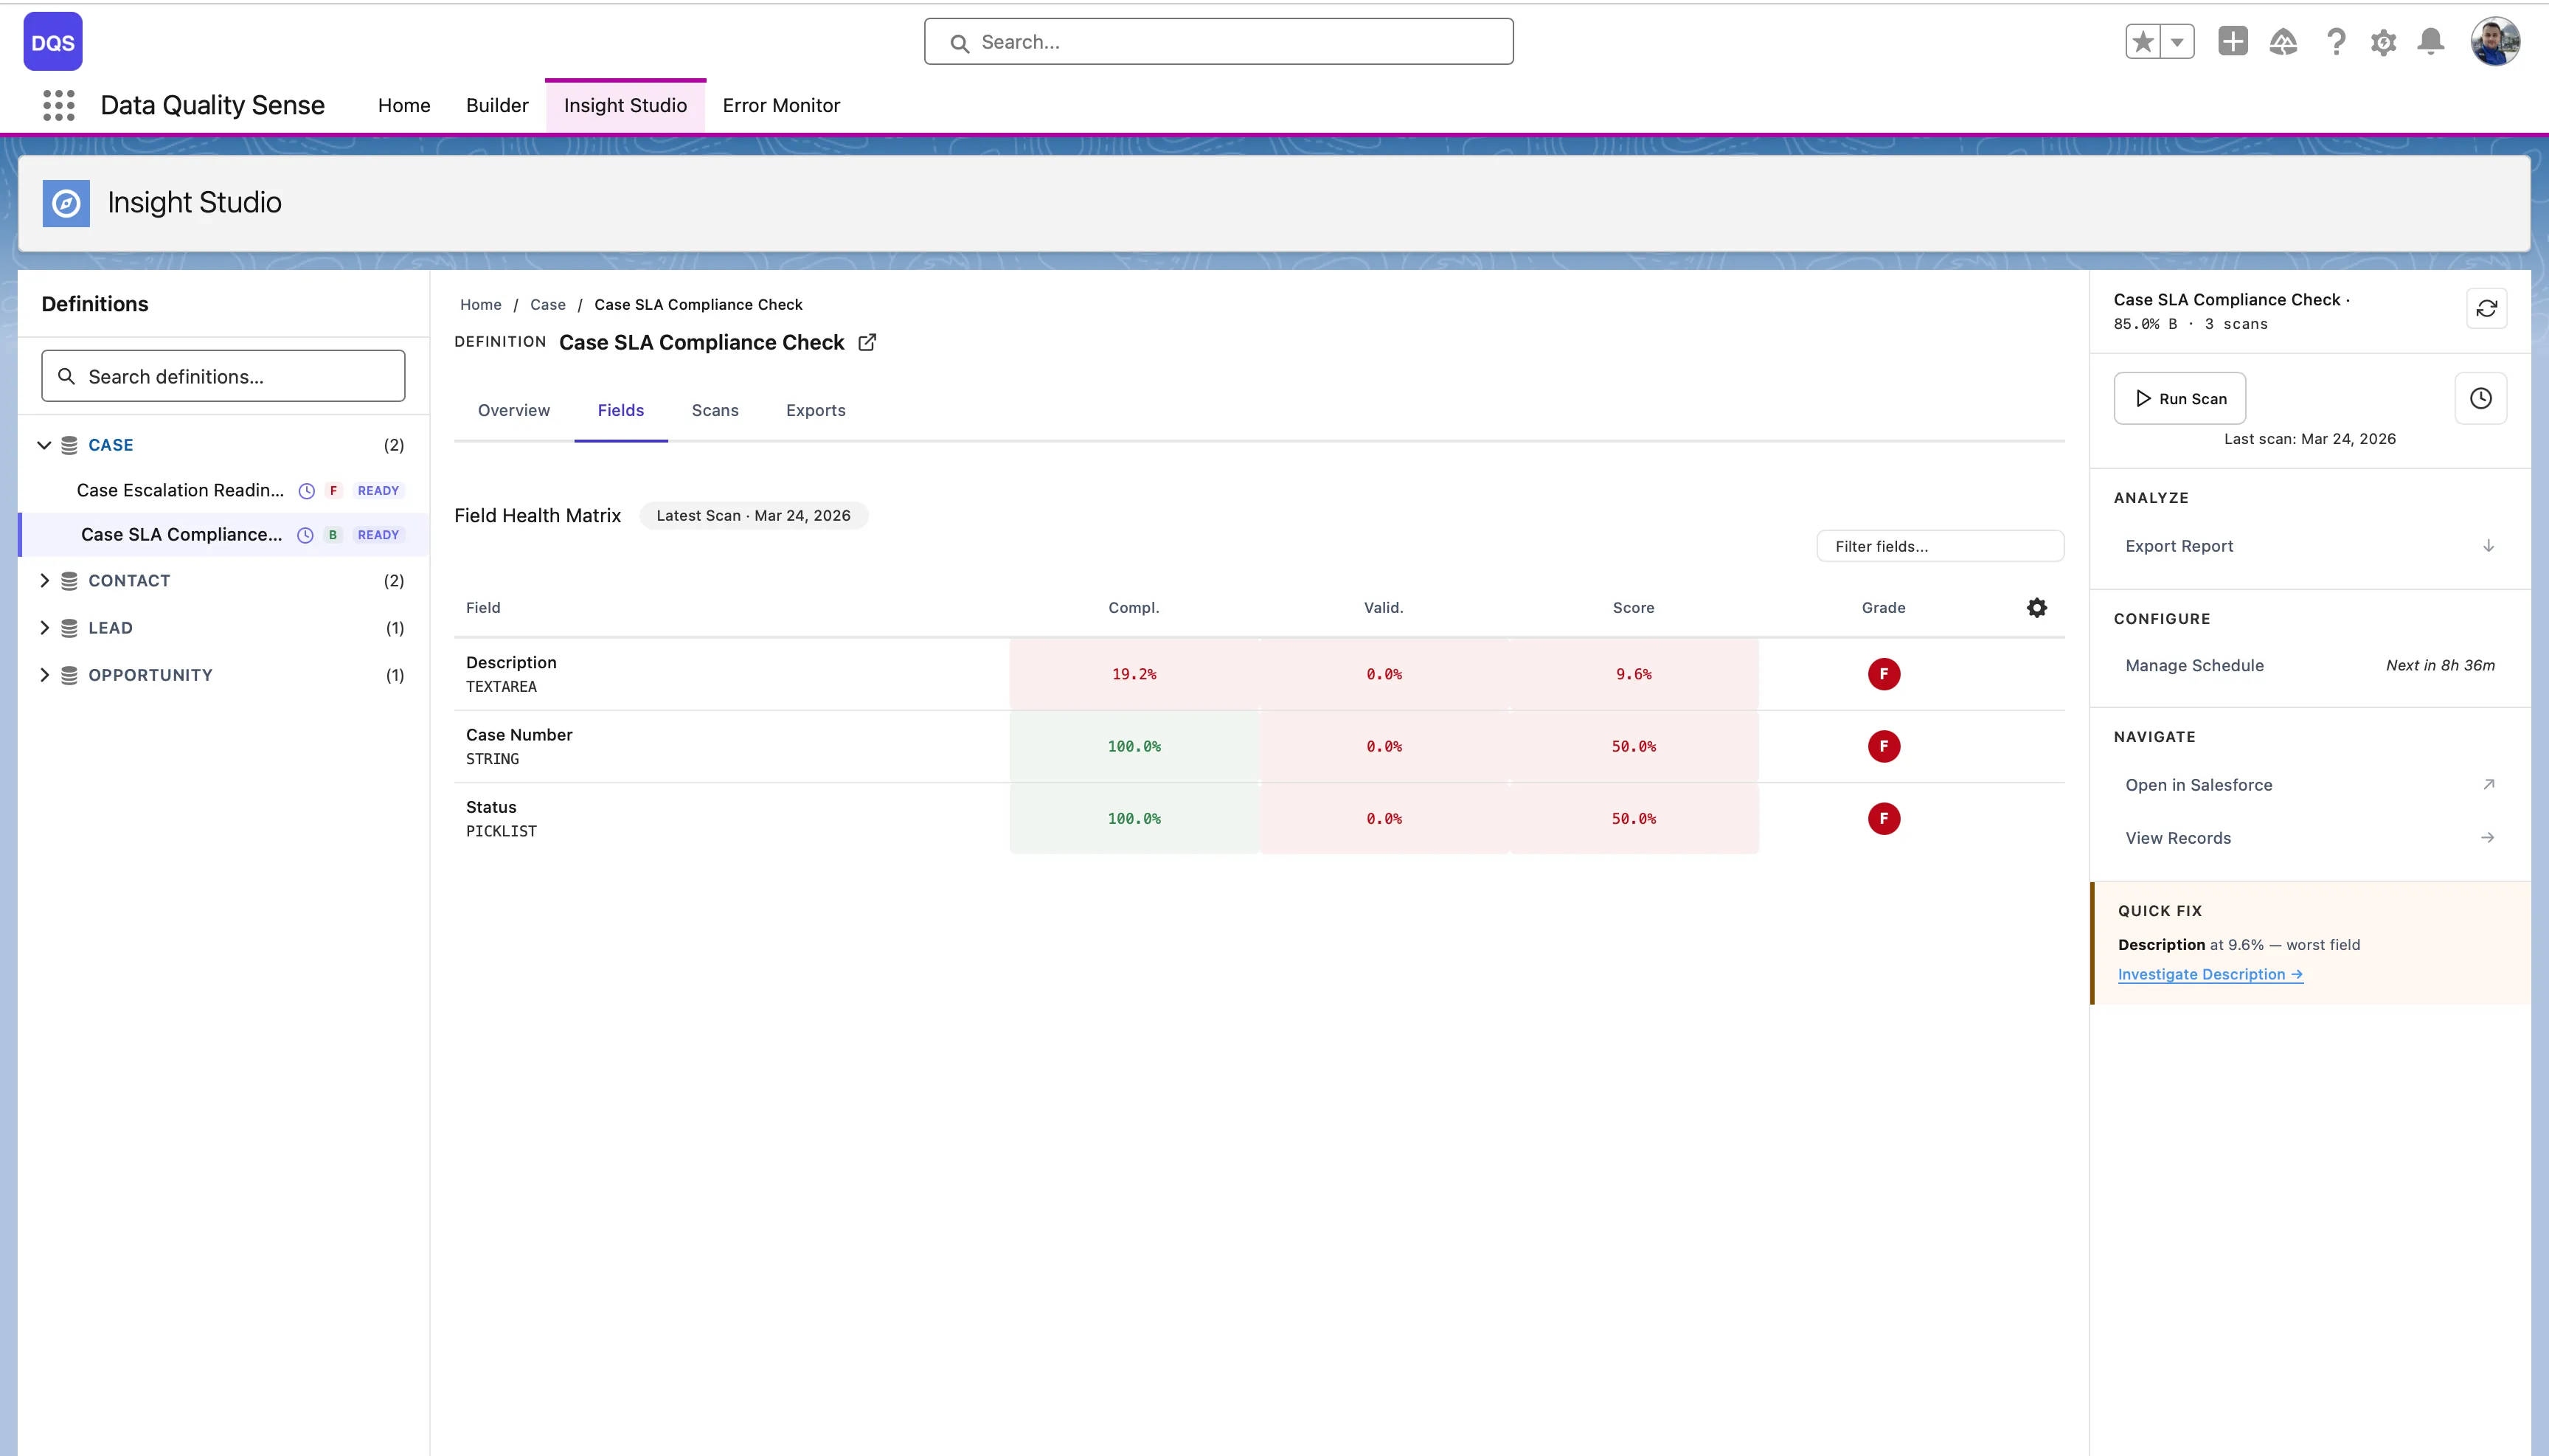
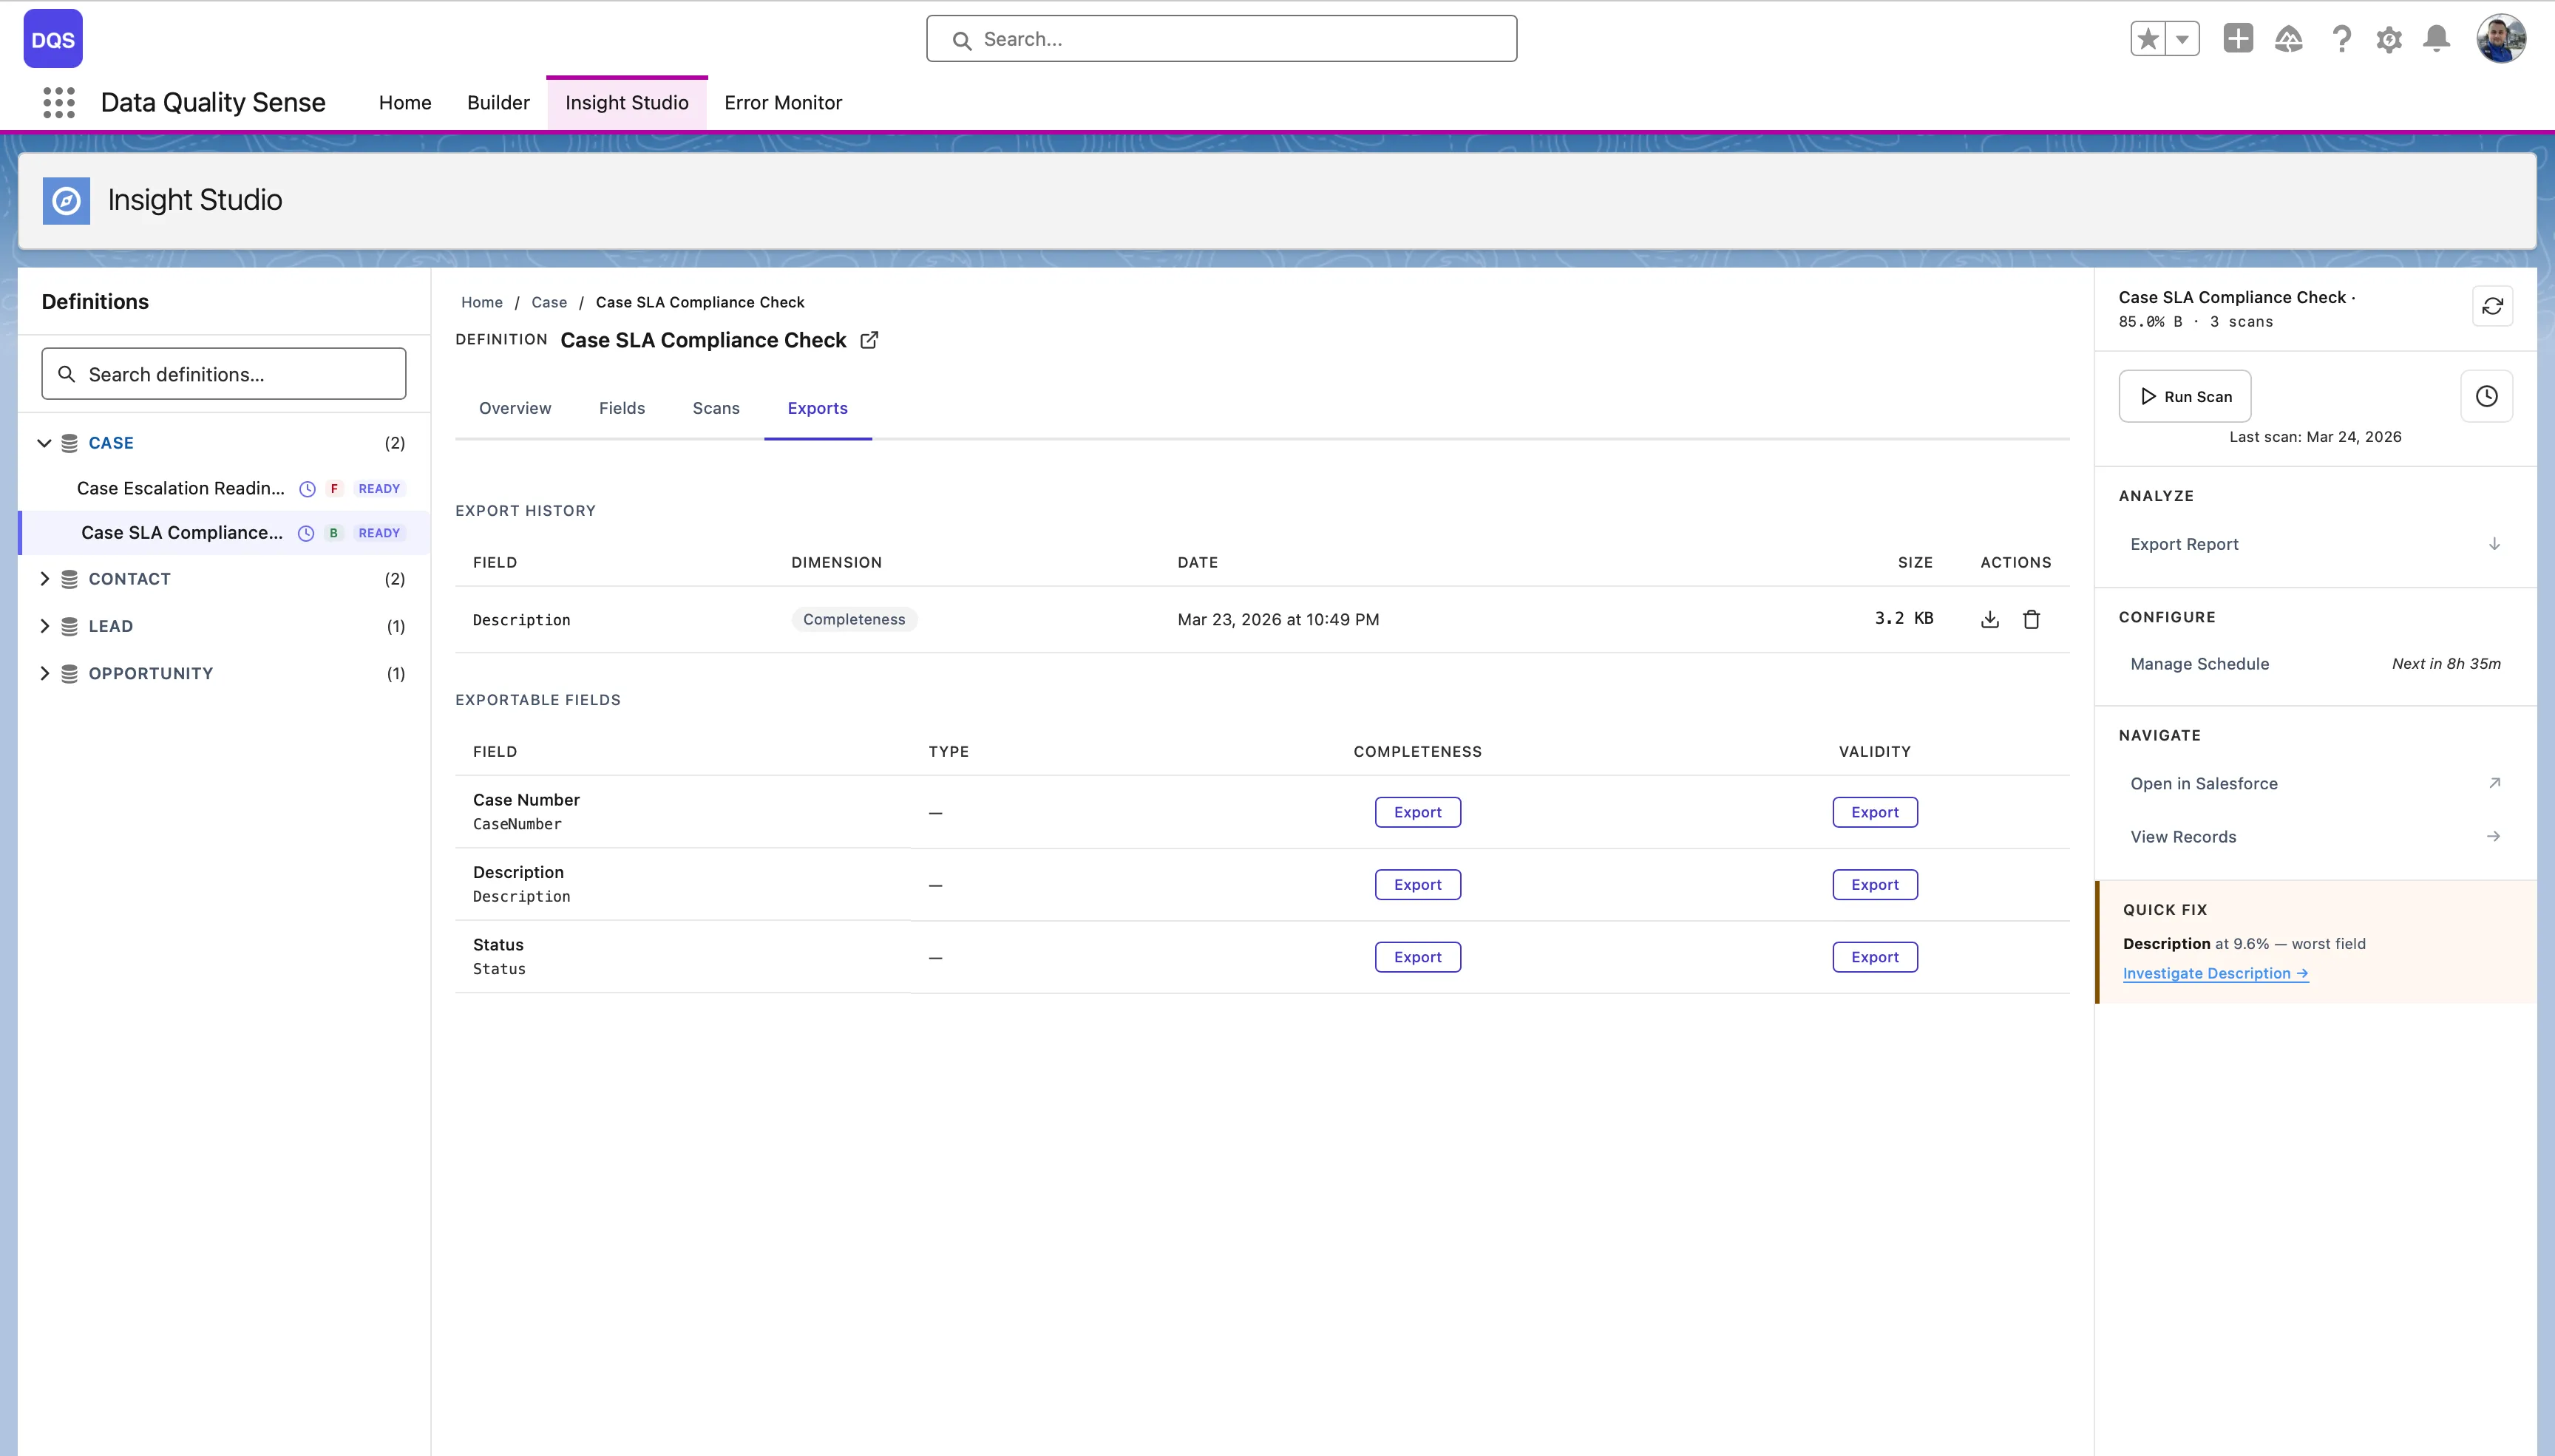
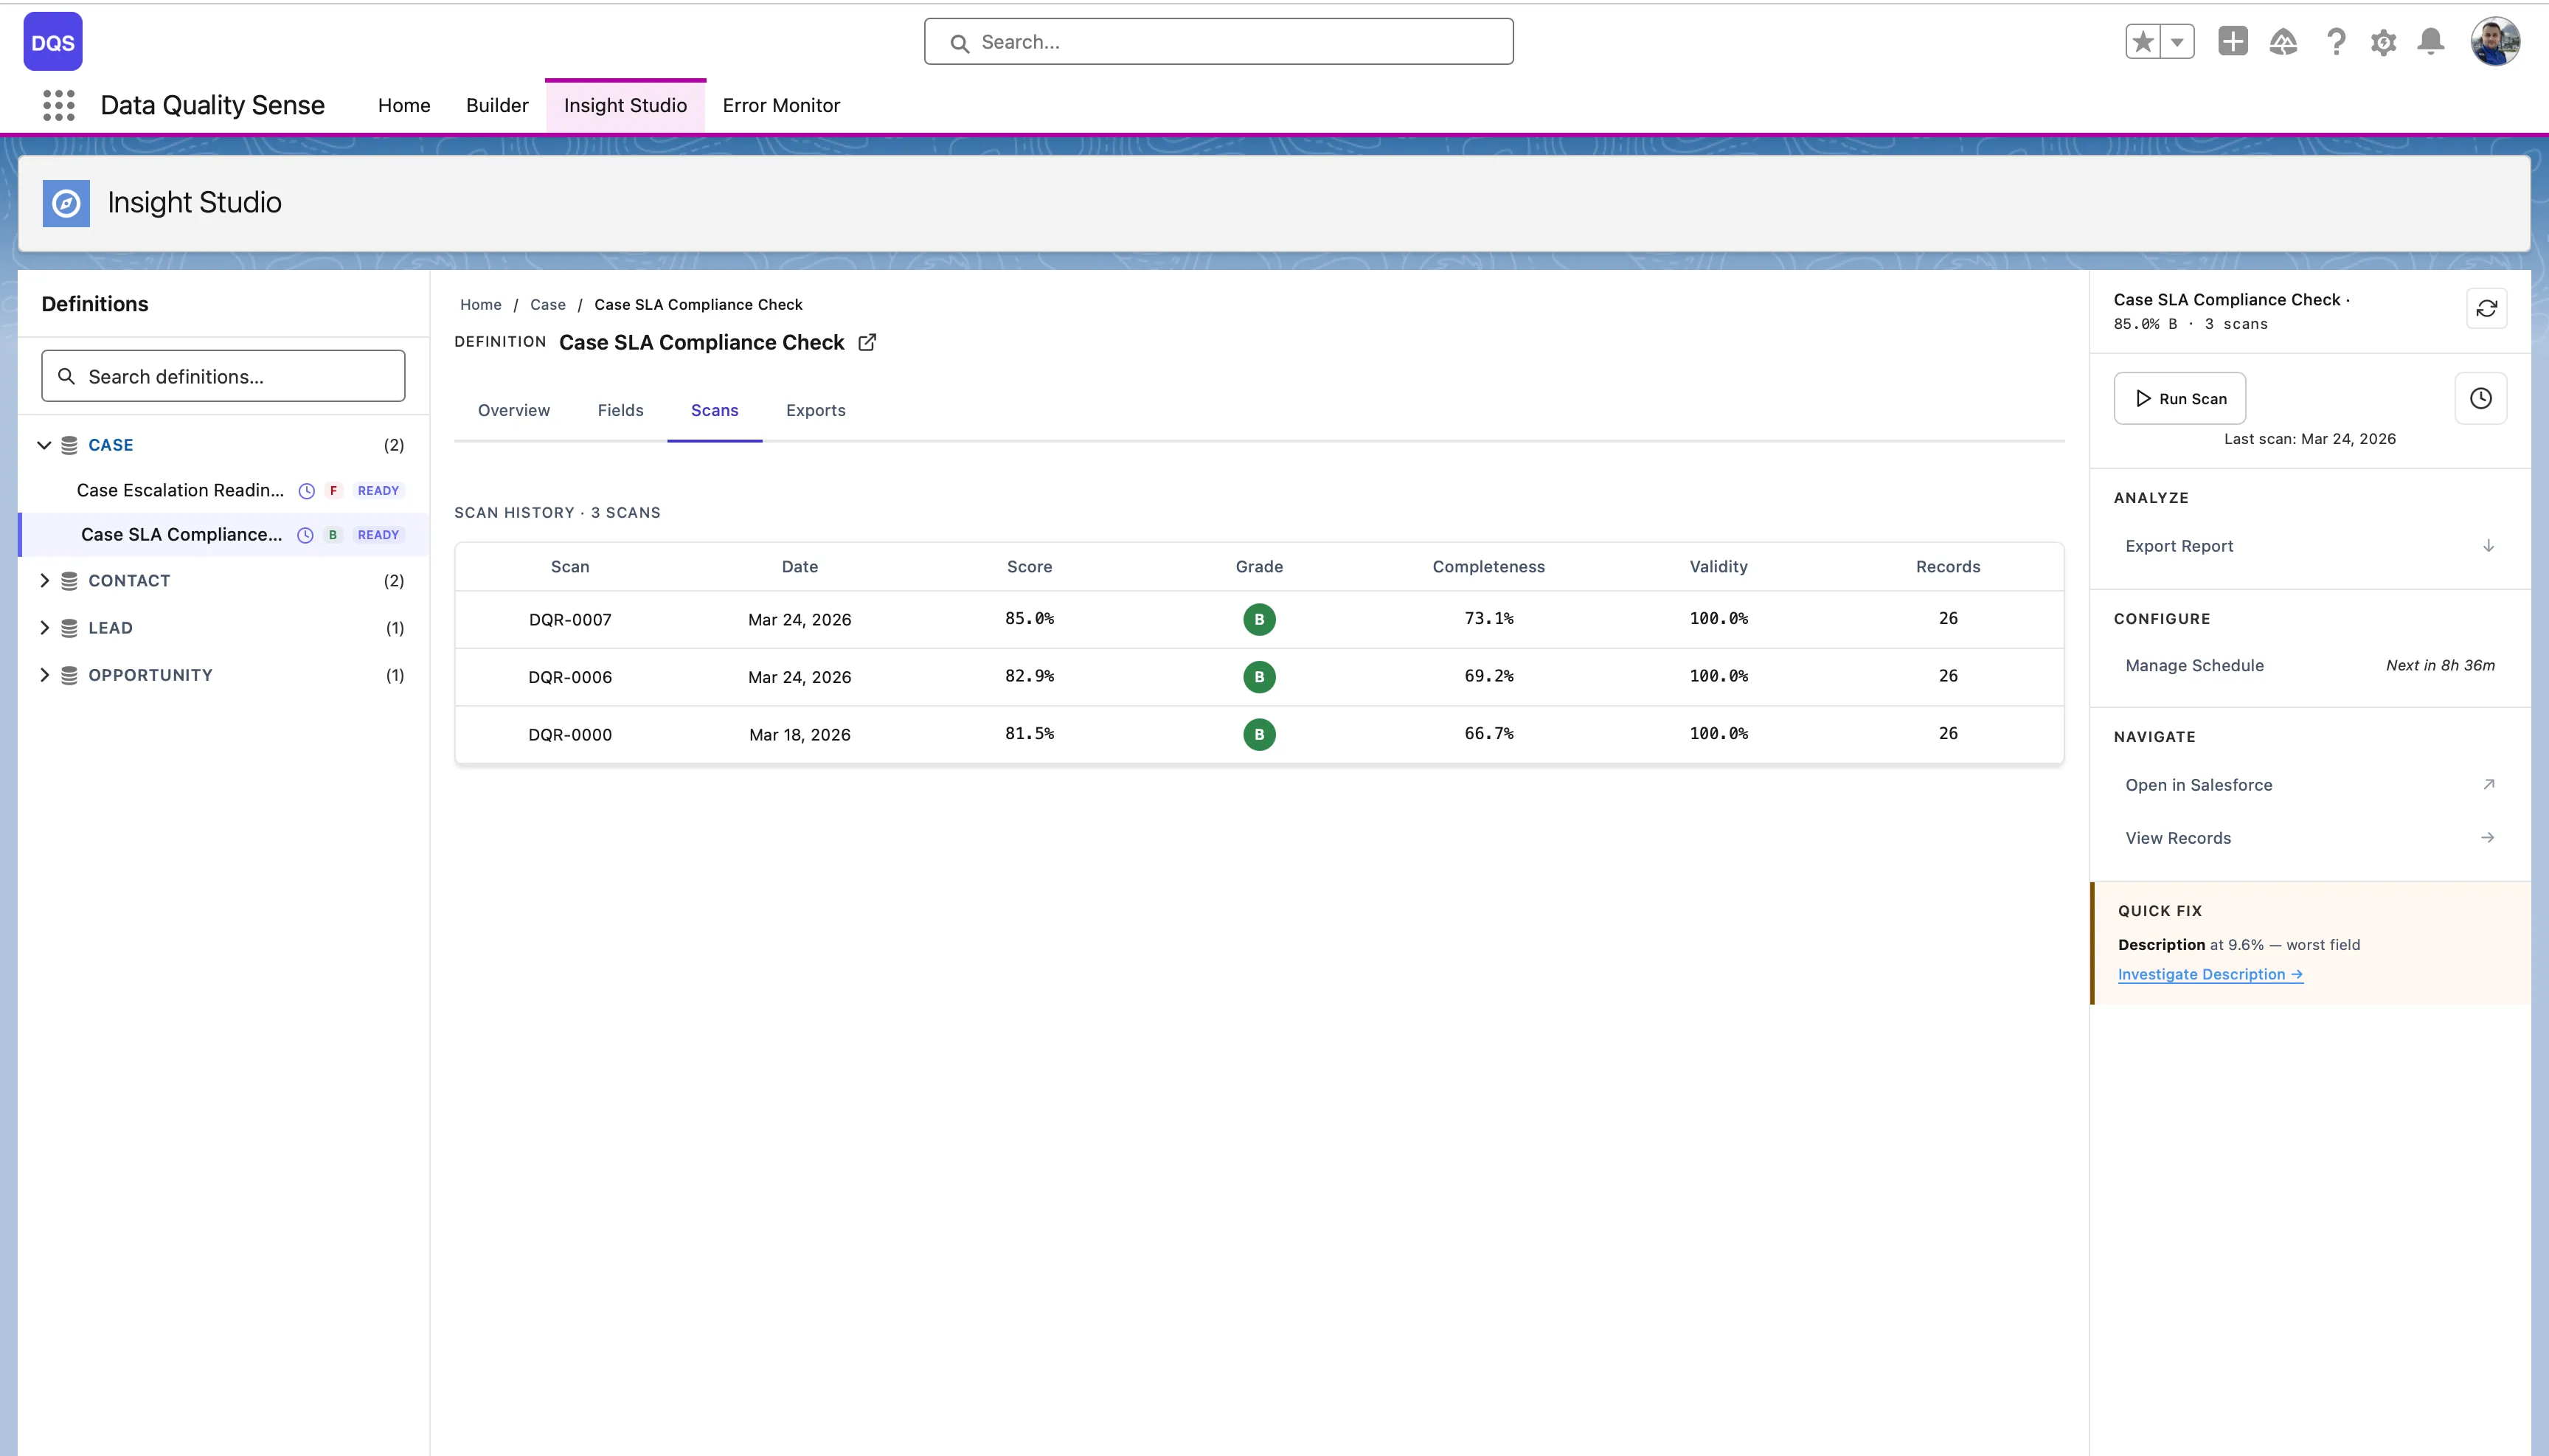
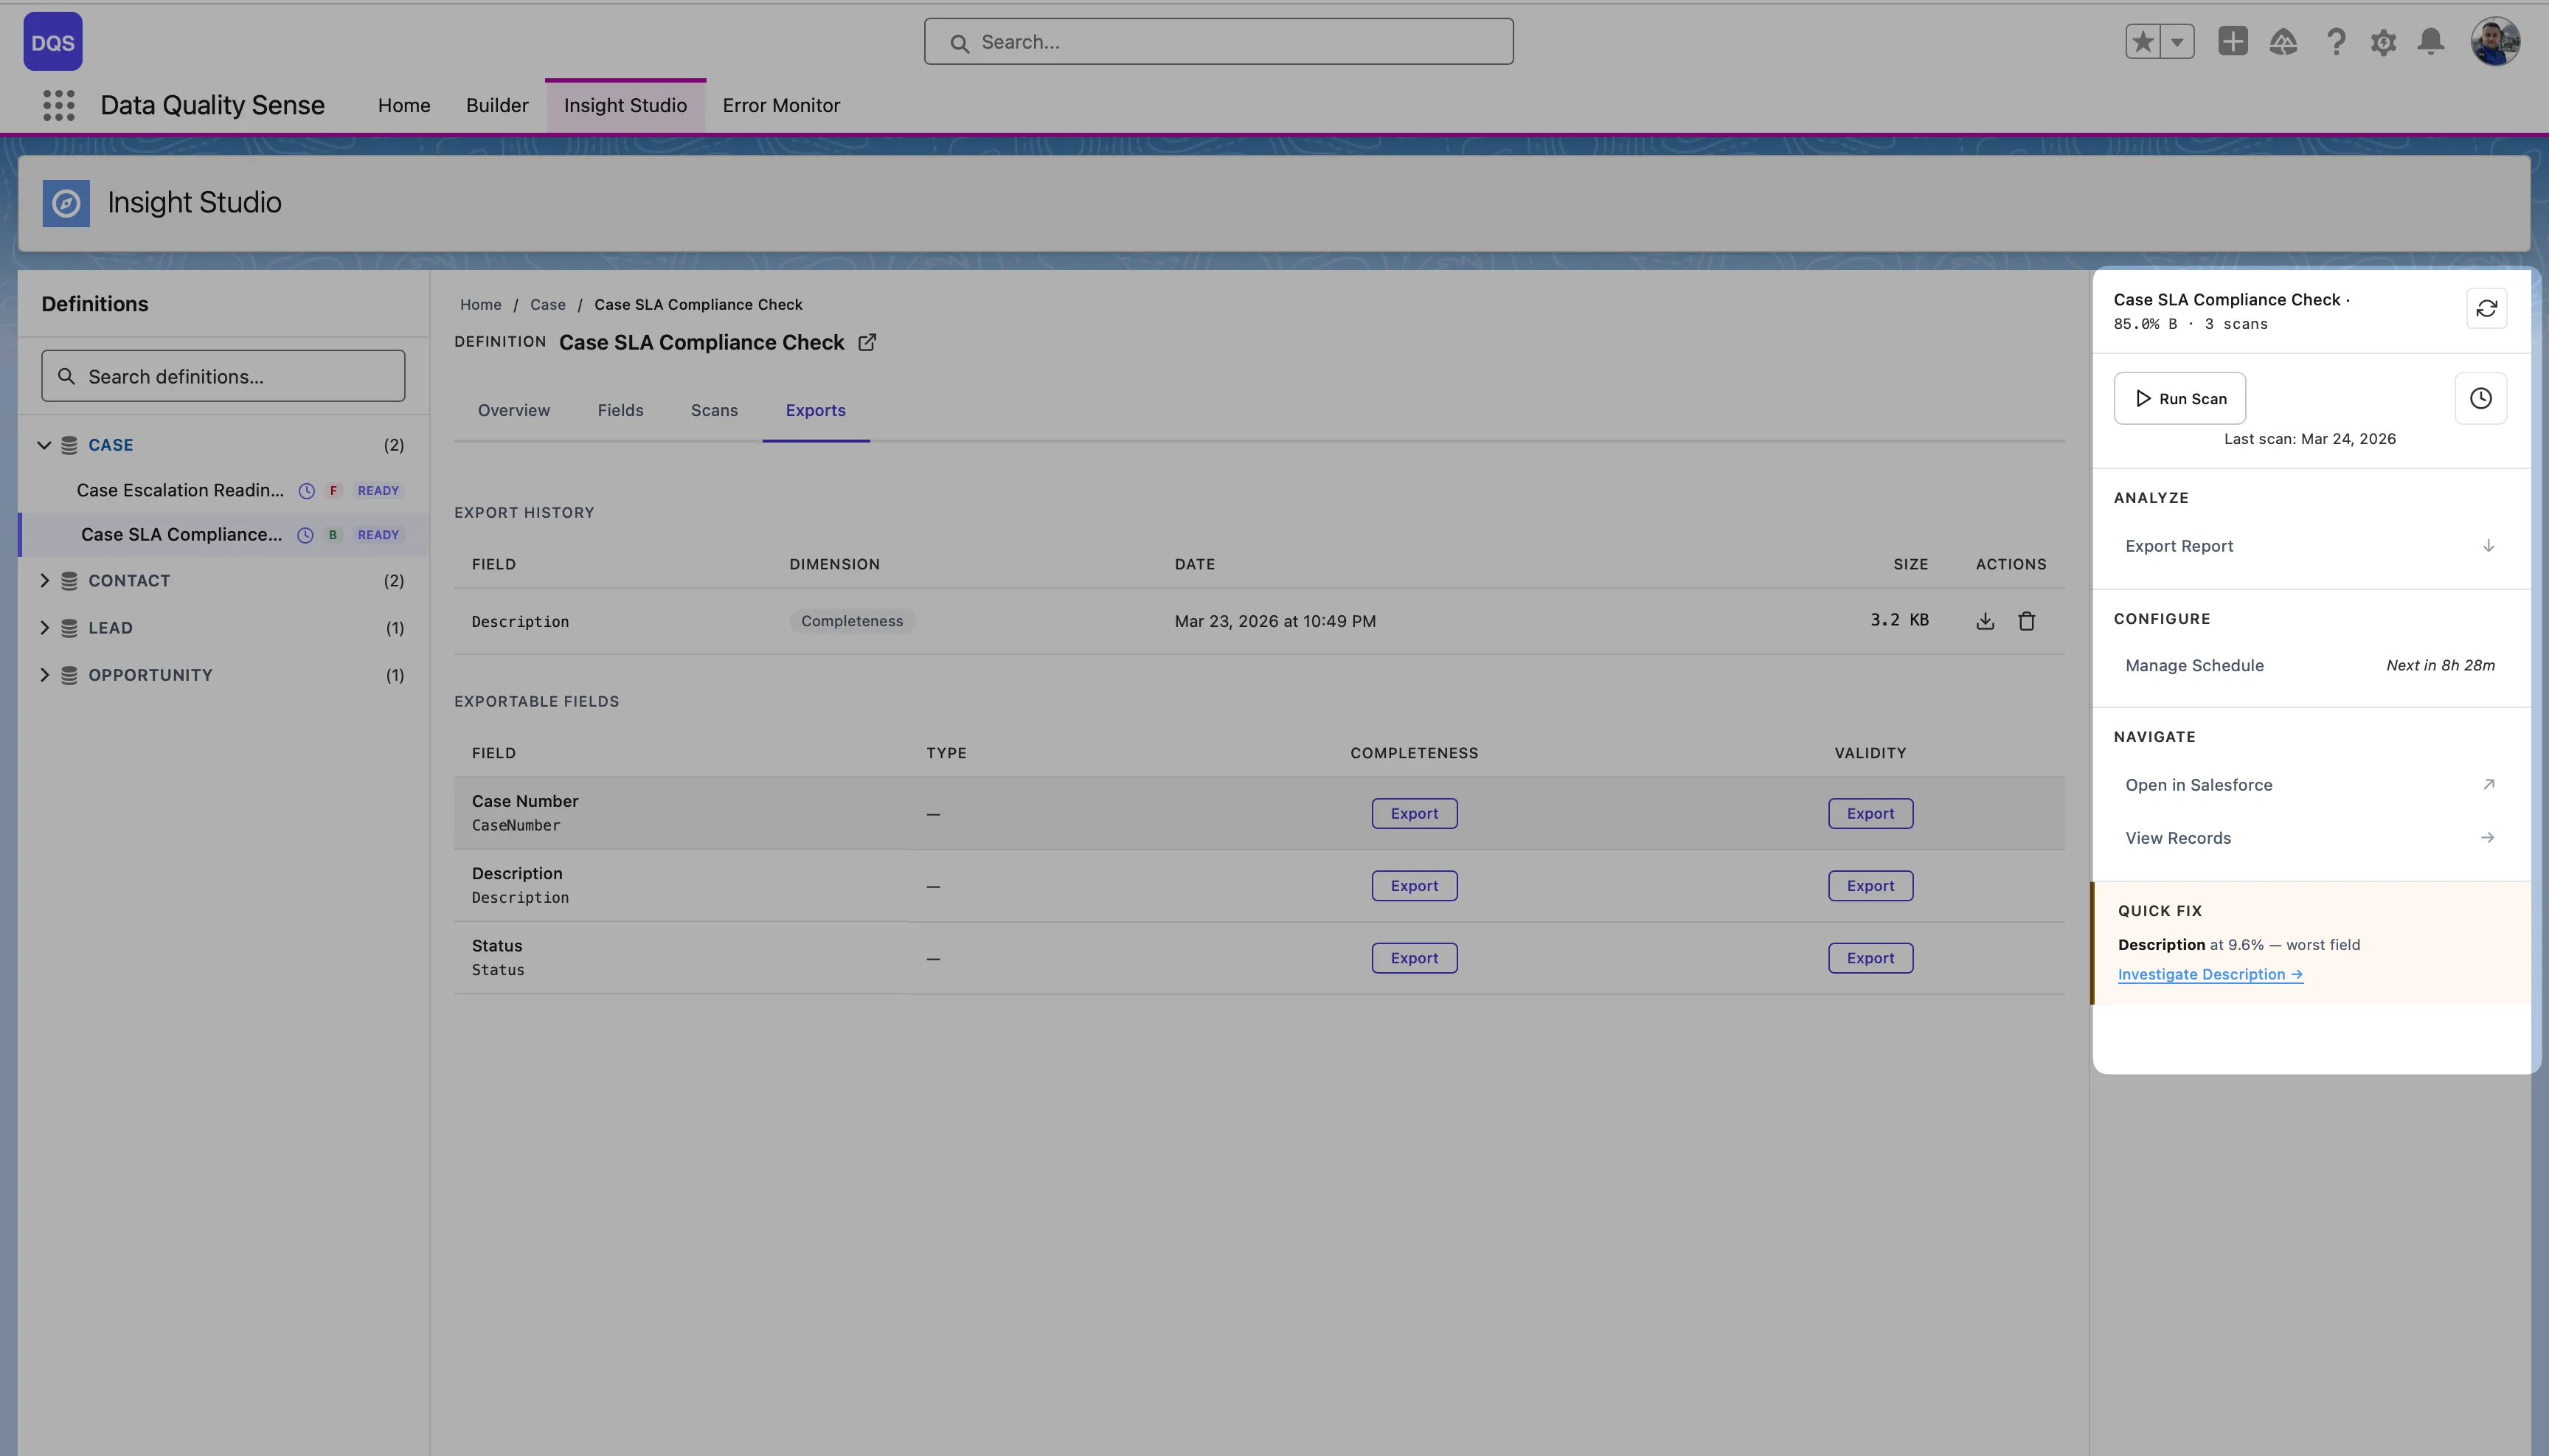
Section titled “Level 3: Definition”The main dashboard for a single definition. It has four tabs:
- Overview — Overall quality score, dimension score bars, Score Trend chart, and Record Scores panel
- Fields — Field Health Matrix with per-field scores across dimensions
- Scans — Full scan history with per-run results
- Exports — Download violation details as CSV per dimension and field, or take action via Create Tasks and Post Chatter
The Fields tab shows each field’s score per dimension in a color-coded matrix — red for poor, green for good. Use it to quickly spot the weakest fields.
The Exports tab lists available exports per dimension and field, with download buttons and export history.
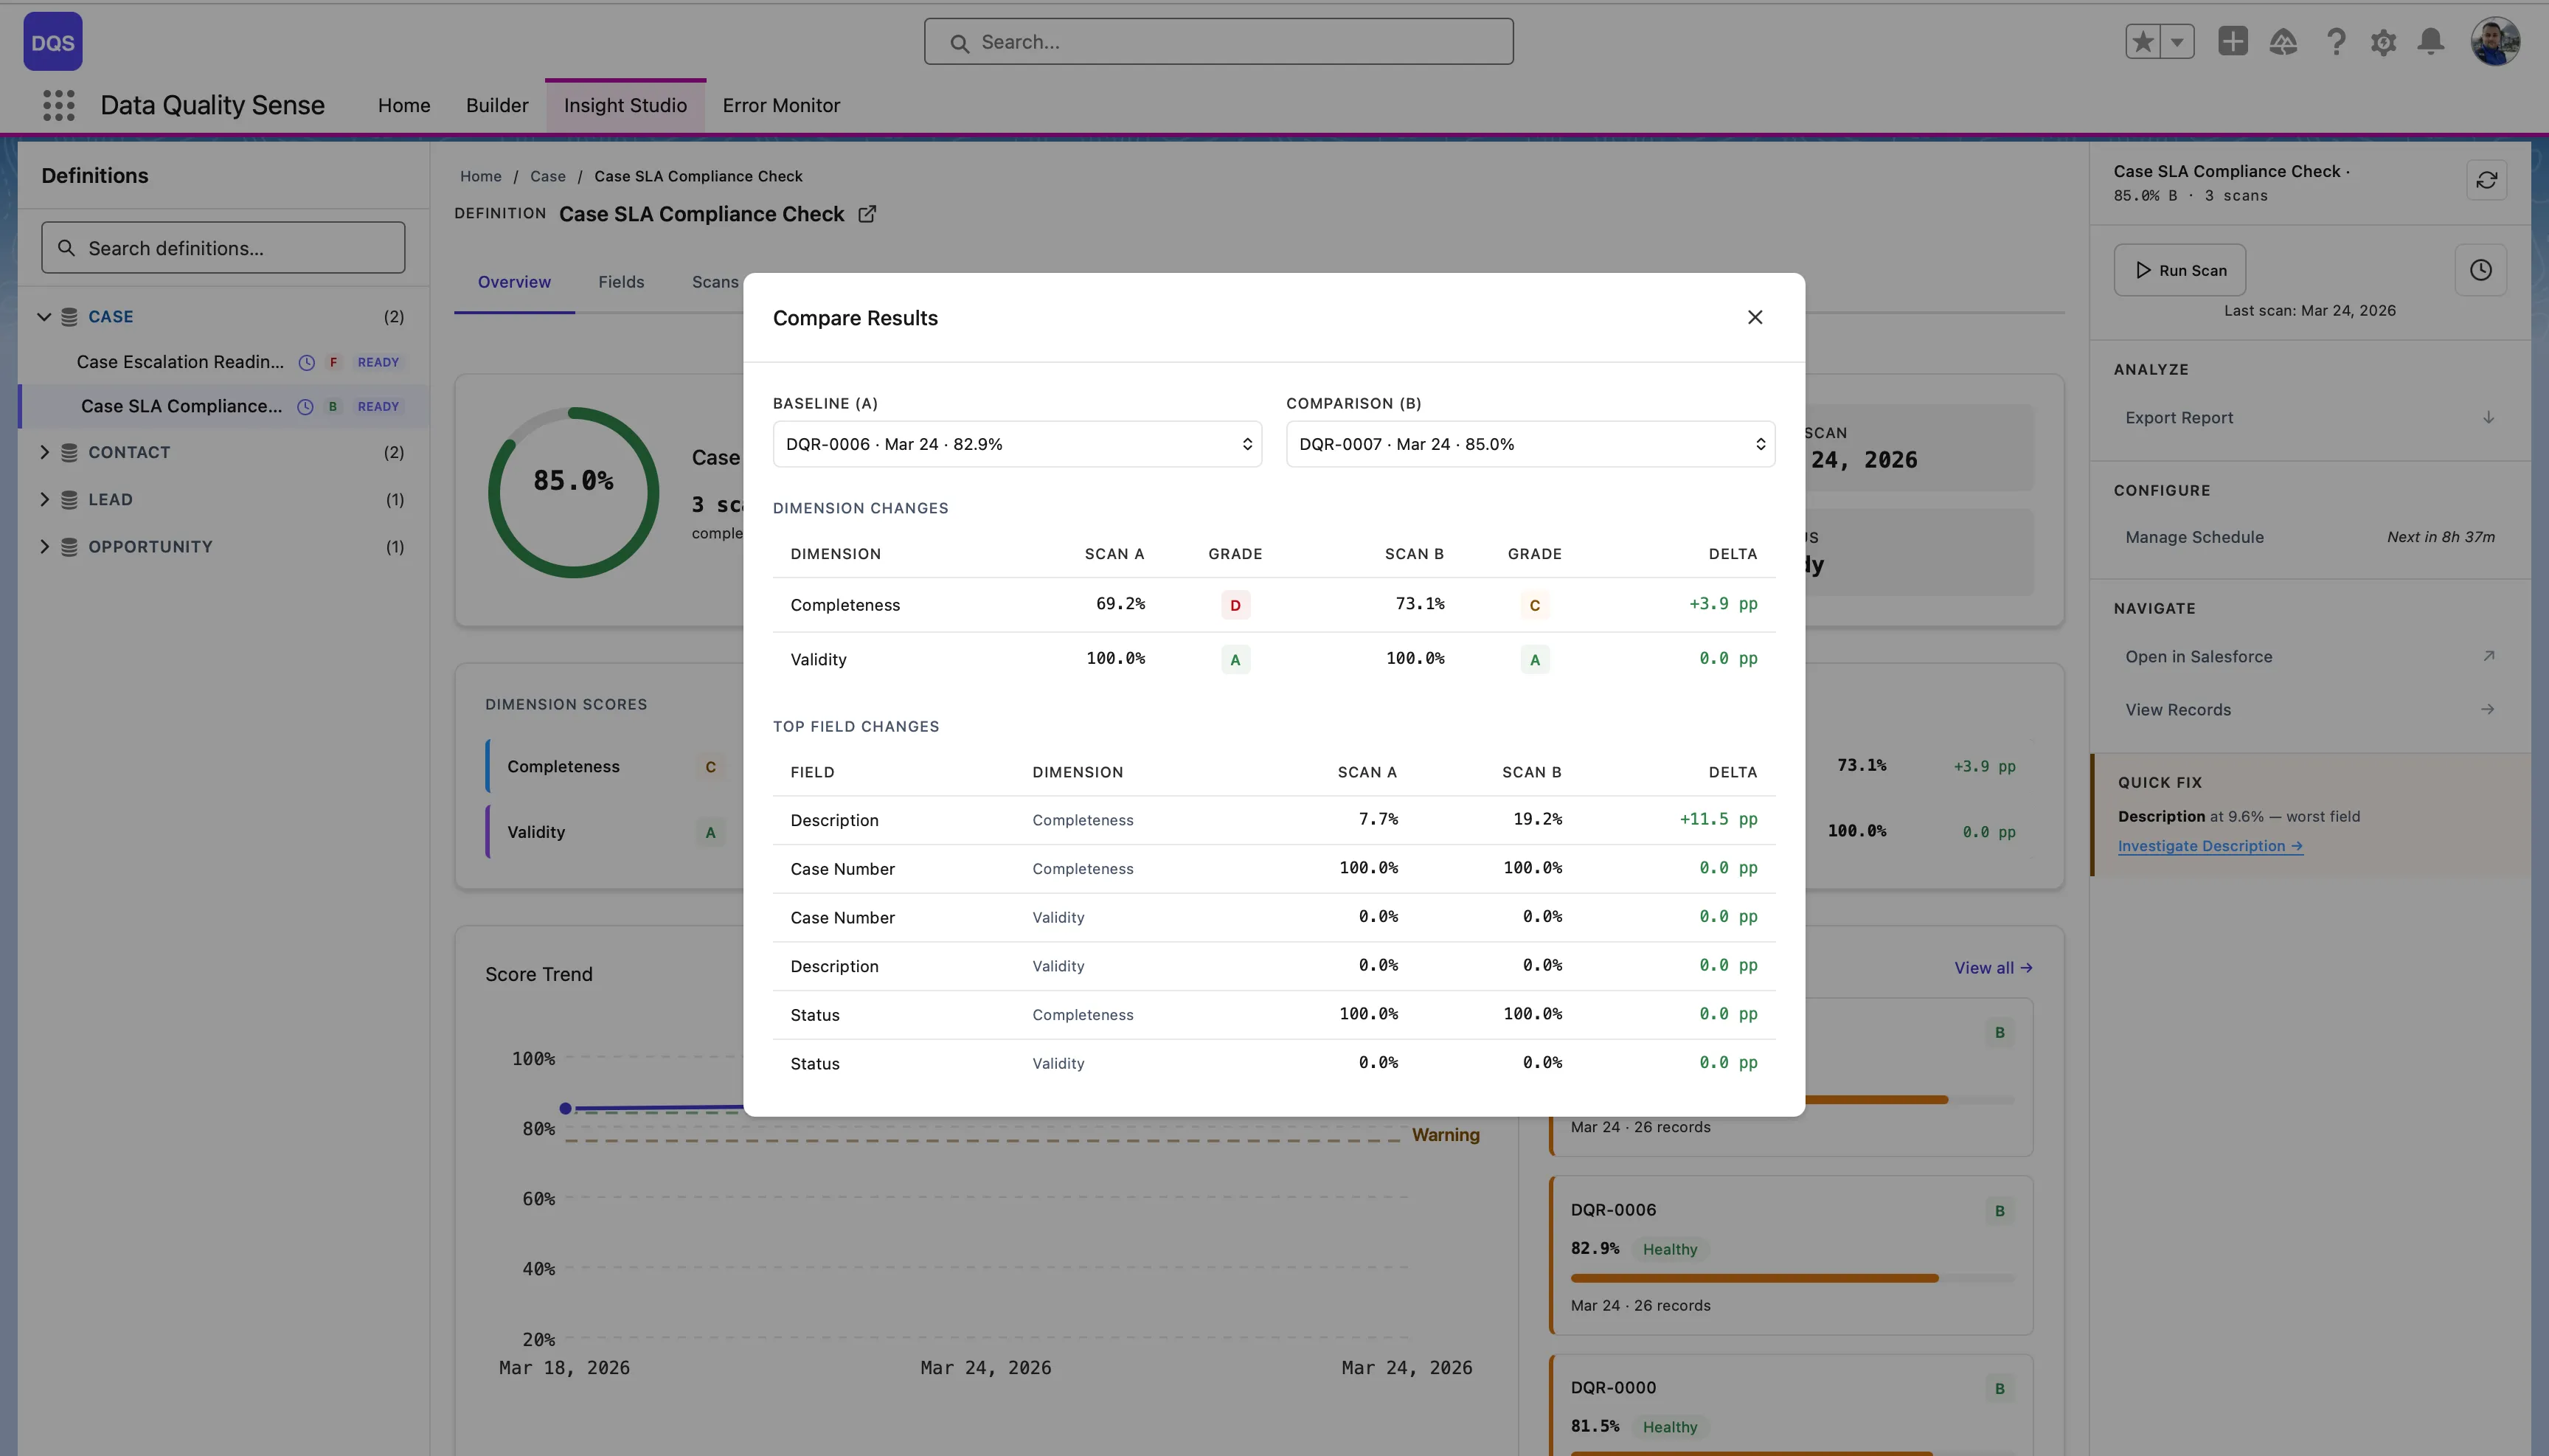
From the Overview tab, click Compare on the Score Trend chart to compare two scans side by side — see dimension-level and field-level deltas between a baseline and comparison scan.
Level 4: Scan
Section titled “Level 4: Scan”Detailed results for a specific scan execution. The Scans tab shows the full scan history with status indicators, scores, and per-dimension breakdowns for each run.
Level 5: Field
Section titled “Level 5: Field”Results for a single field across all dimensions. Useful for understanding why a specific field is scoring poorly.
Level 6: Dimension
Section titled “Level 6: Dimension”The deepest level — individual metric results for one field in one dimension. Shows the raw evaluation data.
Sidebar Panel
Section titled “Sidebar Panel”The right-hand sidebar shows context and actions for the current definition:
- Header — Definition name, overall score with grade, scan count, and a refresh button
- Run Scan — Trigger a scan manually, with last scan date displayed below
- Analyze — Actions dropdown menu with Export Report, Create Tasks, and Post Chatter (details)
- Configure — Manage Schedule with countdown to the next scheduled run (e.g., “Next in 8h 28m”)
- Navigate — Open in Salesforce (external link to the definition record) and View Records (browse scanned records)
- Quick Fix — Highlights the worst-performing field with its score (e.g., “Description at 9.6% — worst field”) and a direct Investigate link to drill into it
Breadcrumb Navigation
Section titled “Breadcrumb Navigation”A breadcrumb trail at the top of the stage area shows your current position in the hierarchy. Click any breadcrumb segment to navigate back to that level.
