Field Health
Field Health Matrix
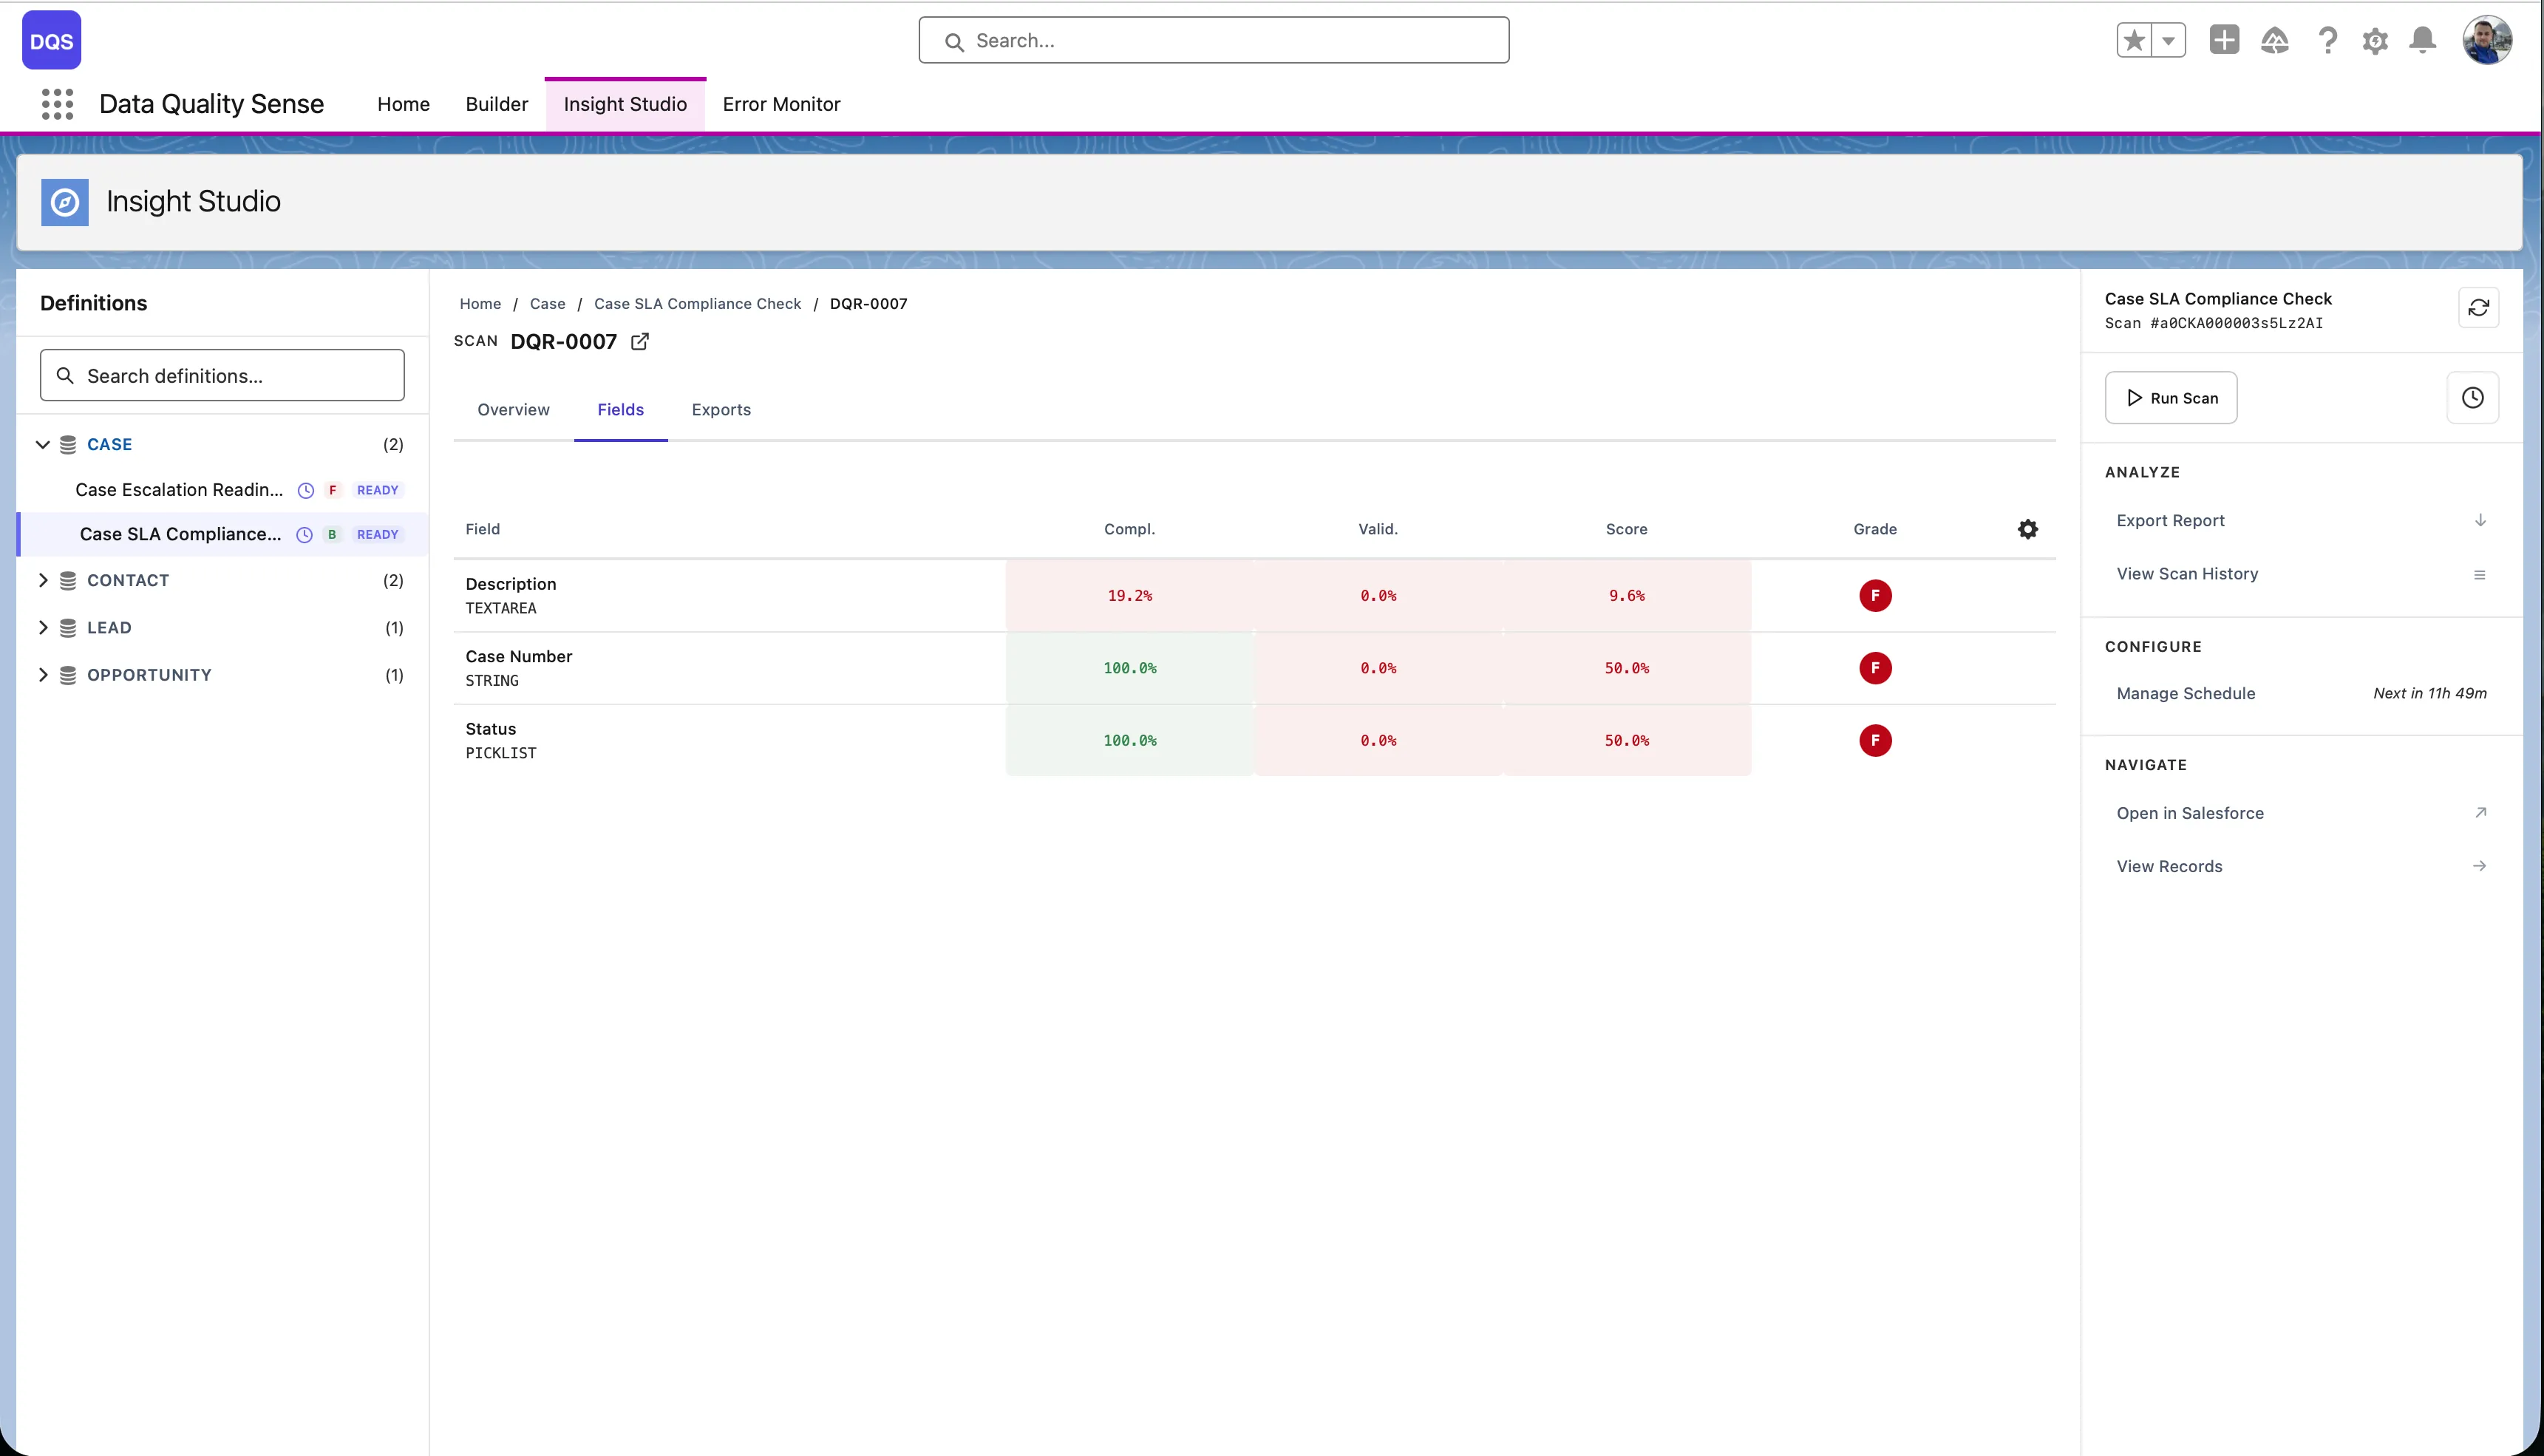
Section titled “Field Health Matrix”The field health matrix is a grid view showing every scanned field against every enabled dimension. Each cell displays the field’s score for that dimension, color-coded by grade.
Reading the Matrix
Section titled “Reading the Matrix”| Axis | Content |
|---|---|
| Rows | Individual fields (sorted by overall score, worst first) |
| Columns | Quality dimensions (Completeness, Validity, etc.) |
| Cells | Score (0–100) with color indicator |
Color Coding
Section titled “Color Coding”- Green cells — Score ≥ 90 (Excellent)
- Yellow cells — Score 50–89 (Fair to Good)
- Red cells — Score < 50 (Poor to Critical)
- Gray cells — Not applicable (dimension doesn’t apply to this field type)
Using the Matrix
Section titled “Using the Matrix”Identify Problem Fields
Section titled “Identify Problem Fields”Scan the matrix for rows with multiple red/yellow cells. These fields have quality issues across multiple dimensions.
Identify Problem Dimensions
Section titled “Identify Problem Dimensions”Look for columns with many red cells. These dimensions need attention across your dataset.
Drill Down
Section titled “Drill Down”Click any cell to navigate to the detailed field-dimension view, showing the specific metrics and records that contribute to that score.
Sorting and Filtering
Section titled “Sorting and Filtering”- Sort by score — Show the worst-performing fields first
- Filter by dimension — Focus on a specific quality dimension
- Filter by field type — Show only Text, Number, or Date fields